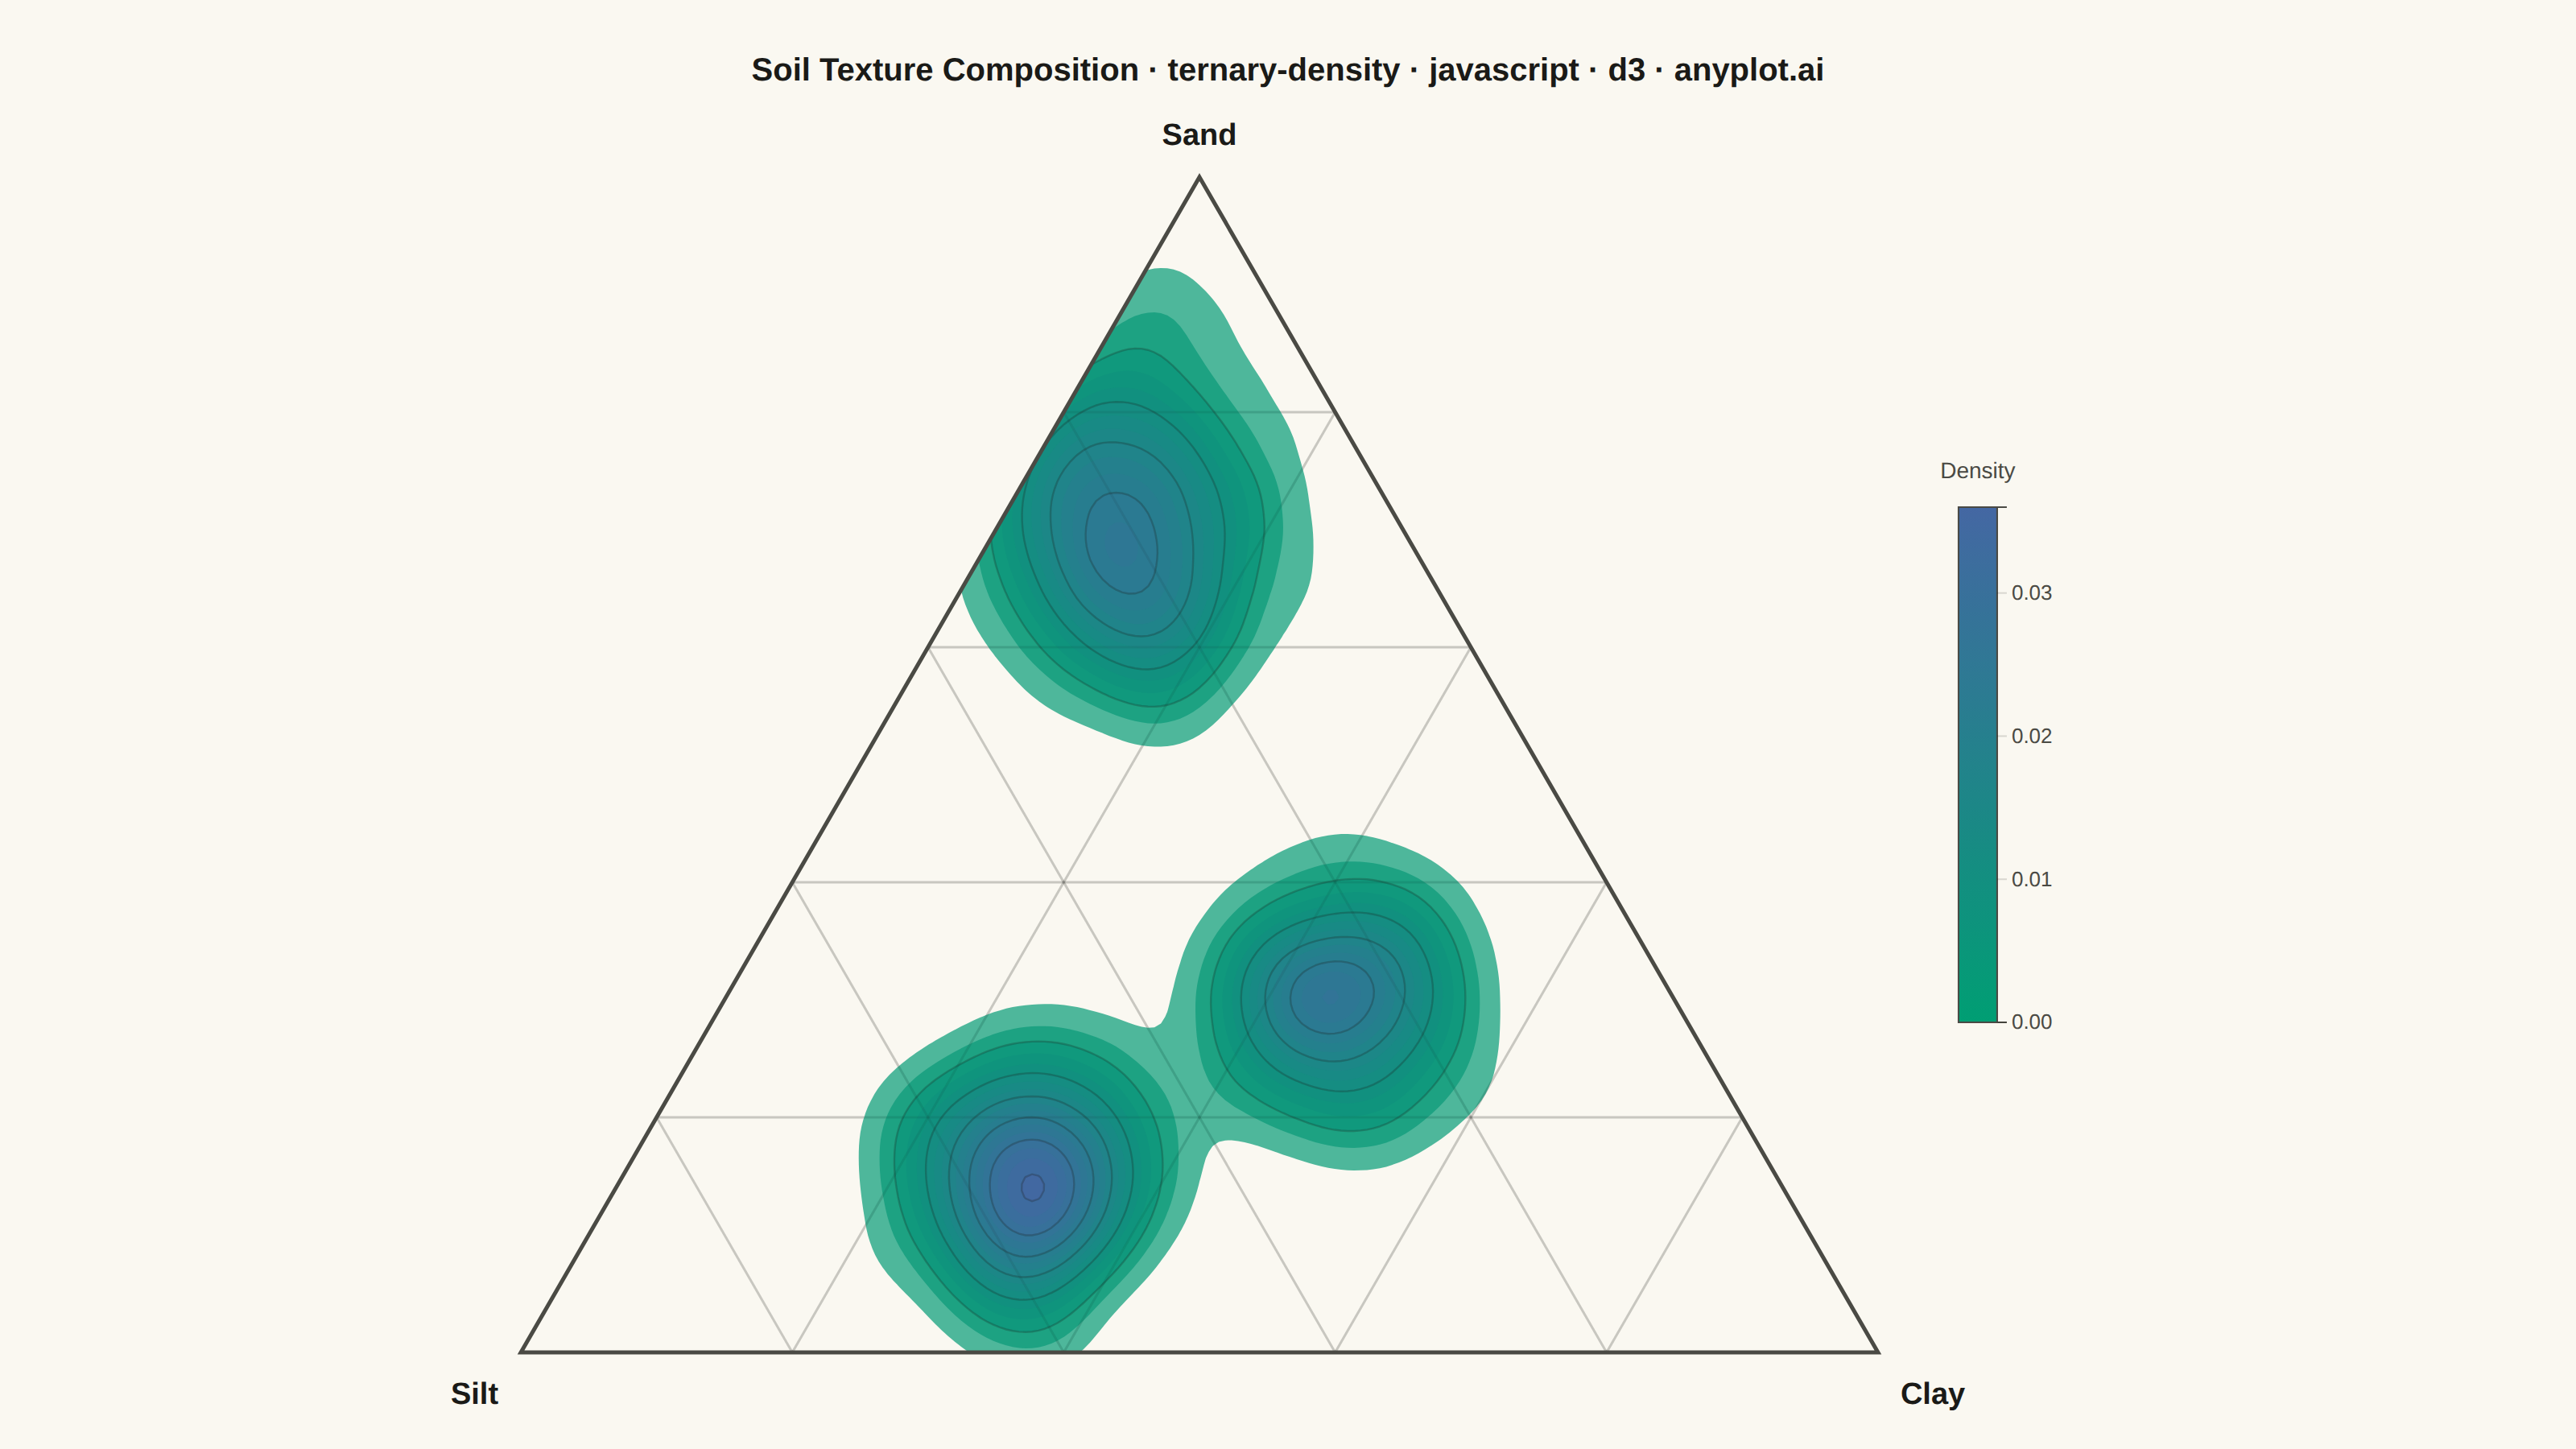
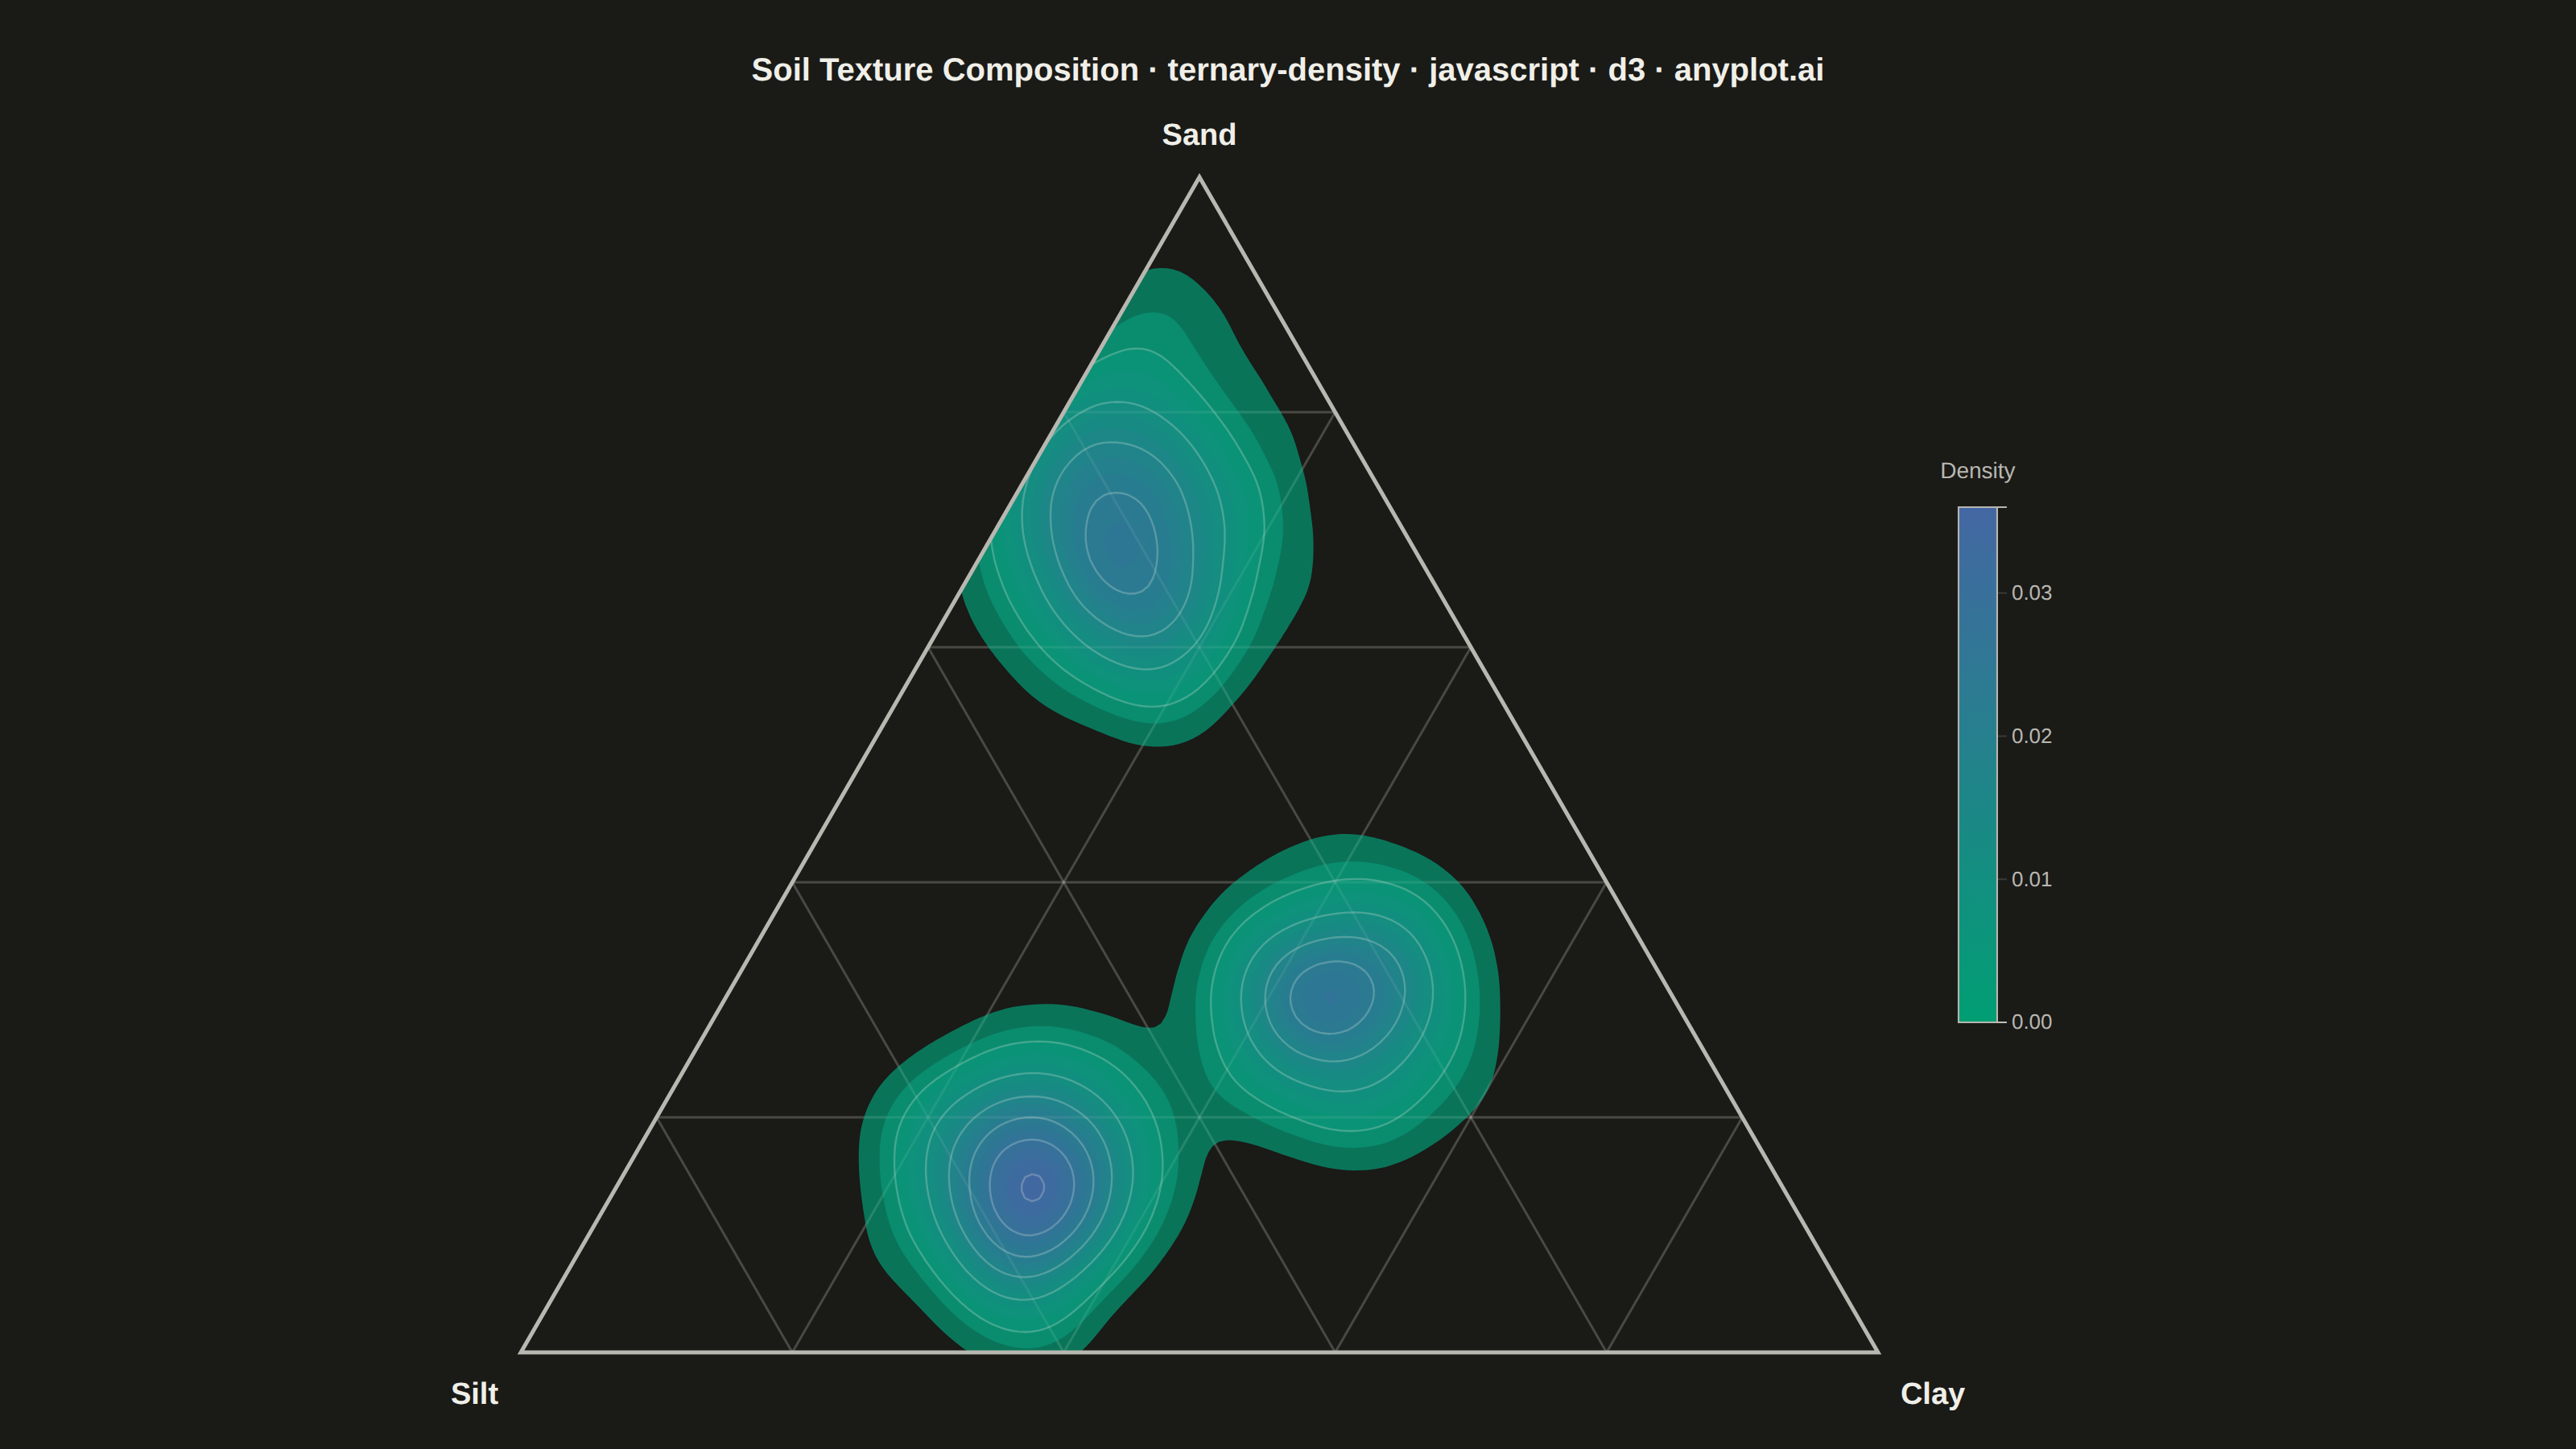
The same plot in 14 other libraries — JavaScript: Chart.js, Apache ECharts, Highcharts, MUI X Charts; Python: Altair, Bokeh, lets-plot, Matplotlib, Plotly, plotnine, Pygal, Seaborn; R: ggplot2; Julia: Makie.jl. Compare all 15 side by side: Ternary Density Plot in Python, R, Julia and JavaScript.
A ternary density plot combines a three-component ternary diagram with kernel density estimation to visualize where compositional data concentrates. Instead of showing individual points, this visualization uses a heatmap overlay to reveal the underlying probability distribution of compositions, making it ideal for identifying clusters, modes, and patterns in large compositional datasets.
// anyplot.ai
// ternary-density: Ternary Density Plot
// Library: d3 7.9.0 | JavaScript 22.23.2
// Quality: 90/100 | Created: 2026-09-02

//# anyplot-orientation: landscape
const t = window.ANYPLOT_TOKENS;
const { width, height } = window.ANYPLOT_SIZE;

// --- RNG (fixed-seed LCG — the browser has no seeded Math.random) -----------
function makeRng(seed) {
  let state = seed;
  return function () {
    state = (state * 16807) % 2147483647;
    return (state - 1) / 2147483646;
  };
}
const rng = makeRng(42);

// --- Data: synthetic soil-texture samples (sand / silt / clay), three modes -
function sampleCluster(center, spread, count) {
  const points = [];
  for (let i = 0; i < count; i++) {
    const jitter = () => spread * (rng() + rng() + rng() - 1.5);
    const sand = Math.max(center[0] + jitter(), 1);
    const silt = Math.max(center[1] + jitter(), 1);
    const clay = Math.max(center[2] + jitter(), 1);
    const total = sand + silt + clay;
    points.push({ sand: (100 * sand) / total, silt: (100 * silt) / total, clay: (100 * clay) / total });
  }
  return points;
}

const samples = [
  ...sampleCluster([70, 20, 10], 14, 500), // sandy loam
  ...sampleCluster([15, 55, 30], 12, 450), // silty clay loam
  ...sampleCluster([30, 25, 45], 13, 350), // clay loam
];

// --- Layout -------------------------------------------------------------------
const margin = { top: 110, right: 170, bottom: 60, left: 60 };
const iw = width - margin.left - margin.right;
const ih = height - margin.top - margin.bottom;

const side = Math.min(iw, (ih * 2) / Math.sqrt(3));
const triHeight = (side * Math.sqrt(3)) / 2;
const offsetX = margin.left + (iw - side) / 2;
const offsetY = margin.top + (ih - triHeight) / 2;

const apex = [side / 2, 0]; // sand = 100%
const bottomLeft = [0, triHeight]; // silt = 100%
const bottomRight = [side, triHeight]; // clay = 100%

function project(sand, silt, clay) {
  const fa = sand / 100;
  const fb = silt / 100;
  const fc = clay / 100;
  return [
    fa * apex[0] + fb * bottomLeft[0] + fc * bottomRight[0],
    fa * apex[1] + fb * bottomLeft[1] + fc * bottomRight[1],
  ];
}

const points = samples.map((d) => {
  const [px, py] = project(d.sand, d.silt, d.clay);
  return { ...d, px, py };
});

// --- SVG mount ------------------------------------------------------------
const svg = d3.select("#container").append("svg").attr("width", width).attr("height", height);
const g = svg.append("g").attr("transform", `translate(${offsetX},${offsetY})`);

const trianglePoints = [apex, bottomLeft, bottomRight].map((p) => p.join(",")).join(" ");
svg.append("clipPath").attr("id", "tri-clip").append("polygon").attr("points", trianglePoints);

function drawGrid(target, strokeOpacity) {
  for (const lvl of [20, 40, 60, 80]) {
    const lines = [
      [project(lvl, 100 - lvl, 0), project(lvl, 0, 100 - lvl)], // constant sand
      [project(100 - lvl, lvl, 0), project(0, lvl, 100 - lvl)], // constant silt
      [project(100 - lvl, 0, lvl), project(0, 100 - lvl, lvl)], // constant clay
    ];
    for (const [[x1, y1], [x2, y2]] of lines) {
      target.append("line").attr("x1", x1).attr("y1", y1).attr("x2", x2).attr("y2", y2)
        .attr("stroke", t.grid).attr("stroke-width", 1.5).attr("stroke-opacity", strokeOpacity);
    }
  }
}

// Base grid pass for the empty triangle area outside the density blobs.
drawGrid(g.append("g"), 1);

// --- Kernel density estimate over the ternary plane, clipped to the triangle
const densityContours = d3.contourDensity()
  .x((d) => d.px).y((d) => d.py)
  .size([side, triHeight])
  .bandwidth(22)
  .thresholds(14)(points);

const maxDensity = d3.max(densityContours, (d) => d.value);
const colorScale = d3.scaleSequential(d3.interpolateRgbBasis(t.seq)).domain([0, maxDensity]);
const geoPath = d3.geoPath();

const contourG = g.append("g").attr("clip-path", "url(#tri-clip)");

contourG.selectAll("path.band").data(densityContours).join("path")
  .attr("class", "band")
  .attr("d", geoPath)
  .attr("fill", (d) => colorScale(d.value))
  .attr("fill-opacity", 0.7)
  .attr("stroke", "none");

// Key density levels get a subtle outline so bands read individually.
const keyLevels = densityContours.filter((_, i) => i % 3 === 2);
contourG.selectAll("path.level").data(keyLevels).join("path")
  .attr("class", "level")
  .attr("d", geoPath)
  .attr("fill", "none")
  .attr("stroke", t.ink)
  .attr("stroke-opacity", 0.25)
  .attr("stroke-width", 1.2);

// Re-drawn on top of the density fill (clipped to the triangle) so the grid
// stays legible through the color, per spec's "grid visible beneath density
// with appropriate transparency" — a stack of overlapping contour bands would
// otherwise hide it no matter how transparent a single band is.
drawGrid(contourG.append("g"), 0.55);

// --- Triangle frame + vertex labels ------------------------------------------
g.append("polygon").attr("points", trianglePoints)
  .attr("fill", "none").attr("stroke", t.inkSoft).attr("stroke-width", 2.5);

const vertexLabels = [
  { pos: apex, dx: 0, dy: -20, anchor: "middle", text: "Sand" },
  { pos: bottomLeft, dx: -14, dy: 32, anchor: "end", text: "Silt" },
  { pos: bottomRight, dx: 14, dy: 32, anchor: "start", text: "Clay" },
];
for (const v of vertexLabels) {
  g.append("text")
    .attr("x", v.pos[0] + v.dx).attr("y", v.pos[1] + v.dy)
    .attr("text-anchor", v.anchor)
    .style("font-size", "19px").style("font-weight", "600")
    .attr("fill", t.ink)
    .text(v.text);
}

// --- Density legend (anchored to the triangle's own right edge, not the
// canvas margin, so it sits snug beside the plot rather than floating in it) -
const legendWidth = 24;
const legendHeight = 320;
const legendGap = 50;
const legendX = offsetX + side + legendGap;
const legendY = offsetY + (triHeight - legendHeight) / 2;

const gradient = svg.append("defs").append("linearGradient")
  .attr("id", "density-gradient")
  .attr("x1", "0%").attr("y1", "100%").attr("x2", "0%").attr("y2", "0%");
gradient.selectAll("stop").data(d3.range(0, 1.01, 0.1)).join("stop")
  .attr("offset", (d) => `${d * 100}%`)
  .attr("stop-color", (d) => colorScale(d * maxDensity));

const legendG = svg.append("g").attr("transform", `translate(${legendX},${legendY})`);
legendG.append("rect")
  .attr("width", legendWidth).attr("height", legendHeight)
  .attr("fill", "url(#density-gradient)")
  .attr("stroke", t.inkSoft).attr("stroke-width", 1);

const legendScale = d3.scaleLinear().domain([0, maxDensity]).range([legendHeight, 0]);
const legendAxisG = legendG.append("g")
  .attr("transform", `translate(${legendWidth},0)`)
  .call(d3.axisRight(legendScale).ticks(5).tickSize(6));
legendAxisG.selectAll("text").attr("fill", t.inkSoft).style("font-size", "13px");
legendAxisG.selectAll("line").attr("stroke", t.grid);
legendAxisG.select(".domain").attr("stroke", t.inkSoft);

legendG.append("text")
  .attr("x", legendWidth / 2).attr("y", -18)
  .attr("text-anchor", "middle")
  .style("font-size", "14px").attr("fill", t.inkSoft)
  .text("Density");

// --- Title --------------------------------------------------------------
svg.append("text")
  .attr("x", width / 2).attr("y", 50)
  .attr("text-anchor", "middle")
  .attr("fill", t.ink).style("font-size", "20px").style("font-weight", "600")
  .text("Soil Texture Composition · ternary-density · javascript · d3 · anyplot.ai");
Runnable source as JSON, for any HTTP client: https://api.anyplot.ai/specs/ternary-density/d3/code. Any spec id and library id listed in llms-full.txt fit the same URL shape; every URL below is complete and callable.
{
  "spec_id": "ternary-density",
  "language": "javascript",
  "library": "d3",
  "page": "https://anyplot.ai/ternary-density/javascript/d3",
  "hub": "https://anyplot.ai/ternary-density",
  "code_json": "https://api.anyplot.ai/specs/ternary-density/d3/code",
  "spec_json": "https://api.anyplot.ai/specs/ternary-density",
  "render_light_png": "https://storage.googleapis.com/anyplot-images/plots/ternary-density/javascript/d3/plot-light.png",
  "render_dark_png": "https://storage.googleapis.com/anyplot-images/plots/ternary-density/javascript/d3/plot-dark.png",
  "interactive_light_html": "https://storage.googleapis.com/anyplot-images/plots/ternary-density/javascript/d3/plot-light.html",
  "interactive_dark_html": "https://storage.googleapis.com/anyplot-images/plots/ternary-density/javascript/d3/plot-dark.html",
  "quality_score": 90.0,
  "license": "MIT",
  "guide": "https://anyplot.ai/llms.txt"
}
Part of Ternary Density Plot on anyplot.ai.