The same plot in 14 other libraries — JavaScript: Chart.js, D3.js, Highcharts, MUI X Charts; Python: Altair, Bokeh, lets-plot, Matplotlib, Plotly, plotnine, Pygal, Seaborn; R: ggplot2; Julia: Makie.jl. Compare all 15 side by side: Ternary Density Plot in Python, R, Julia and JavaScript.
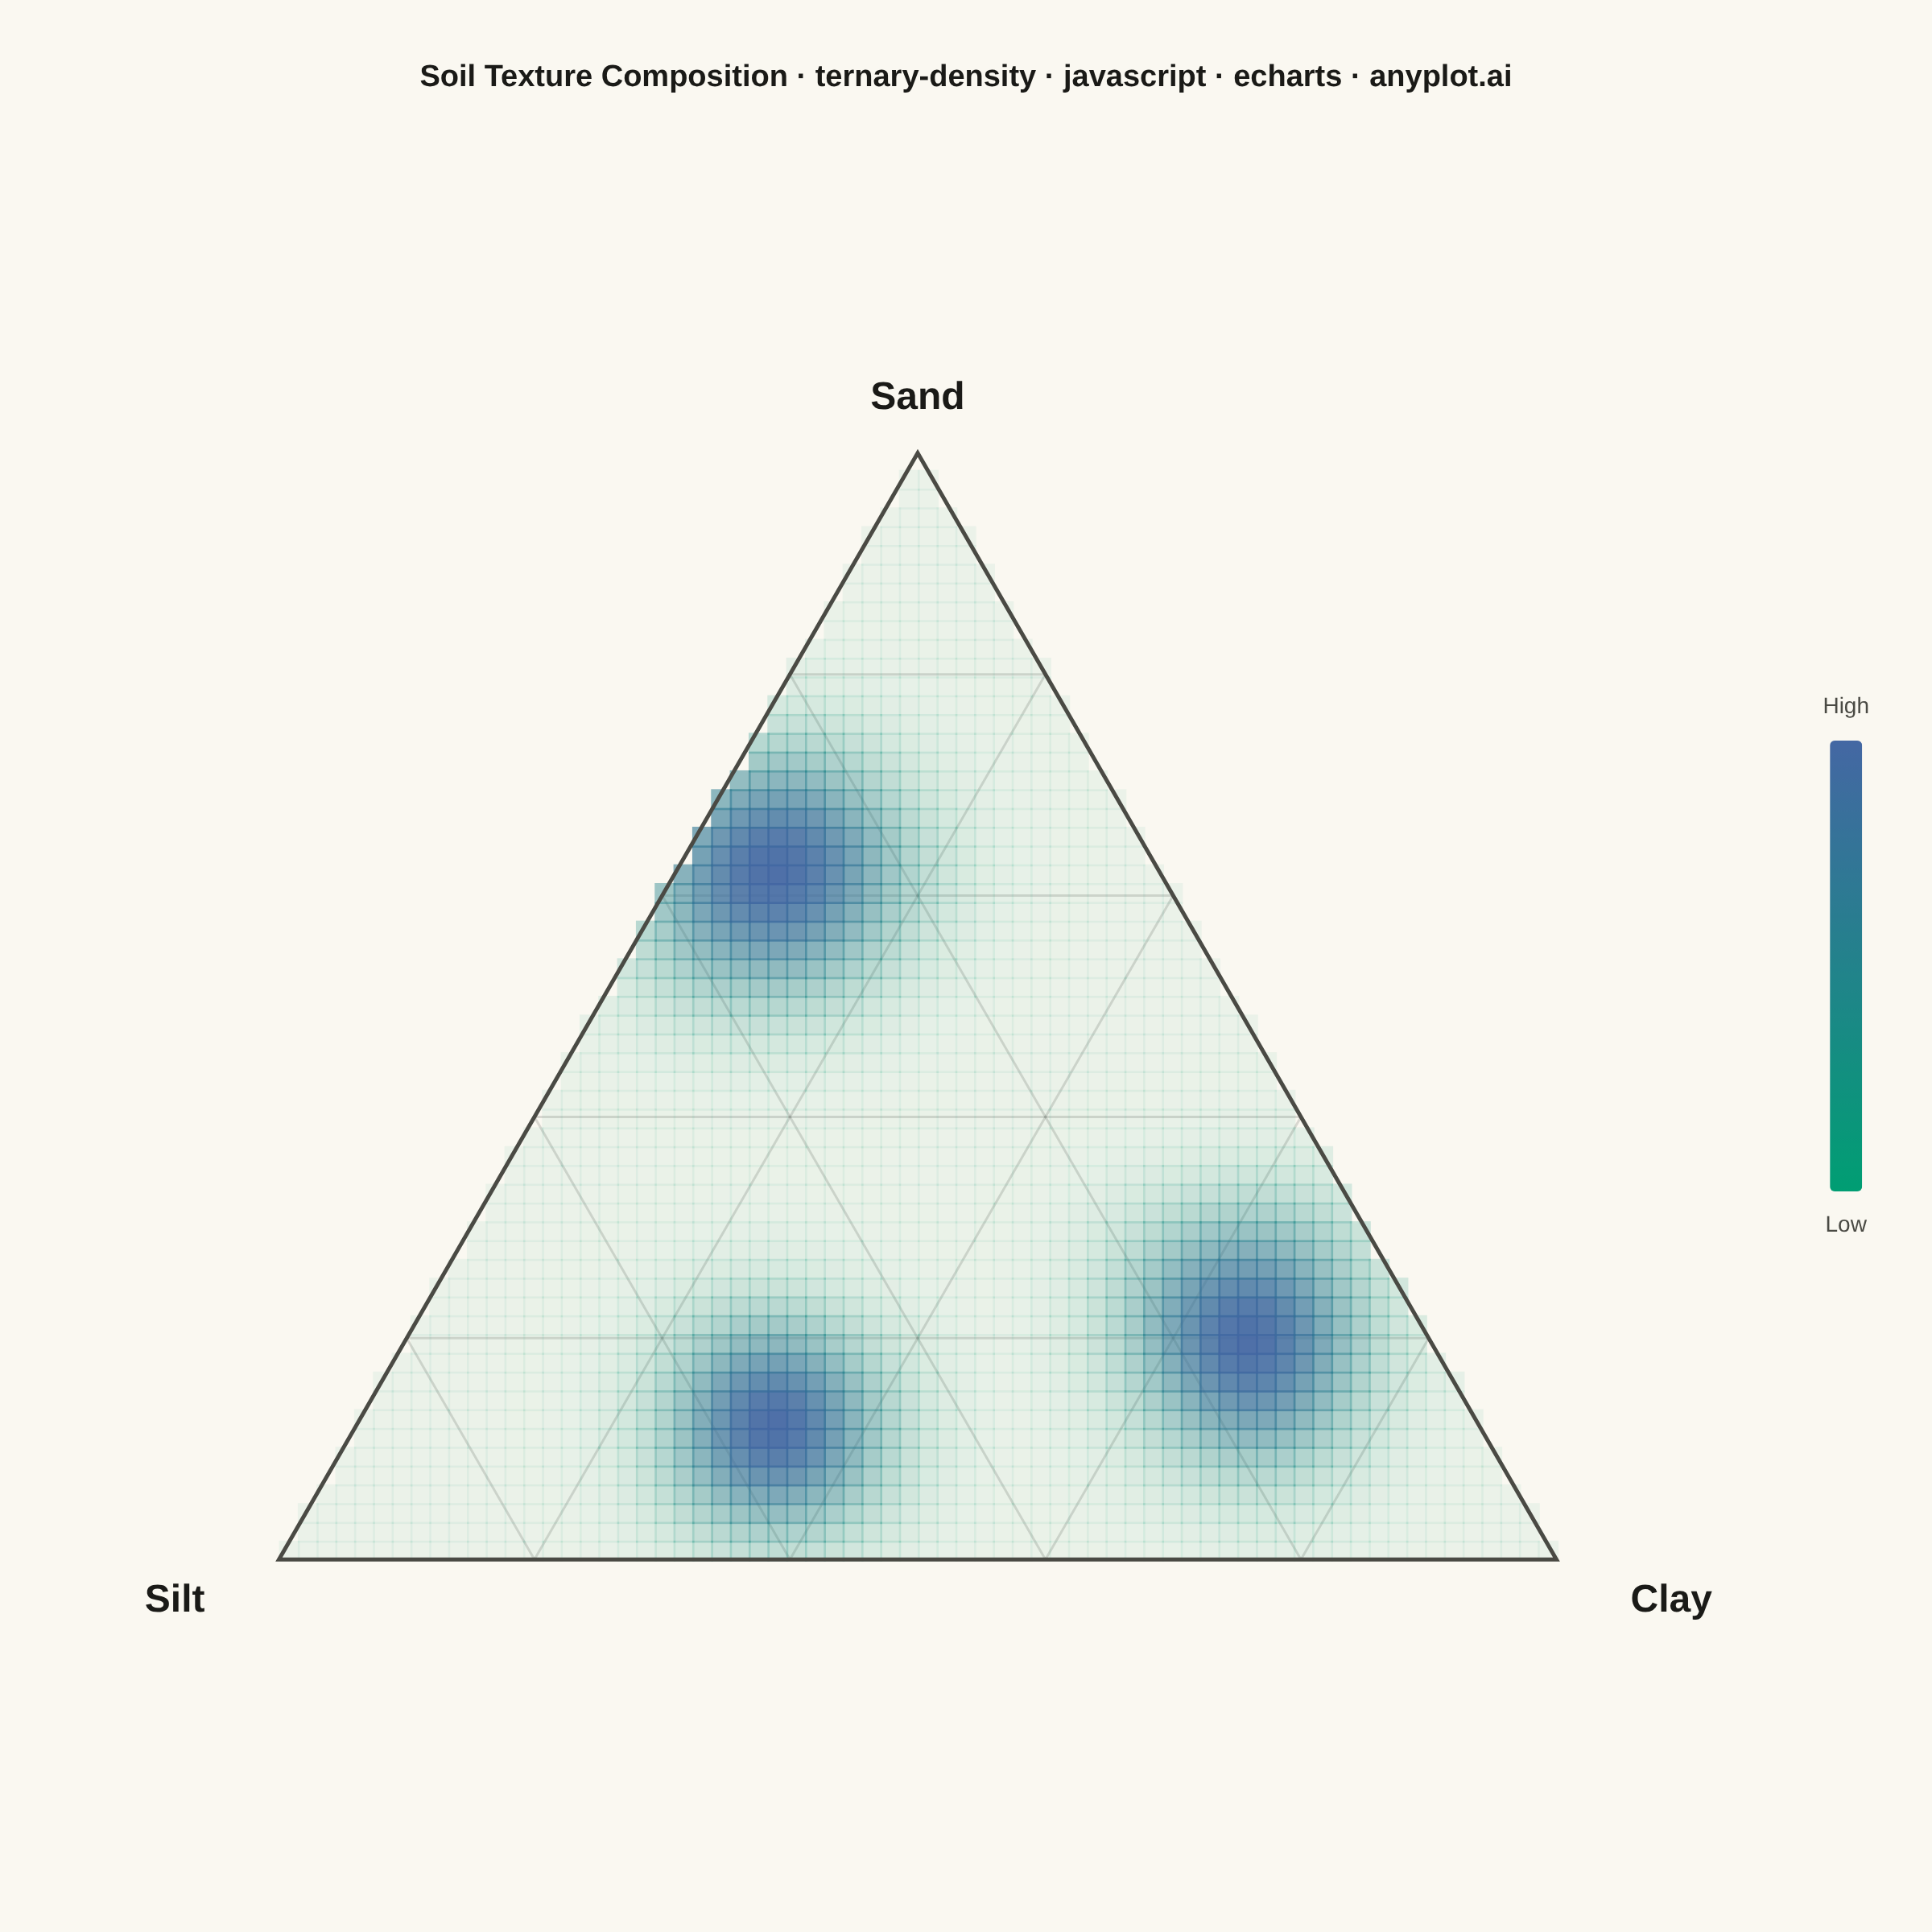
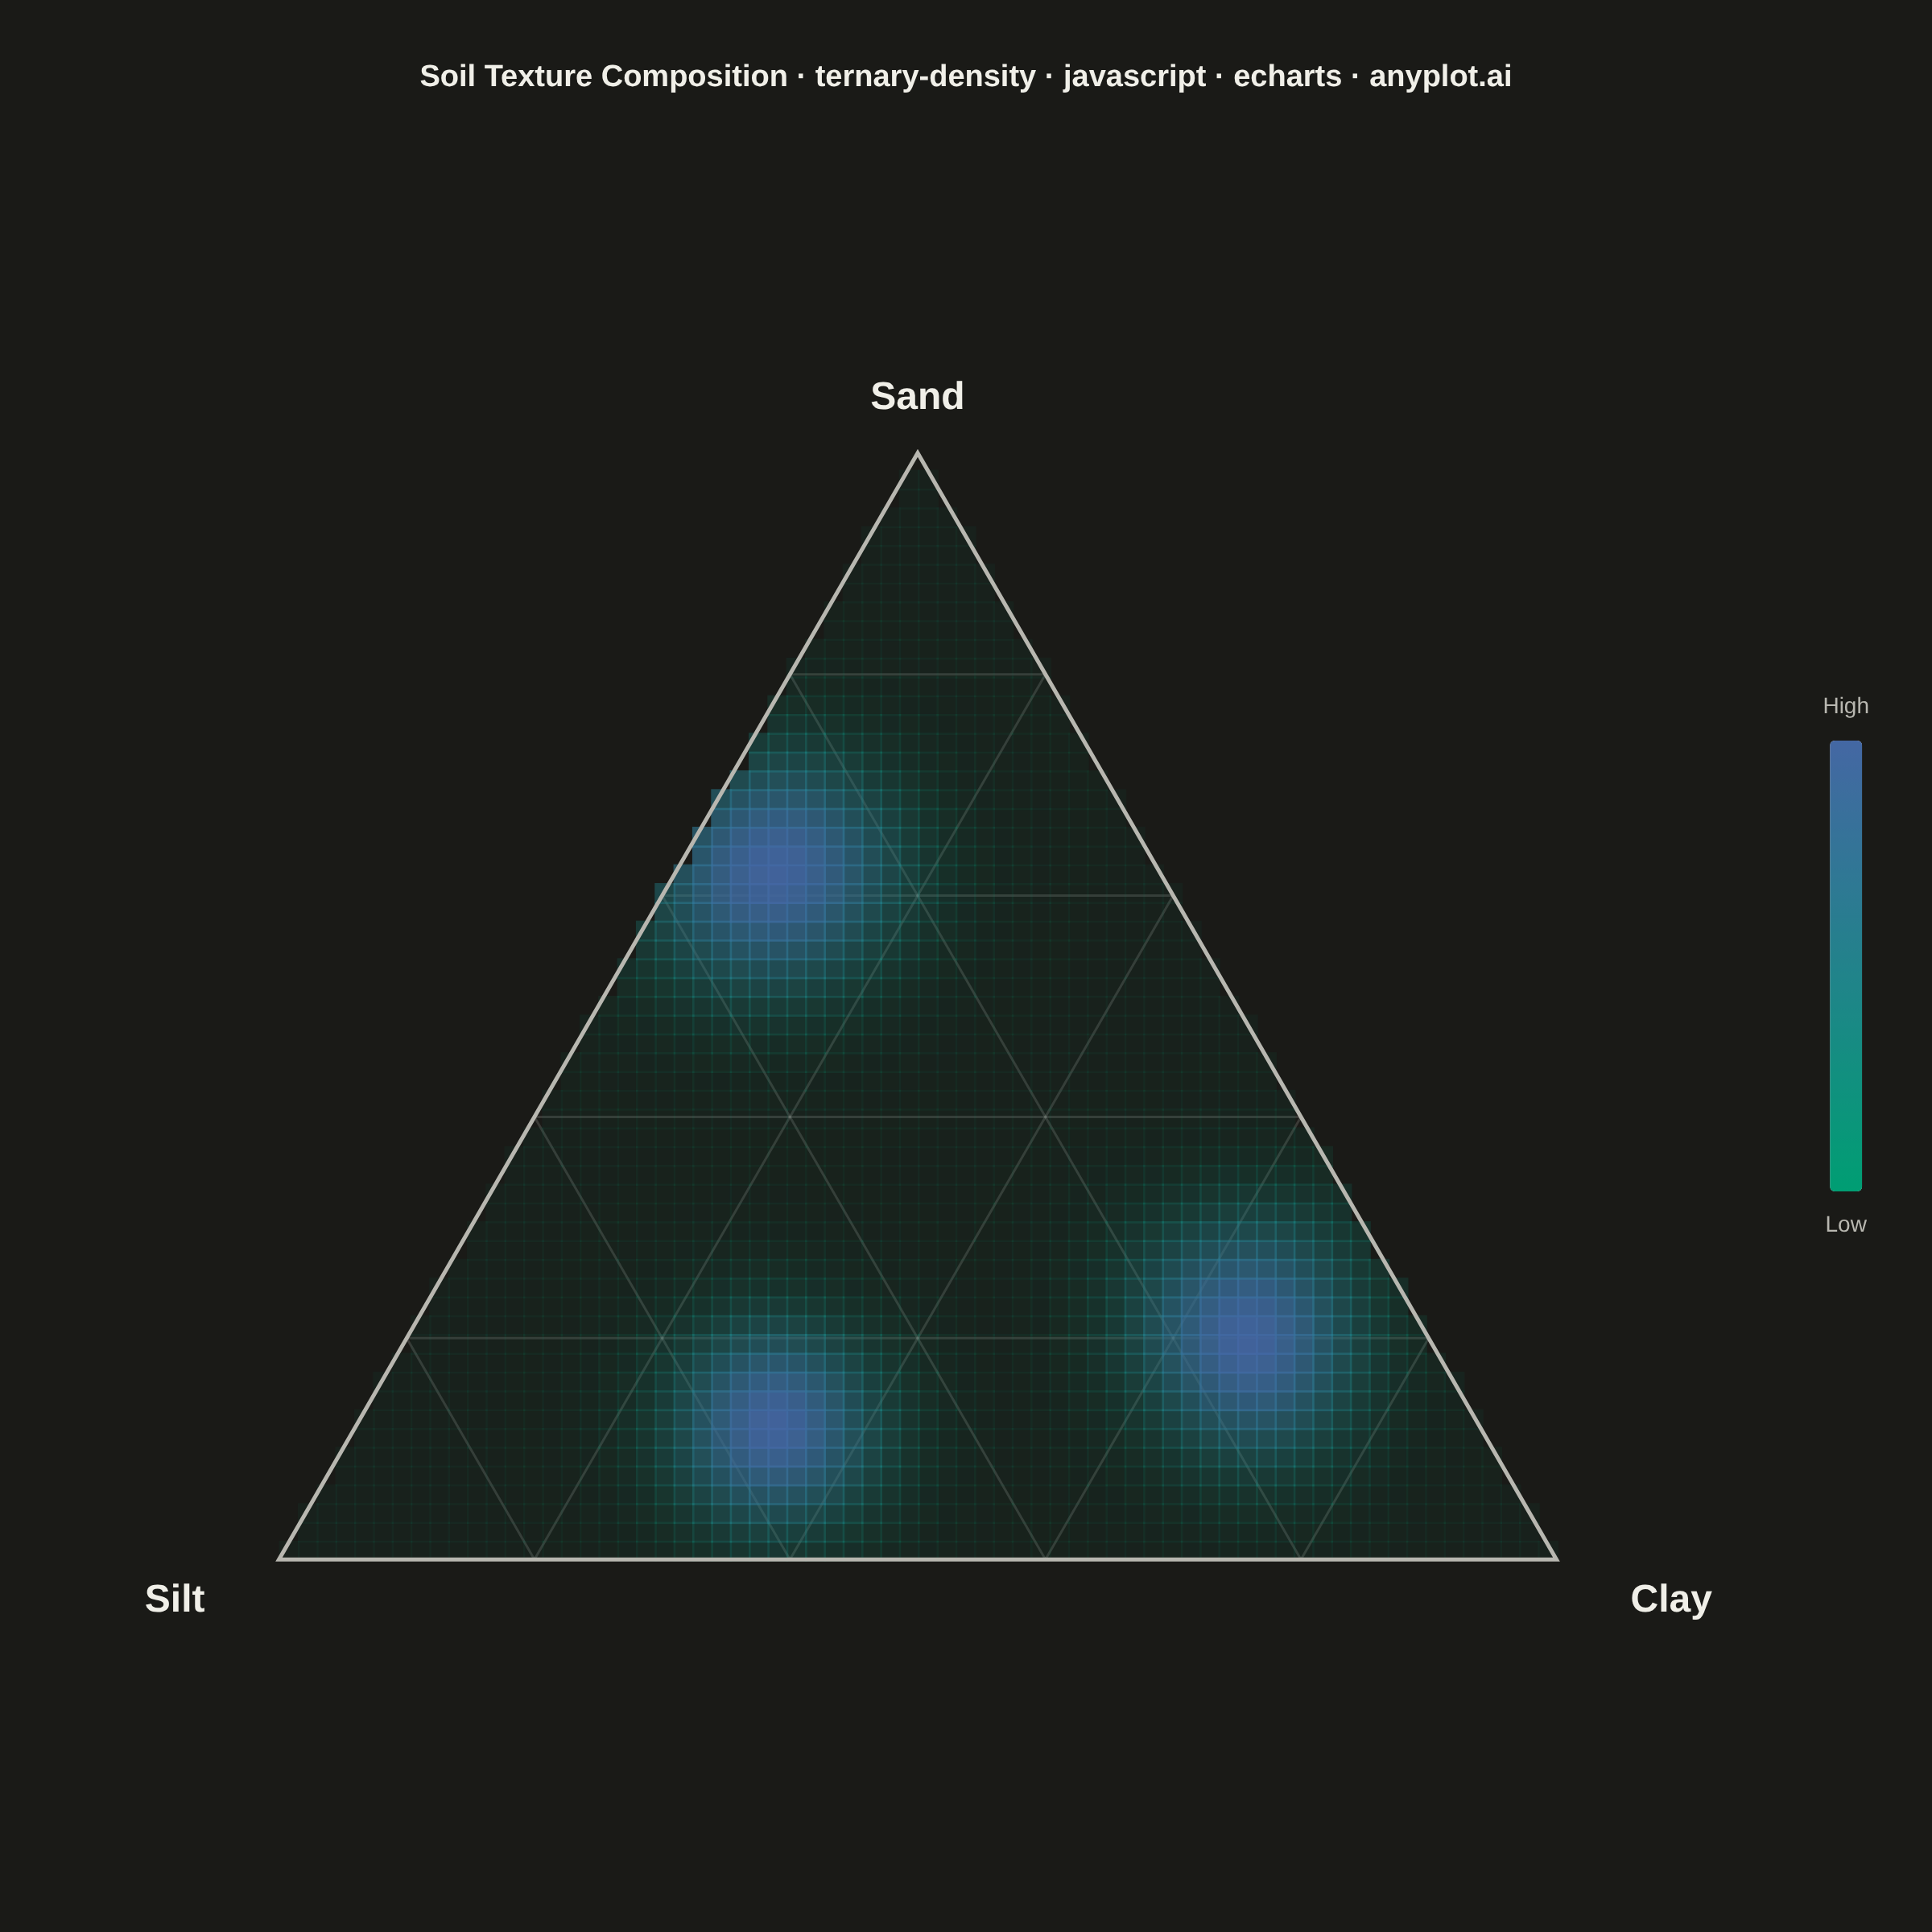
A ternary density plot combines a three-component ternary diagram with kernel density estimation to visualize where compositional data concentrates. Instead of showing individual points, this visualization uses a heatmap overlay to reveal the underlying probability distribution of compositions, making it ideal for identifying clusters, modes, and patterns in large compositional datasets.
// anyplot.ai
// ternary-density: Ternary Density Plot
// Library: echarts 6.1.0 | JavaScript 22.23.2
// Quality: 89/100 | Created: 2026-09-02
//# anyplot-orientation: square

const t = window.ANYPLOT_TOKENS;

// --- Small fixed-seed PRNG (LCG) + Box-Muller gaussian ----------------------
function makeRng(seed) {
  let s = seed >>> 0;
  return function () {
    s = (Math.imul(s, 1664525) + 1013904223) >>> 0;
    return s / 4294967296;
  };
}
const rng = makeRng(42);
function gaussian() {
  const u1 = Math.max(rng(), 1e-12);
  const u2 = rng();
  return Math.sqrt(-2 * Math.log(u1)) * Math.cos(2 * Math.PI * u2);
}

// --- Barycentric <-> Cartesian projection (equilateral triangle) -----------
// Vertices: A (component_a, top), B (component_b, bottom-left), C (component_c, bottom-right)
const H = Math.sqrt(3) / 2;
function baryToCart(a, b, c) {
  return [0.5 * a + c, a * H];
}
function cartToBary(x, y) {
  const a = y / H;
  const c = x - 0.5 * a;
  const b = 1 - a - c;
  return [a, b, c];
}
function clipToSimplex(a, b, c) {
  a = Math.max(a, 0);
  b = Math.max(b, 0);
  c = Math.max(c, 0);
  const s = a + b + c || 1;
  return [a / s, b / s, c / s];
}

// --- Data: soil texture composition (sand / silt / clay), 3 sample clusters -
// component_a = sand, component_b = silt, component_c = clay (fractions of 1)
const clusters = [
  { a: 0.62, b: 0.3, c: 0.08, n: 300, sigma: 0.055 }, // sandy loam
  { a: 0.12, b: 0.55, c: 0.33, n: 250, sigma: 0.045 }, // silty clay loam
  { a: 0.2, b: 0.15, c: 0.65, n: 150, sigma: 0.05 }, // clay-rich
];
const samplesByCluster = clusters.map((cl) => {
  const [cx, cy] = baryToCart(cl.a, cl.b, cl.c);
  const pts = [];
  for (let i = 0; i < cl.n; i++) {
    const x = cx + gaussian() * cl.sigma;
    const y = cy + gaussian() * cl.sigma;
    const [a, b, c] = clipToSimplex(...cartToBary(x, y));
    pts.push(baryToCart(a, b, c));
  }
  return pts;
});

// --- Kernel density estimate on a fine grid, clipped to the triangle -------
// Density is estimated per cluster and each field is normalized to its own
// peak before combining (max across clusters), so all three modes read with
// comparable visual weight regardless of their sample count — the plot's
// purpose is revealing every mode, not weighting shade by how many points
// happened to be drawn from it.
const nx = 68;
const dx = 1 / nx;
const dy = dx;
const ny = Math.ceil(H / dy);
const bandwidth = 0.05;
const twoH2 = 2 * bandwidth * bandwidth;
const cells = [];
const clusterPeaks = samplesByCluster.map(() => 0);
const cellRows = [];
for (let iy = 0; iy < ny; iy++) {
  const cy = (iy + 0.5) * dy;
  for (let ix = 0; ix < nx; ix++) {
    const cx = (ix + 0.5) * dx;
    const [a, b, c] = cartToBary(cx, cy);
    if (a < -1e-6 || b < -1e-6 || c < -1e-6) continue;
    const clusterDensities = samplesByCluster.map((pts, ci) => {
      let density = 0;
      for (let k = 0; k < pts.length; k++) {
        const ddx = cx - pts[k][0];
        const ddy = cy - pts[k][1];
        density += Math.exp(-(ddx * ddx + ddy * ddy) / twoH2);
      }
      density /= pts.length;
      if (density > clusterPeaks[ci]) clusterPeaks[ci] = density;
      return density;
    });
    cellRows.push([cx, cy, clusterDensities]);
  }
}
let maxDensity = 0;
cellRows.forEach(([cx, cy, clusterDensities]) => {
  let density = 0;
  clusterDensities.forEach((d, ci) => {
    const norm = d / clusterPeaks[ci];
    if (norm > density) density = norm;
  });
  if (density > maxDensity) maxDensity = density;
  cells.push([cx, cy, density]);
});

// --- Ternary grid lines (20% intervals), drawn beneath the density layer ---
const gridFractions = [0.2, 0.4, 0.6, 0.8];
const gridSegments = [];
gridFractions.forEach((k) => {
  gridSegments.push([baryToCart(k, 1 - k, 0), baryToCart(k, 0, 1 - k)]); // constant sand
  gridSegments.push([baryToCart(1 - k, k, 0), baryToCart(0, k, 1 - k)]); // constant silt
  gridSegments.push([baryToCart(1 - k, 0, k), baryToCart(0, 1 - k, k)]); // constant clay
});

// --- Title (fontsize scales with title length, see default-style-guide.md) -
const TITLE = "Soil Texture Composition · ternary-density · javascript · echarts · anyplot.ai";
const titleFontSize = Math.max(15, Math.round(22 * Math.min(1, 67 / TITLE.length)));

// --- Init ---------------------------------------------------------------
const chart = echarts.init(document.getElementById("container"));

// --- Option ---------------------------------------------------------------
chart.setOption({
  animation: false,
  backgroundColor: "transparent",
  title: {
    text: TITLE,
    left: "center",
    top: 34,
    textStyle: { color: t.ink, fontSize: titleFontSize, fontWeight: 600 },
  },
  grid: { left: 130, right: 190, top: 210, bottom: 160 },
  xAxis: { type: "value", min: -0.0545, max: 1.0545, show: false },
  yAxis: { type: "value", min: -0.09, max: 0.956, show: false },
  visualMap: {
    type: "continuous",
    seriesIndex: 1,
    dimension: 2,
    min: 0,
    max: maxDensity,
    calculable: false,
    orient: "vertical",
    right: 24,
    top: "middle",
    itemWidth: 20,
    itemHeight: 280,
    text: ["High", "Low"],
    textGap: 14,
    textStyle: { color: t.inkSoft, fontSize: 14 },
    inRange: { color: t.seq },
  },
  series: [
    {
      // Ternary grid lines at 20% intervals, semi-transparent, beneath the density fill
      type: "custom",
      data: gridSegments.map(() => 0),
      renderItem: (params, api) => {
        const seg = gridSegments[params.dataIndex];
        return {
          type: "polyline",
          shape: { points: [api.coord(seg[0]), api.coord(seg[1])] },
          style: { stroke: t.grid, lineWidth: 1.5 },
        };
      },
      silent: true,
      z: 1,
    },
    {
      // KDE density heatmap over the compositional simplex
      type: "custom",
      data: cells,
      renderItem: (params, api) => {
        const x = api.value(0);
        const y = api.value(1);
        const pt = api.coord([x, y]);
        const size = api.size([dx, dy]);
        const norm = api.value(2) / maxDensity;
        return {
          type: "rect",
          shape: {
            x: pt[0] - size[0] / 2,
            y: pt[1] - size[1] / 2,
            width: Math.ceil(size[0]) + 1,
            height: Math.ceil(size[1]) + 1,
          },
          style: { fill: api.visual("color"), opacity: 0.06 + 0.88 * Math.pow(norm, 1.3) },
        };
      },
      silent: true,
      z: 2,
    },
    {
      // Triangle border
      type: "custom",
      data: [0],
      renderItem: (params, api) => ({
        type: "polygon",
        shape: {
          points: [baryToCart(1, 0, 0), baryToCart(0, 1, 0), baryToCart(0, 0, 1)].map((p) => api.coord(p)),
        },
        style: { fill: "none", stroke: t.inkSoft, lineWidth: 2.5 },
      }),
      silent: true,
      z: 3,
    },
    {
      // Vertex labels
      type: "custom",
      data: [baryToCart(1, 0, 0), baryToCart(0, 1, 0), baryToCart(0, 0, 1)],
      renderItem: (params, api) => {
        const idx = params.dataIndex;
        const labels = ["Sand", "Silt", "Clay"];
        const offsets = [
          [0, -34],
          [-46, 26],
          [46, 26],
        ];
        const aligns = ["center", "right", "left"];
        const pt = api.coord([api.value(0), api.value(1)]);
        return {
          type: "text",
          style: {
            text: labels[idx],
            x: pt[0] + offsets[idx][0],
            y: pt[1] + offsets[idx][1],
            fill: t.ink,
            fontSize: 24,
            fontWeight: "bold",
            align: aligns[idx],
            verticalAlign: "middle",
          },
        };
      },
      silent: true,
      z: 4,
    },
  ],
});

chart.on("finished", () => {
  window.__anyplotReady = true;
});
Runnable source as JSON, for any HTTP client: https://api.anyplot.ai/specs/ternary-density/echarts/code. Any spec id and library id listed in llms-full.txt fit the same URL shape; every URL below is complete and callable.
{
  "spec_id": "ternary-density",
  "language": "javascript",
  "library": "echarts",
  "page": "https://anyplot.ai/ternary-density/javascript/echarts",
  "hub": "https://anyplot.ai/ternary-density",
  "code_json": "https://api.anyplot.ai/specs/ternary-density/echarts/code",
  "spec_json": "https://api.anyplot.ai/specs/ternary-density",
  "render_light_png": "https://storage.googleapis.com/anyplot-images/plots/ternary-density/javascript/echarts/plot-light.png",
  "render_dark_png": "https://storage.googleapis.com/anyplot-images/plots/ternary-density/javascript/echarts/plot-dark.png",
  "interactive_light_html": "https://storage.googleapis.com/anyplot-images/plots/ternary-density/javascript/echarts/plot-light.html",
  "interactive_dark_html": "https://storage.googleapis.com/anyplot-images/plots/ternary-density/javascript/echarts/plot-dark.html",
  "quality_score": 89.0,
  "license": "MIT",
  "guide": "https://anyplot.ai/llms.txt"
}
Part of Ternary Density Plot on anyplot.ai.