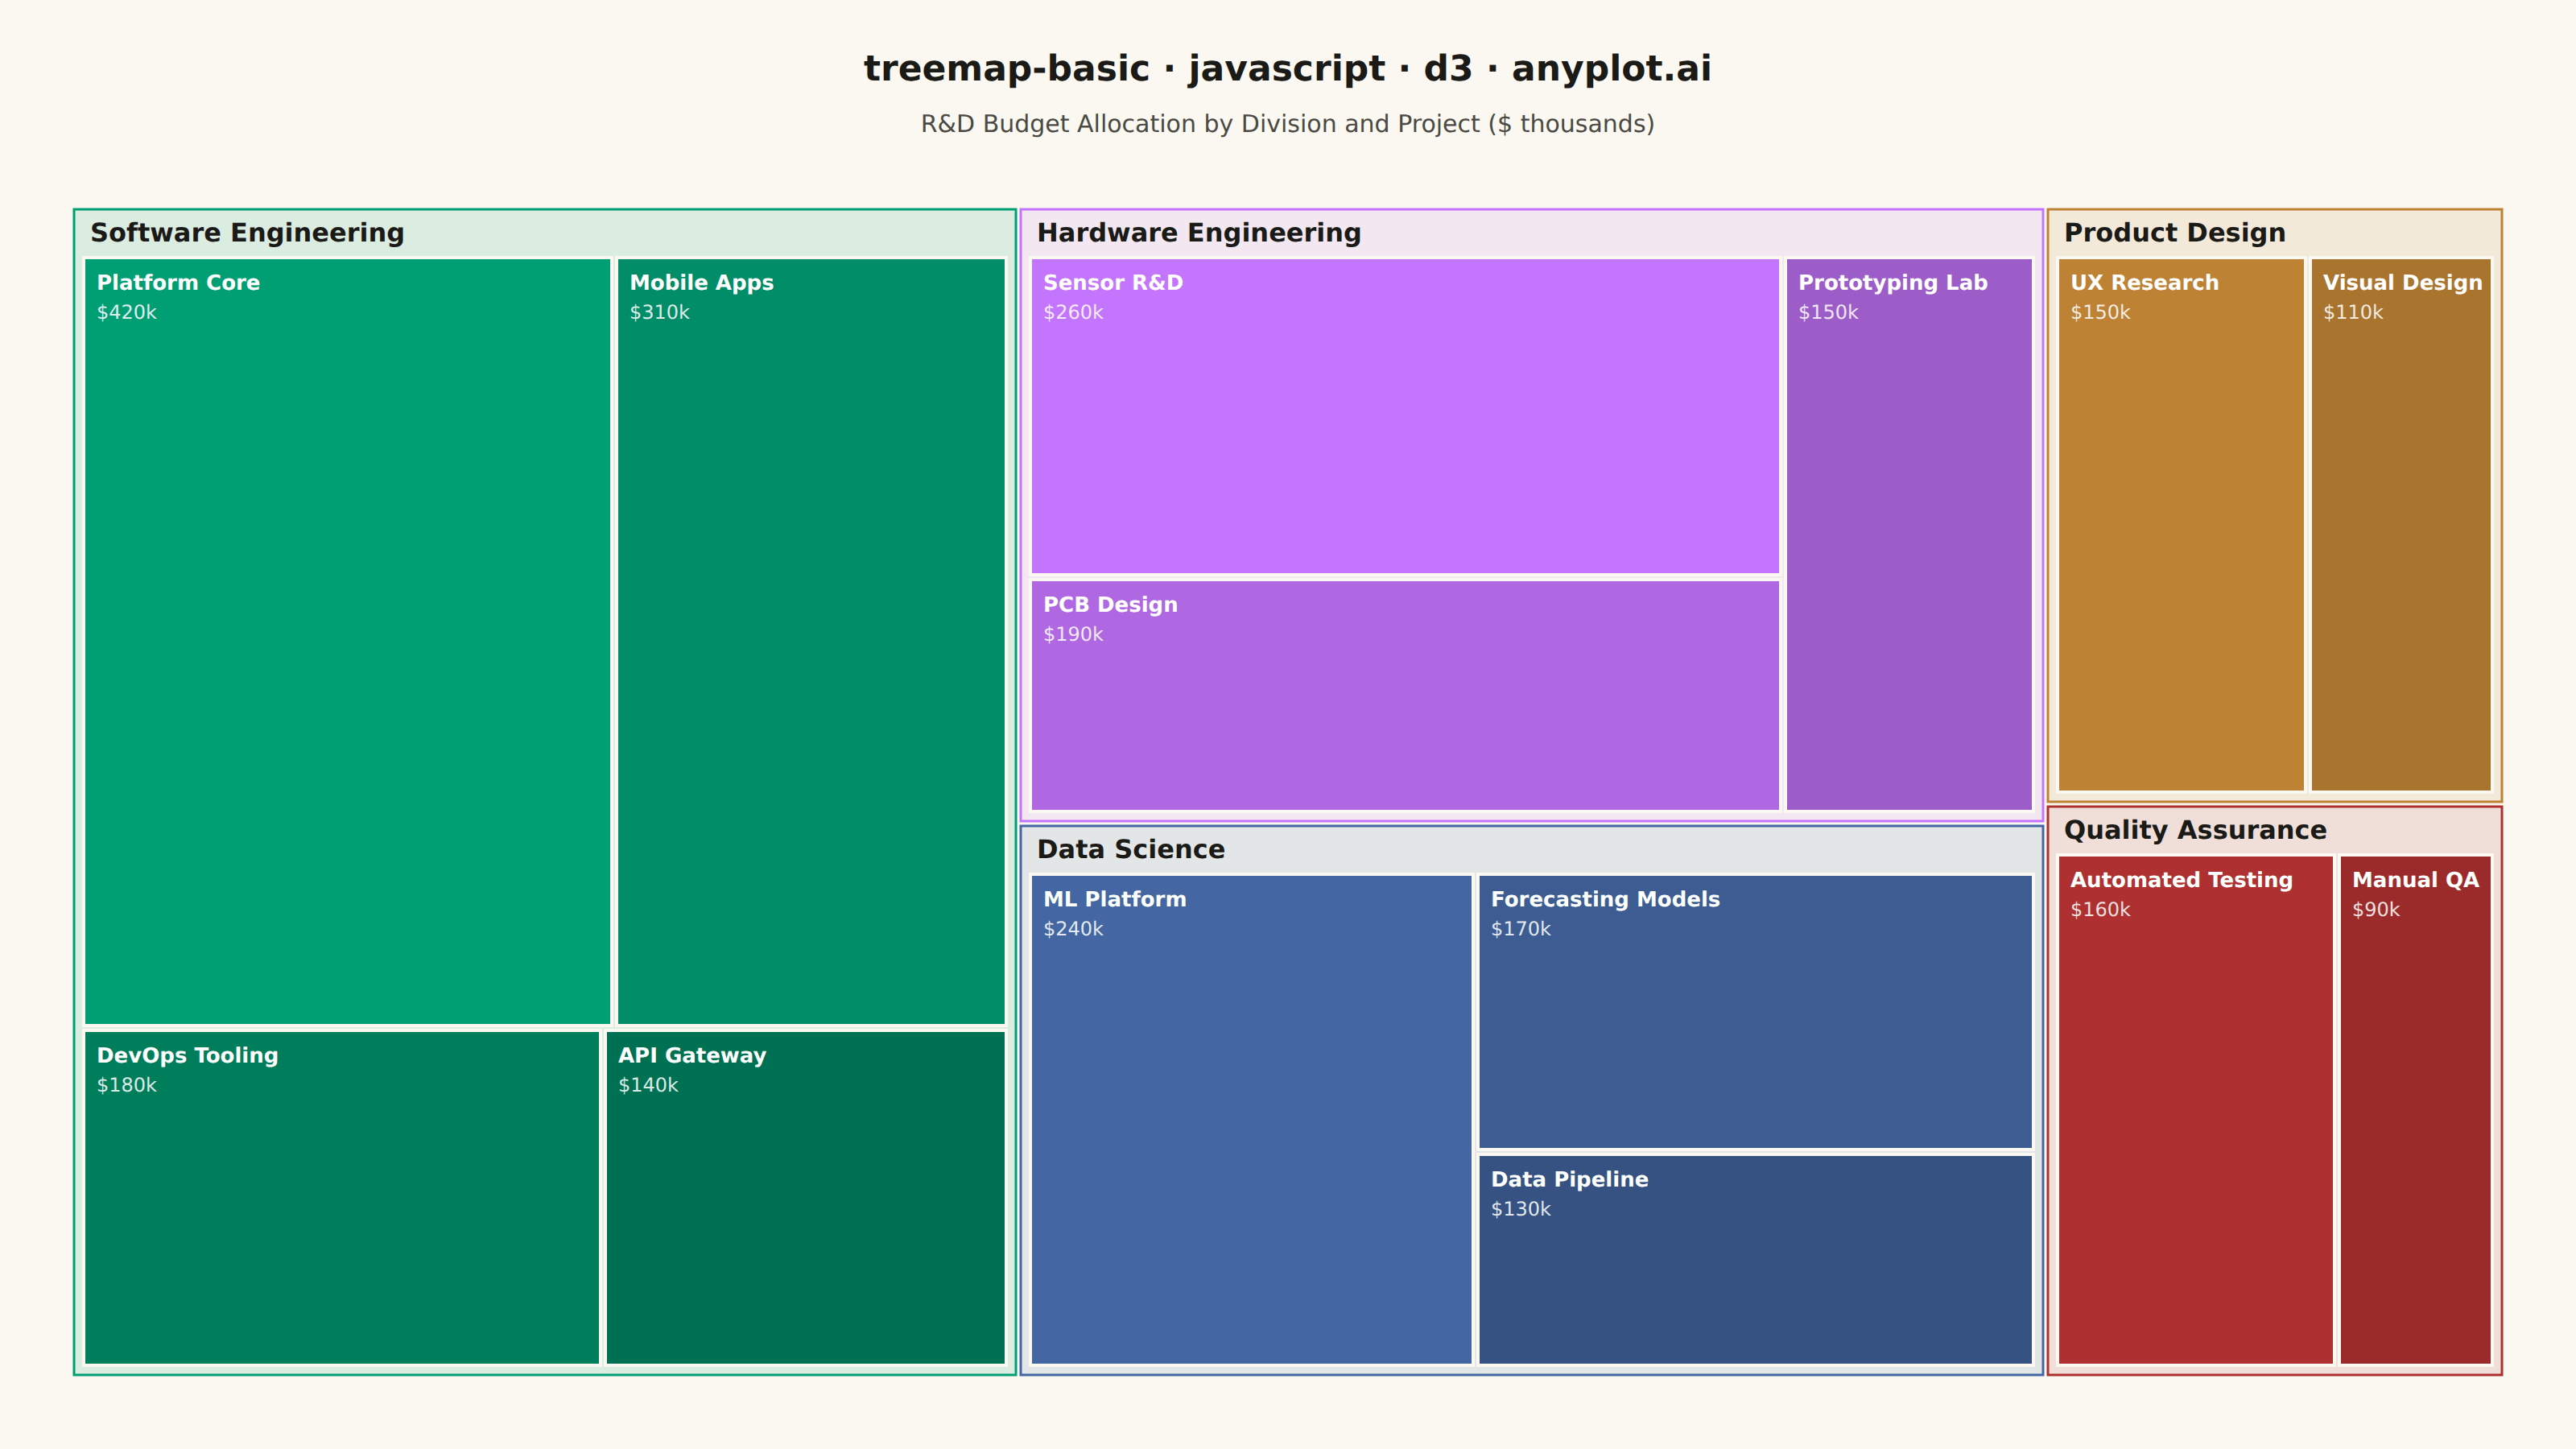
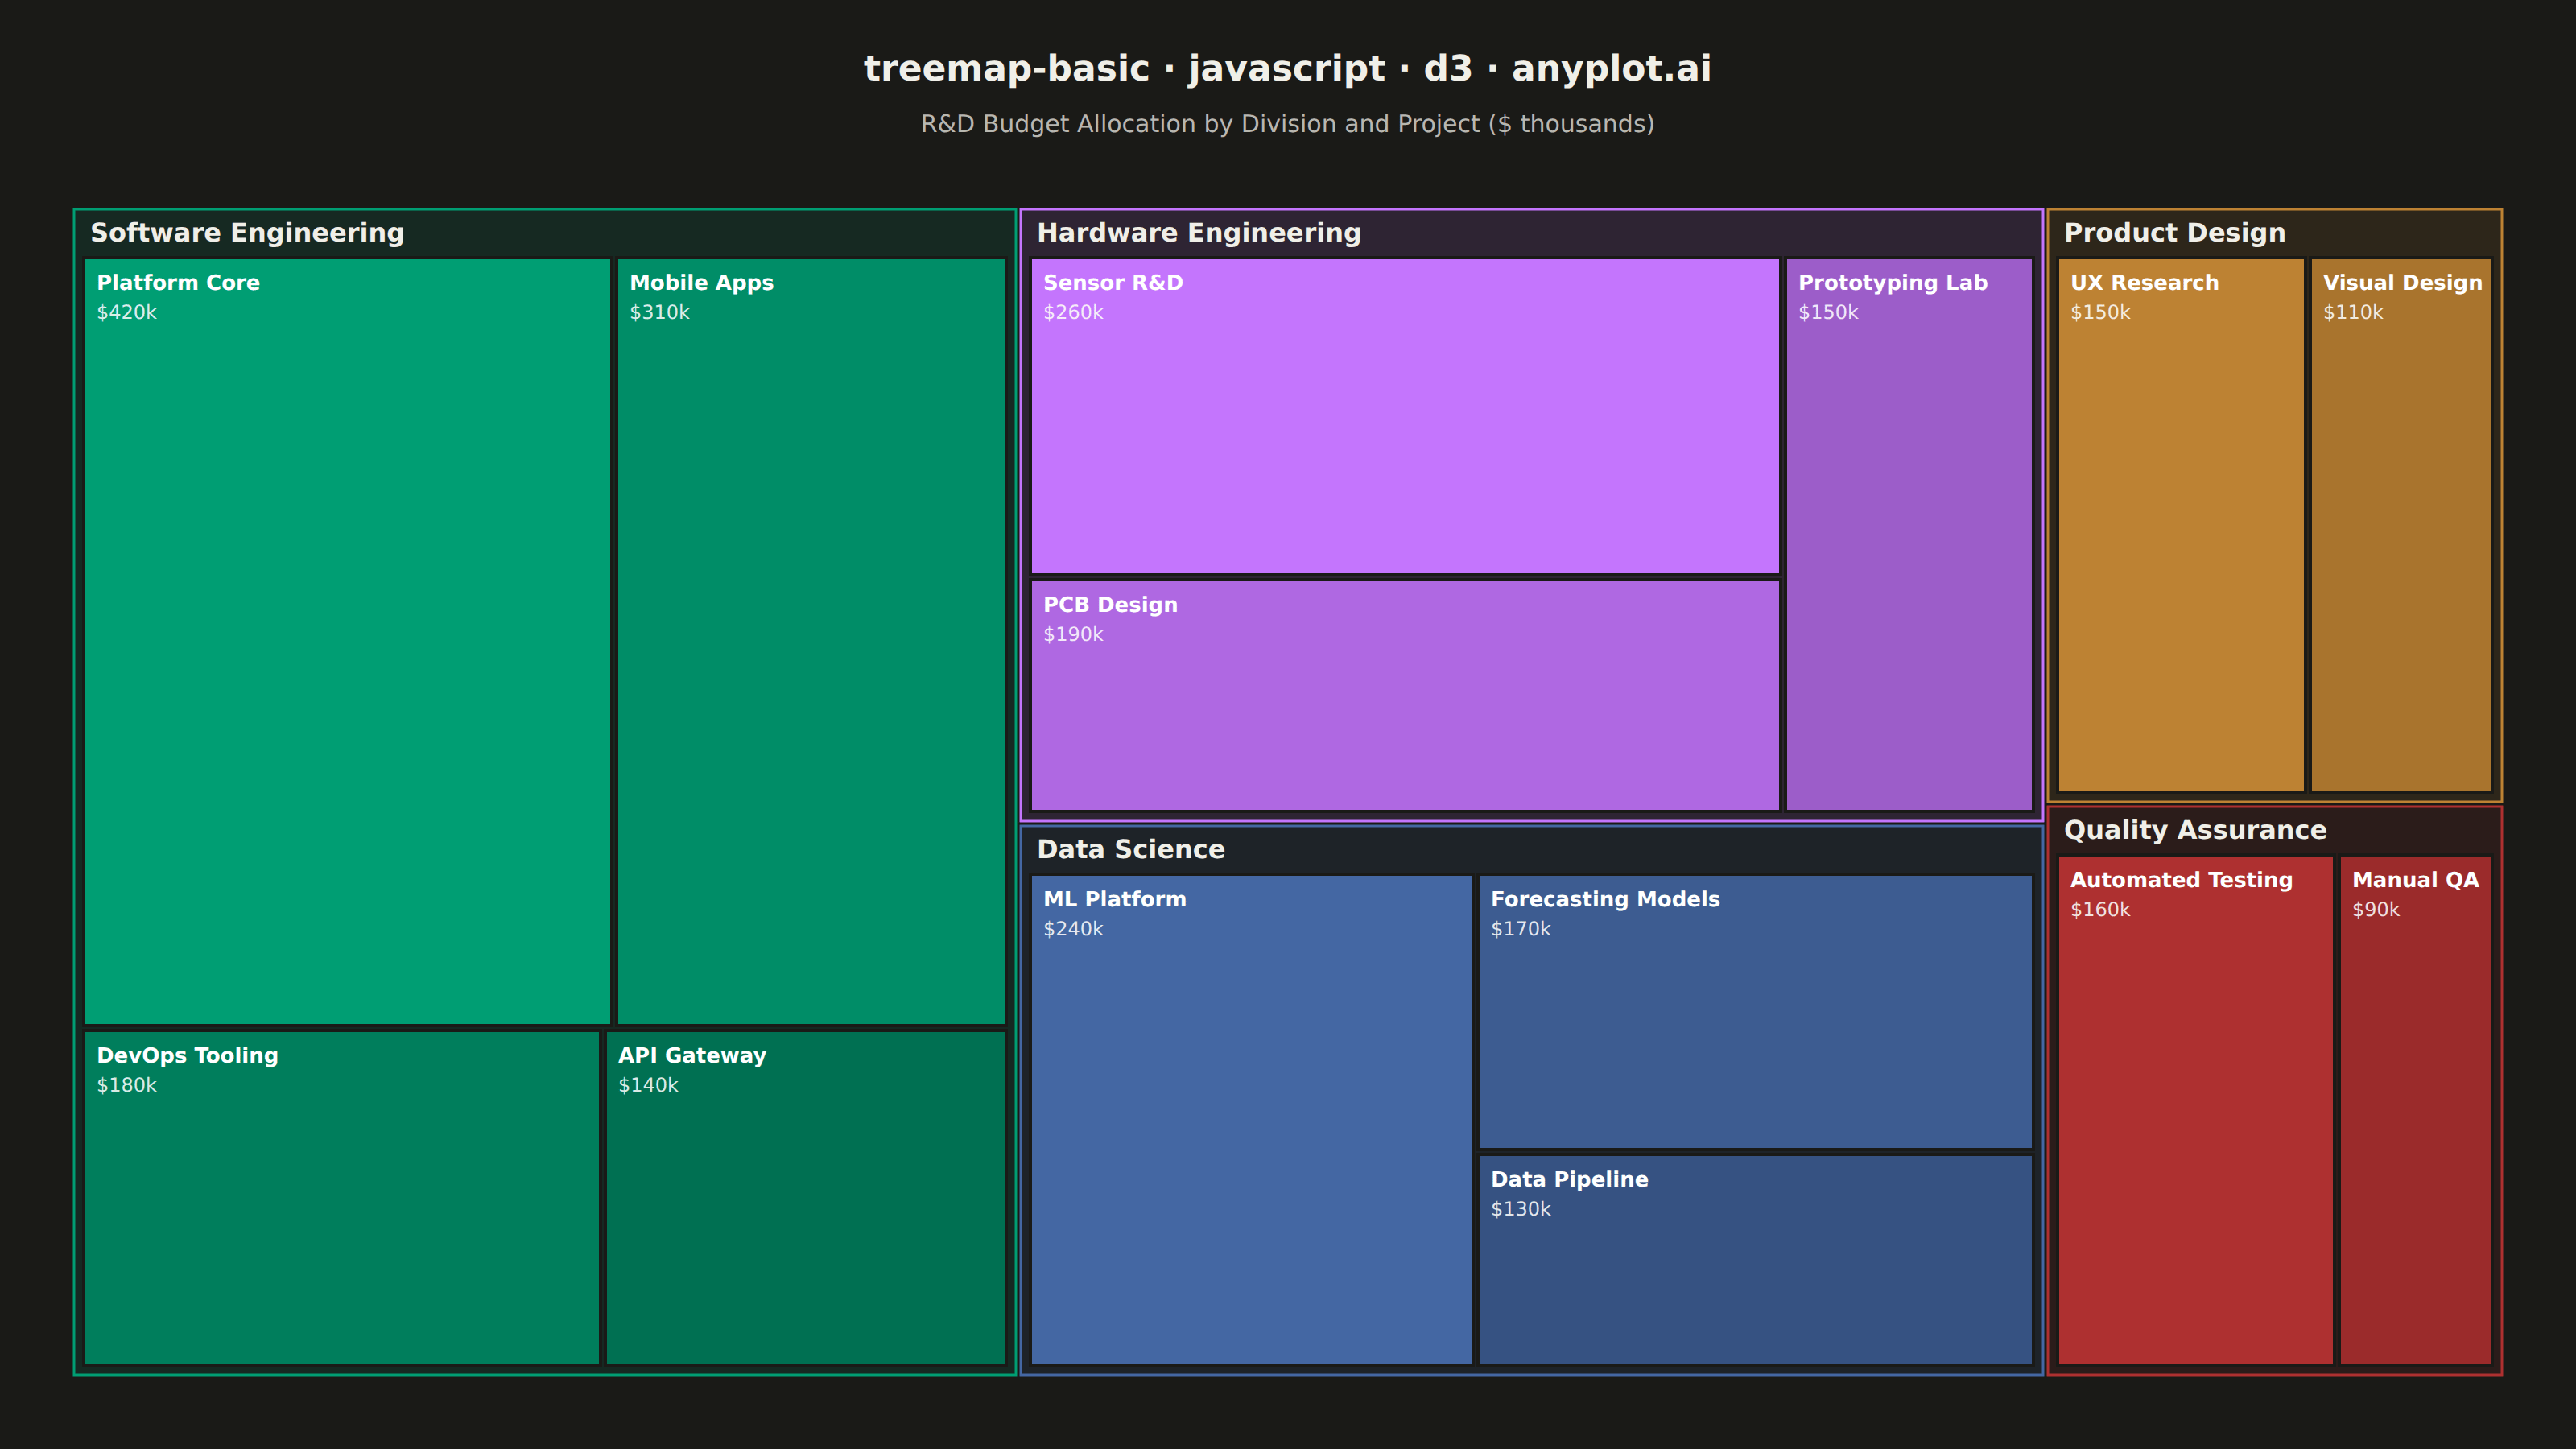
A treemap displaying hierarchical data as nested rectangles, where each rectangle's area is proportional to its value. This visualization excels at showing part-to-whole relationships in hierarchical structures, making it easy to spot large and small items at a glance. Treemaps efficiently use screen space to display large amounts of hierarchical data in a compact form.
// anyplot.ai
// treemap-basic: Basic Treemap
// Library: d3 7.9.0 | JavaScript 22.23.1
// Quality: 92/100 | Created: 2026-08-04

const t = window.ANYPLOT_TOKENS;
const { width, height } = window.ANYPLOT_SIZE;

// --- Data (in-memory, deterministic) ----------------------------------------
// R&D budget allocation ($ thousands) by division and project
const data = {
  name: "root",
  children: [
    {
      name: "Software Engineering",
      children: [
        { name: "Platform Core", value: 420 },
        { name: "Mobile Apps", value: 310 },
        { name: "DevOps Tooling", value: 180 },
        { name: "API Gateway", value: 140 },
      ],
    },
    {
      name: "Hardware Engineering",
      children: [
        { name: "Sensor R&D", value: 260 },
        { name: "PCB Design", value: 190 },
        { name: "Prototyping Lab", value: 150 },
      ],
    },
    {
      name: "Data Science",
      children: [
        { name: "ML Platform", value: 240 },
        { name: "Forecasting Models", value: 170 },
        { name: "Data Pipeline", value: 130 },
      ],
    },
    {
      name: "Product Design",
      children: [
        { name: "UX Research", value: 150 },
        { name: "Visual Design", value: 110 },
      ],
    },
    {
      name: "Quality Assurance",
      children: [
        { name: "Automated Testing", value: 160 },
        { name: "Manual QA", value: 90 },
      ],
    },
  ],
};

const divisions = data.children.map((d) => d.name);
const color = d3.scaleOrdinal().domain(divisions).range(t.palette);

// --- Layout -------------------------------------------------------------------
const margin = { top: 130, right: 40, bottom: 40, left: 40 };
const iw = width - margin.left - margin.right;
const ih = height - margin.top - margin.bottom;

const root = d3
  .hierarchy(data)
  .sum((d) => d.value)
  .sort((a, b) => b.value - a.value);

d3
  .treemap()
  .tile(d3.treemapResquarify)
  .size([iw, ih])
  .paddingOuter(6)
  .paddingTop((d) => (d.depth === 1 ? 30 : 0))
  .paddingInner(3)
  .round(true)(root);

const divisionNodes = root.children;
const projectNodes = root.leaves();

function relativeLuminance(hex) {
  const { r, g, b } = d3.rgb(hex);
  const chan = (v) => {
    const c = v / 255;
    return c <= 0.03928 ? c / 12.92 : Math.pow((c + 0.055) / 1.055, 2.4);
  };
  return 0.2126 * chan(r) + 0.7152 * chan(g) + 0.0722 * chan(b);
}
function labelColorFor(hex) {
  return relativeLuminance(hex) > 0.45 ? "#1A1A17" : "#FFFFFF";
}

// --- SVG mount ------------------------------------------------------------
const svg = d3.select("#container").append("svg").attr("width", width).attr("height", height);
const g = svg.append("g").attr("transform", `translate(${margin.left},${margin.top})`);

// --- Division panels (tinted background + header label) -----------------
const divisionGroup = g.selectAll("g.division").data(divisionNodes).join("g").attr("class", "division");

divisionGroup
  .append("rect")
  .attr("x", (d) => d.x0)
  .attr("y", (d) => d.y0)
  .attr("width", (d) => d.x1 - d.x0)
  .attr("height", (d) => d.y1 - d.y0)
  .attr("fill", (d) => color(d.data.name))
  .attr("fill-opacity", 0.12)
  .attr("stroke", (d) => color(d.data.name))
  .attr("stroke-width", 1.5);

divisionGroup
  .append("text")
  .attr("x", (d) => d.x0 + 10)
  .attr("y", (d) => d.y0 + 20)
  .attr("fill", t.ink)
  .style("font-size", "16px")
  .style("font-weight", "600")
  .style("font-family", "system-ui, sans-serif")
  .text((d) => d.data.name);

// --- Project tiles (leaves), shaded by rank within their division -------
const projectGroup = g.selectAll("g.project").data(projectNodes).join("g").attr("class", "project");

projectGroup.each(function (d) {
  const siblings = d.parent.children;
  const rank = siblings.indexOf(d);
  const baseColor = color(d.parent.data.name);
  const shaded = d3.color(baseColor).darker(rank * 0.32);
  d.fill = shaded.formatHex();
  d.label = labelColorFor(d.fill);
});

projectGroup
  .append("rect")
  .attr("x", (d) => d.x0)
  .attr("y", (d) => d.y0)
  .attr("width", (d) => d.x1 - d.x0)
  .attr("height", (d) => d.y1 - d.y0)
  .attr("fill", (d) => d.fill)
  .attr("stroke", t.pageBg)
  .attr("stroke-width", 2);

const labelableProjects = projectGroup.filter((d) => d.x1 - d.x0 > 90 && d.y1 - d.y0 > 34);

labelableProjects
  .append("text")
  .attr("x", (d) => d.x0 + 8)
  .attr("y", (d) => d.y0 + 20)
  .attr("fill", (d) => d.label)
  .style("font-size", "13px")
  .style("font-weight", "600")
  .style("font-family", "system-ui, sans-serif")
  .text((d) => d.data.name);

labelableProjects
  .filter((d) => d.y1 - d.y0 > 52)
  .append("text")
  .attr("x", (d) => d.x0 + 8)
  .attr("y", (d) => d.y0 + 38)
  .attr("fill", (d) => d.label)
  .attr("opacity", 0.85)
  .style("font-size", "12px")
  .style("font-family", "system-ui, sans-serif")
  .text((d) => `$${d.data.value}k`);

// --- Title --------------------------------------------------------------
svg
  .append("text")
  .attr("x", width / 2)
  .attr("y", 50)
  .attr("text-anchor", "middle")
  .attr("fill", t.ink)
  .style("font-size", "22px")
  .style("font-weight", "600")
  .style("font-family", "system-ui, sans-serif")
  .text("treemap-basic · javascript · d3 · anyplot.ai");

svg
  .append("text")
  .attr("x", width / 2)
  .attr("y", 82)
  .attr("text-anchor", "middle")
  .attr("fill", t.inkSoft)
  .style("font-size", "15px")
  .style("font-family", "system-ui, sans-serif")
  .text("R&D Budget Allocation by Division and Project ($ thousands)");
Runnable source as JSON, for any HTTP client: https://api.anyplot.ai/specs/treemap-basic/d3/code. Any spec id and library id listed in llms-full.txt fit the same URL shape; every URL below is complete and callable.
{
  "spec_id": "treemap-basic",
  "language": "javascript",
  "library": "d3",
  "page": "https://anyplot.ai/treemap-basic/javascript/d3",
  "hub": "https://anyplot.ai/treemap-basic",
  "code_json": "https://api.anyplot.ai/specs/treemap-basic/d3/code",
  "spec_json": "https://api.anyplot.ai/specs/treemap-basic",
  "render_light_png": "https://storage.googleapis.com/anyplot-images/plots/treemap-basic/javascript/d3/plot-light.png",
  "render_dark_png": "https://storage.googleapis.com/anyplot-images/plots/treemap-basic/javascript/d3/plot-dark.png",
  "interactive_light_html": "https://storage.googleapis.com/anyplot-images/plots/treemap-basic/javascript/d3/plot-light.html",
  "interactive_dark_html": "https://storage.googleapis.com/anyplot-images/plots/treemap-basic/javascript/d3/plot-dark.html",
  "quality_score": 92.0,
  "license": "MIT",
  "guide": "https://anyplot.ai/llms.txt"
}
Part of Basic Treemap on anyplot.ai.