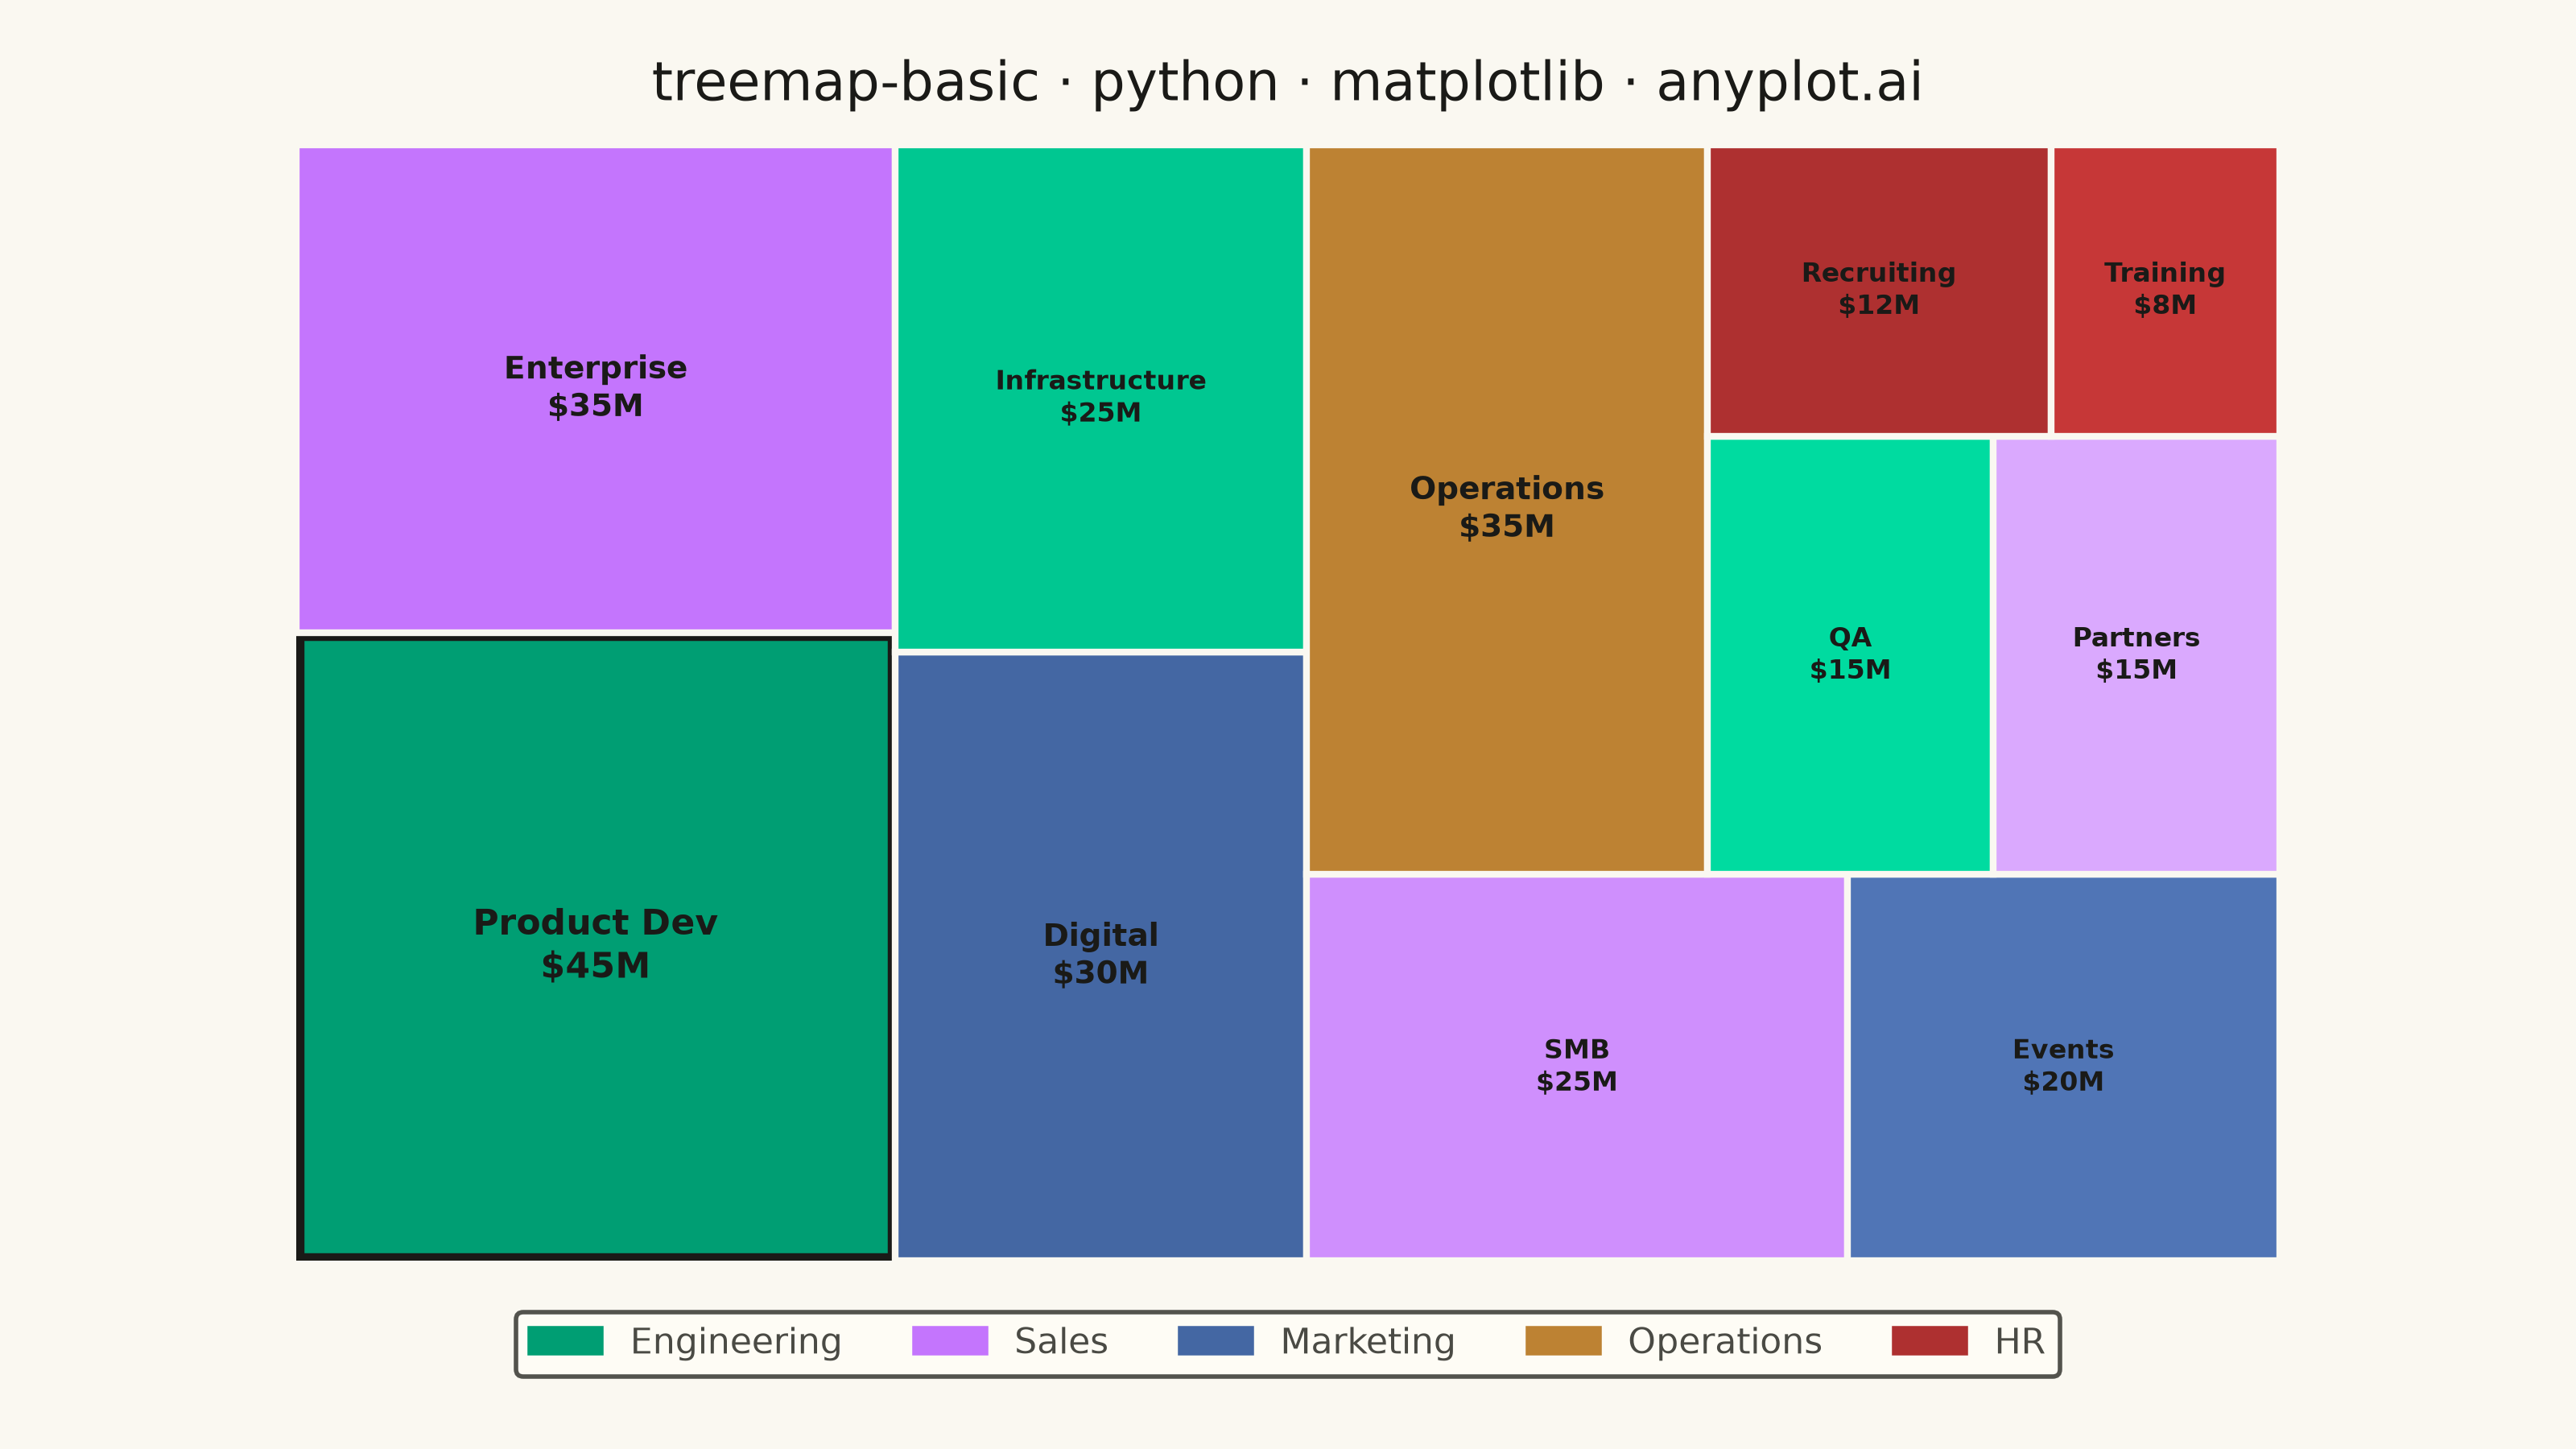
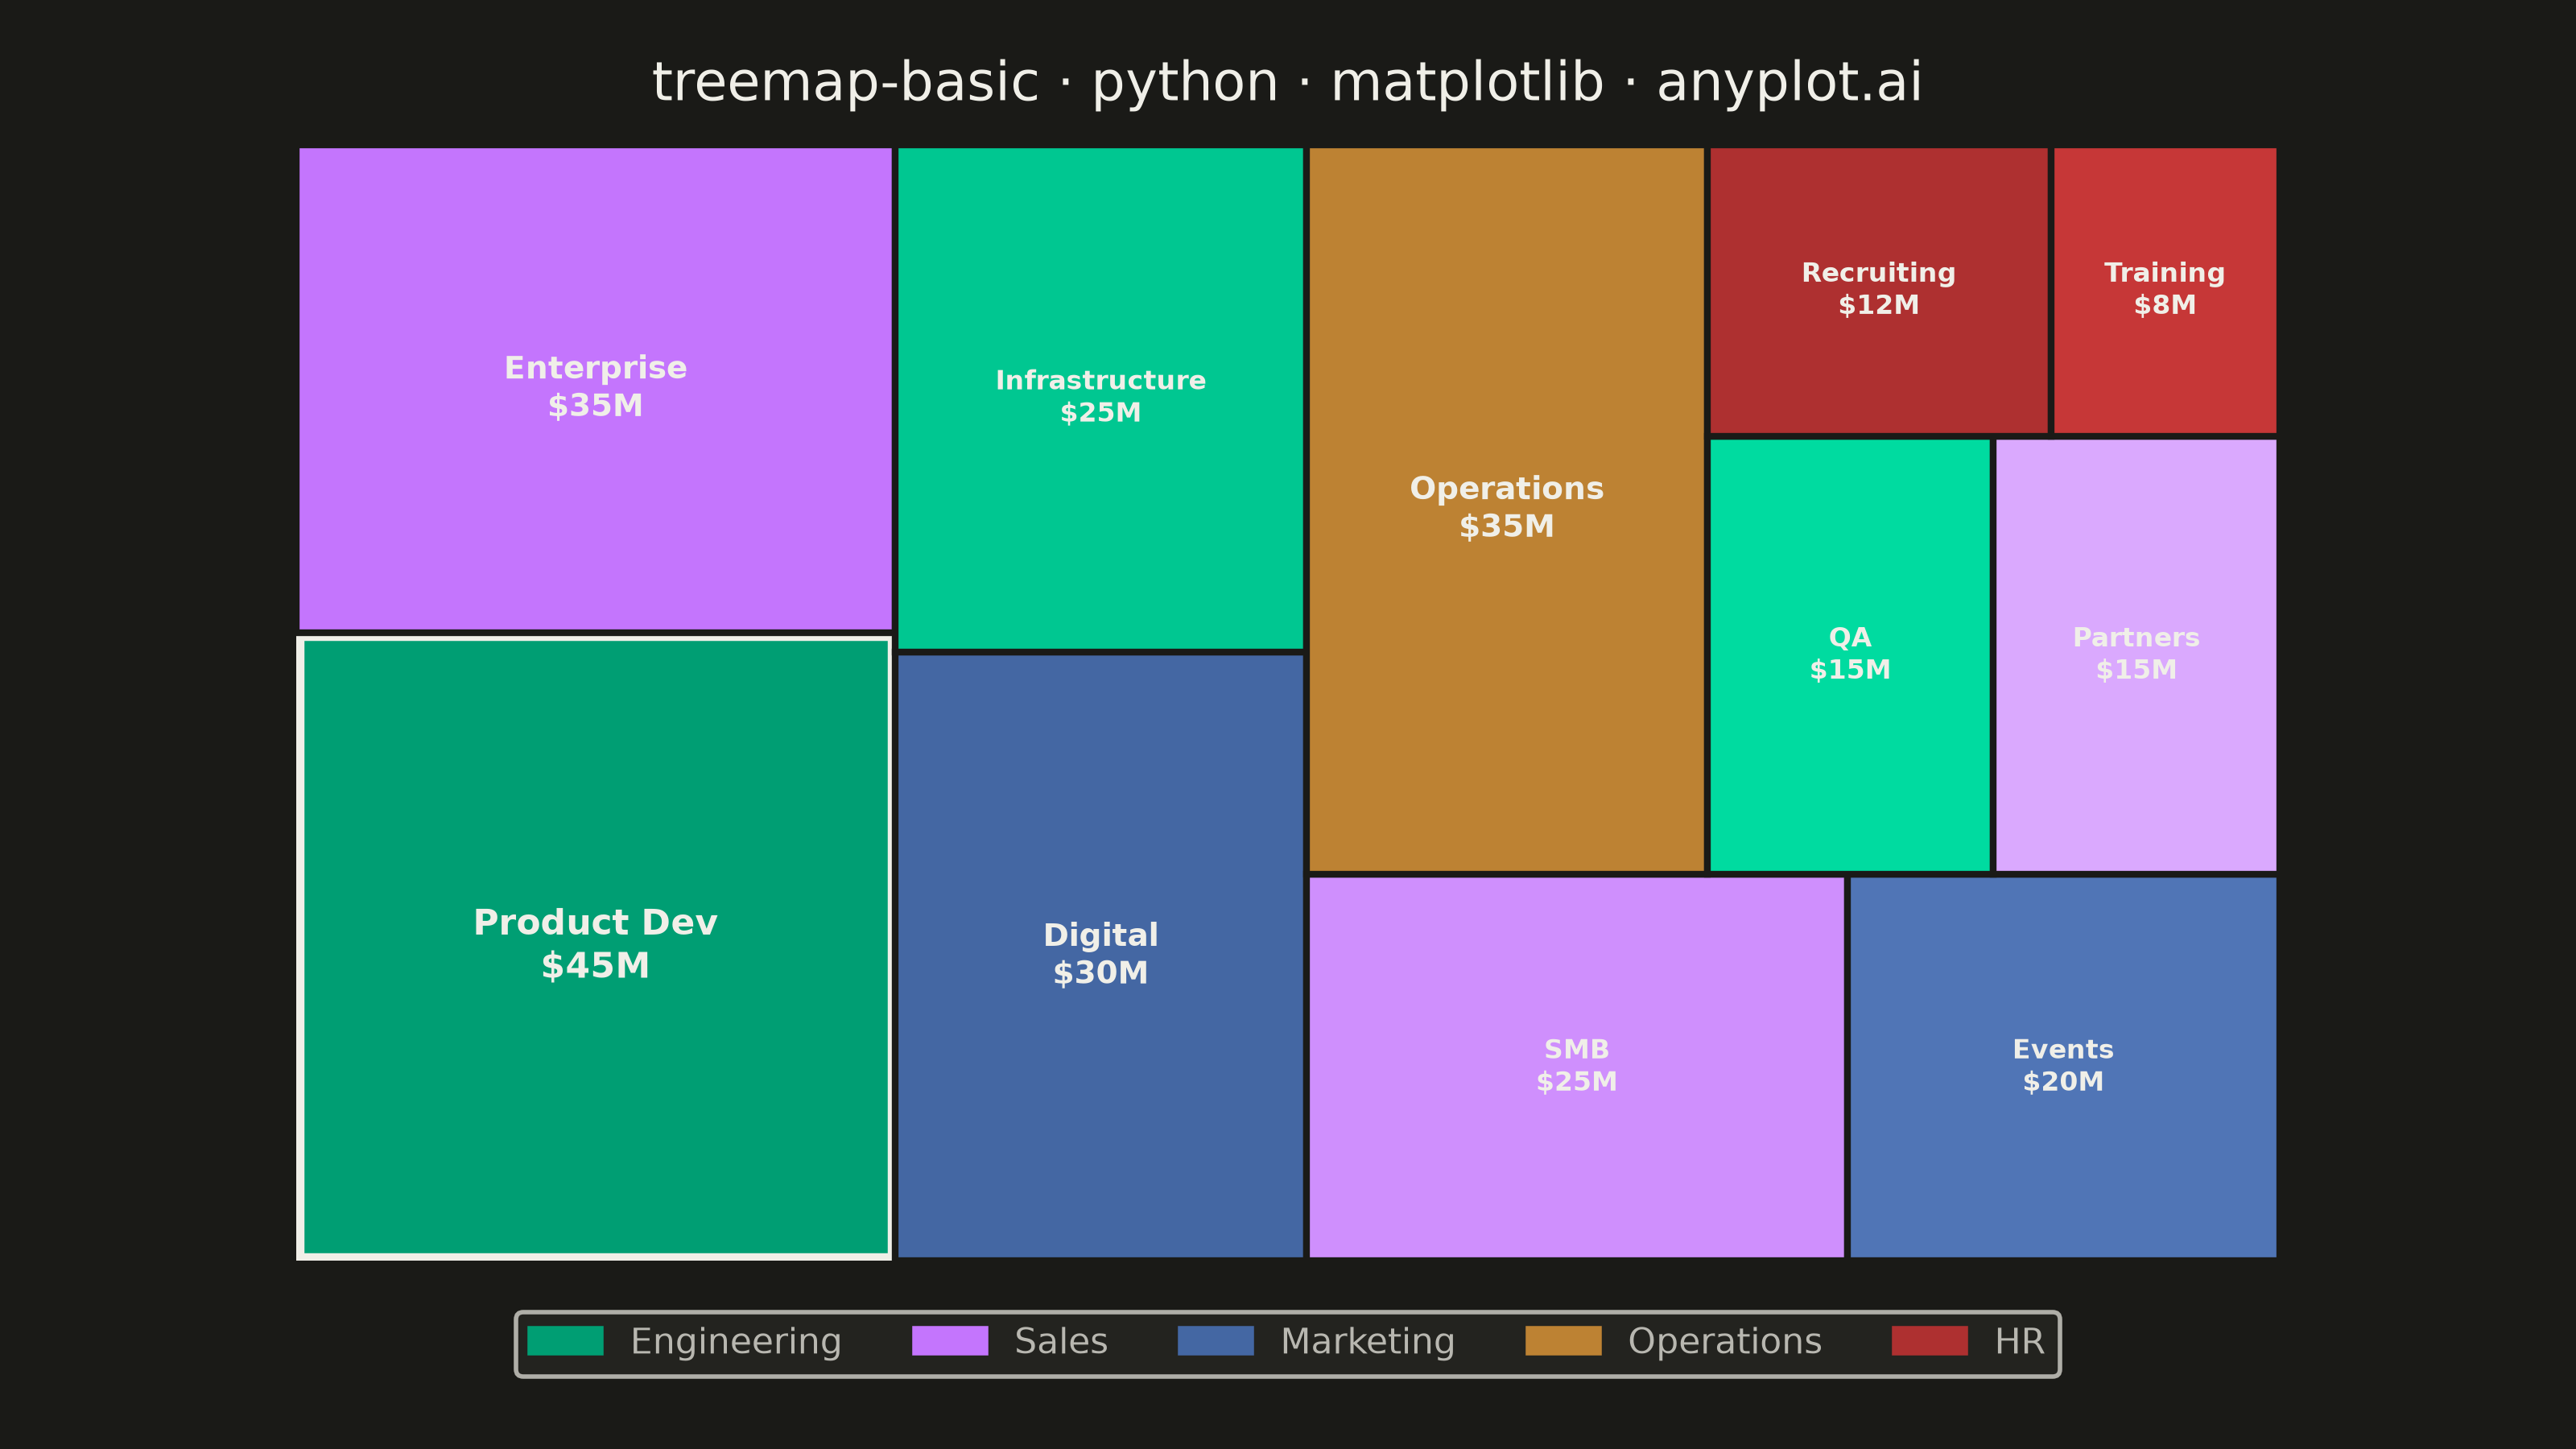
A treemap displaying hierarchical data as nested rectangles, where each rectangle's area is proportional to its value. This visualization excels at showing part-to-whole relationships in hierarchical structures, making it easy to spot large and small items at a glance. Treemaps efficiently use screen space to display large amounts of hierarchical data in a compact form.
""" anyplot.ai
treemap-basic: Basic Treemap
Library: matplotlib 3.11.1 | Python 3.13.14
Quality: 91/100 | Updated: 2026-08-04
"""

import colorsys
import os

import matplotlib.patches as mpatches
import matplotlib.pyplot as plt
from matplotlib.colors import to_hex, to_rgb
from matplotlib.patches import Rectangle


# Theme tokens
THEME = os.getenv("ANYPLOT_THEME", "light")
PAGE_BG = "#FAF8F1" if THEME == "light" else "#1A1A17"
ELEVATED_BG = "#FFFDF6" if THEME == "light" else "#242420"
INK = "#1A1A17" if THEME == "light" else "#F0EFE8"
INK_SOFT = "#4A4A44" if THEME == "light" else "#B8B7B0"

# Imprint palette for categories
IMPRINT = ["#009E73", "#C475FD", "#4467A3", "#BD8233", "#AE3030"]

# Data - Budget allocation by department and project. Operations has no
# subcategory split (renders as one unsubdivided rectangle) to demonstrate
# that the hierarchy nesting is optional, per the spec.
data = [
    ("Engineering", "Product Dev", 45),
    ("Sales", "Enterprise", 35),
    ("Marketing", "Digital", 30),
    ("Engineering", "Infrastructure", 25),
    ("Sales", "SMB", 25),
    ("Marketing", "Events", 20),
    ("Operations", None, 35),
    ("Engineering", "QA", 15),
    ("Sales", "Partners", 15),
    ("HR", "Recruiting", 12),
    ("HR", "Training", 8),
]

# Extract sorted data
categories = [d[0] for d in data]
subcategories = [d[1] for d in data]
values = [d[2] for d in data]

# Category to color mapping (canonical Imprint order)
unique_categories = ["Engineering", "Sales", "Marketing", "Operations", "HR"]
category_colors = {cat: IMPRINT[i % len(IMPRINT)] for i, cat in enumerate(unique_categories)}
category_max = {cat: max(v for c, _, v in data if c == cat) for cat in unique_categories}

# Normalize values to fill a 160x90 area (matching figsize aspect ratio)
total = sum(values)
width, height = 160, 90
normalized = [v / total * width * height for v in values]

# Squarify algorithm - compute rectangle positions
rects = []
remaining = list(zip(normalized, range(len(normalized)), strict=True))
x, y, w, h = 0, 0, width, height

while remaining:
    vertical = w >= h
    fixed = h if vertical else w  # dimension held constant while the strip fills

    # Add items to the current strip one at a time, backing off as soon as
    # the strip's worst aspect ratio would get worse. Shared by both the
    # vertical-strip and horizontal-strip cases below, which differ only in
    # which dimension (h or w) is held fixed.
    strip_items = []
    strip_area = 0
    for area, idx in remaining:
        strip_items.append((area, idx))
        strip_area += area
        thickness = strip_area / fixed
        if len(strip_items) > 1:
            aspects = [max(thickness / (a / thickness), (a / thickness) / thickness) for a, _ in strip_items]
            prev_area = strip_area - area
            prev_aspects = []
            if prev_area > 0:
                prev_thickness = prev_area / fixed
                prev_aspects = [
                    max(prev_thickness / (a / prev_thickness), (a / prev_thickness) / prev_thickness)
                    for a, _ in strip_items[:-1]
                ]
            if prev_aspects and max(aspects) > max(prev_aspects):
                strip_items.pop()
                strip_area -= area
                break

    # Lay out the finished strip along its fixed dimension
    thickness = strip_area / fixed if fixed > 0 else 0
    pos = y if vertical else x
    for area, idx in strip_items:
        length = area / thickness if thickness > 0 else 0
        if vertical:
            rects.append((x, pos, thickness, length, idx))
        else:
            rects.append((pos, y, length, thickness, idx))
        pos += length
    if vertical:
        x += thickness
        w -= thickness
    else:
        y += thickness
        h -= thickness

    # Remove placed items
    placed_indices = {idx for _, idx in strip_items}
    remaining = [(a, i) for a, i in remaining if i not in placed_indices]

# Create plot (3200x1800 px)
fig, ax = plt.subplots(figsize=(8, 4.5), dpi=400, facecolor=PAGE_BG)
ax.set_facecolor(PAGE_BG)

# Draw rectangles with labels. Fill lightness is value-driven within each
# category (largest item keeps the full-strength hue, smaller ones lighten
# toward a soft tint) so area and shade reinforce the same magnitude signal.
# The single largest rectangle overall gets a bold ink outline as a focal-point
# callout, sharpening the visual hierarchy beyond area and shading alone.
focal_idx = values.index(max(values))
for rx, ry, rw, rh, idx in rects:
    cat = categories[idx]
    base_r, base_g, base_b = to_rgb(category_colors[cat])
    hue, lightness, sat = colorsys.rgb_to_hls(base_r, base_g, base_b)
    weight = values[idx] / category_max[cat]
    tint = to_hex(colorsys.hls_to_rgb(hue, min(0.92, lightness + (1 - weight) * 0.18), sat))

    is_focal = idx == focal_idx
    edge_color = INK if is_focal else PAGE_BG
    edge_width = 3.5 if is_focal else 1.5
    rect = Rectangle((rx, ry), rw, rh, facecolor=tint, edgecolor=edge_color, linewidth=edge_width)
    ax.add_patch(rect)

    # Add labels for all visible rectangles
    area = rw * rh
    if area > 80:
        fontsize = min(9, max(6, round(area**0.35 * 0.5)))

        label = f"{subcategories[idx] or cat}\n${values[idx]}M"
        ax.text(
            rx + rw / 2, ry + rh / 2, label, ha="center", va="center", fontsize=fontsize, fontweight="bold", color=INK
        )

# Set axis limits and remove axes
ax.set_xlim(0, width)
ax.set_ylim(0, height)
ax.axis("off")
ax.set_aspect("equal")

# Title
ax.set_title("treemap-basic · python · matplotlib · anyplot.ai", fontsize=12, fontweight="medium", color=INK, pad=10)

# Legend for categories (canonical Imprint hue, unshaded, for brand fidelity)
legend_handles = [mpatches.Patch(color=category_colors[cat], label=cat) for cat in unique_categories]
leg = ax.legend(
    handles=legend_handles,
    loc="upper center",
    fontsize=8,
    framealpha=0.95,
    edgecolor=INK_SOFT,
    ncol=5,
    bbox_to_anchor=(0.5, -0.03),
)
leg.get_frame().set_facecolor(ELEVATED_BG)
leg.get_frame().set_edgecolor(INK_SOFT)
for text in leg.get_texts():
    text.set_color(INK_SOFT)

fig.subplots_adjust(left=0.02, right=0.98, top=0.90, bottom=0.13)
plt.savefig(f"plot-{THEME}.png", dpi=400, facecolor=PAGE_BG)
Runnable source as JSON, for any HTTP client: https://api.anyplot.ai/specs/treemap-basic/matplotlib/code. Any spec id and library id listed in llms-full.txt fit the same URL shape; every URL below is complete and callable.
{
  "spec_id": "treemap-basic",
  "language": "python",
  "library": "matplotlib",
  "page": "https://anyplot.ai/treemap-basic/python/matplotlib",
  "hub": "https://anyplot.ai/treemap-basic",
  "code_json": "https://api.anyplot.ai/specs/treemap-basic/matplotlib/code",
  "spec_json": "https://api.anyplot.ai/specs/treemap-basic",
  "render_light_png": "https://storage.googleapis.com/anyplot-images/plots/treemap-basic/python/matplotlib/plot-light.png",
  "render_dark_png": "https://storage.googleapis.com/anyplot-images/plots/treemap-basic/python/matplotlib/plot-dark.png",
  "quality_score": 91.0,
  "license": "MIT",
  "guide": "https://anyplot.ai/llms.txt"
}
Part of Basic Treemap on anyplot.ai.