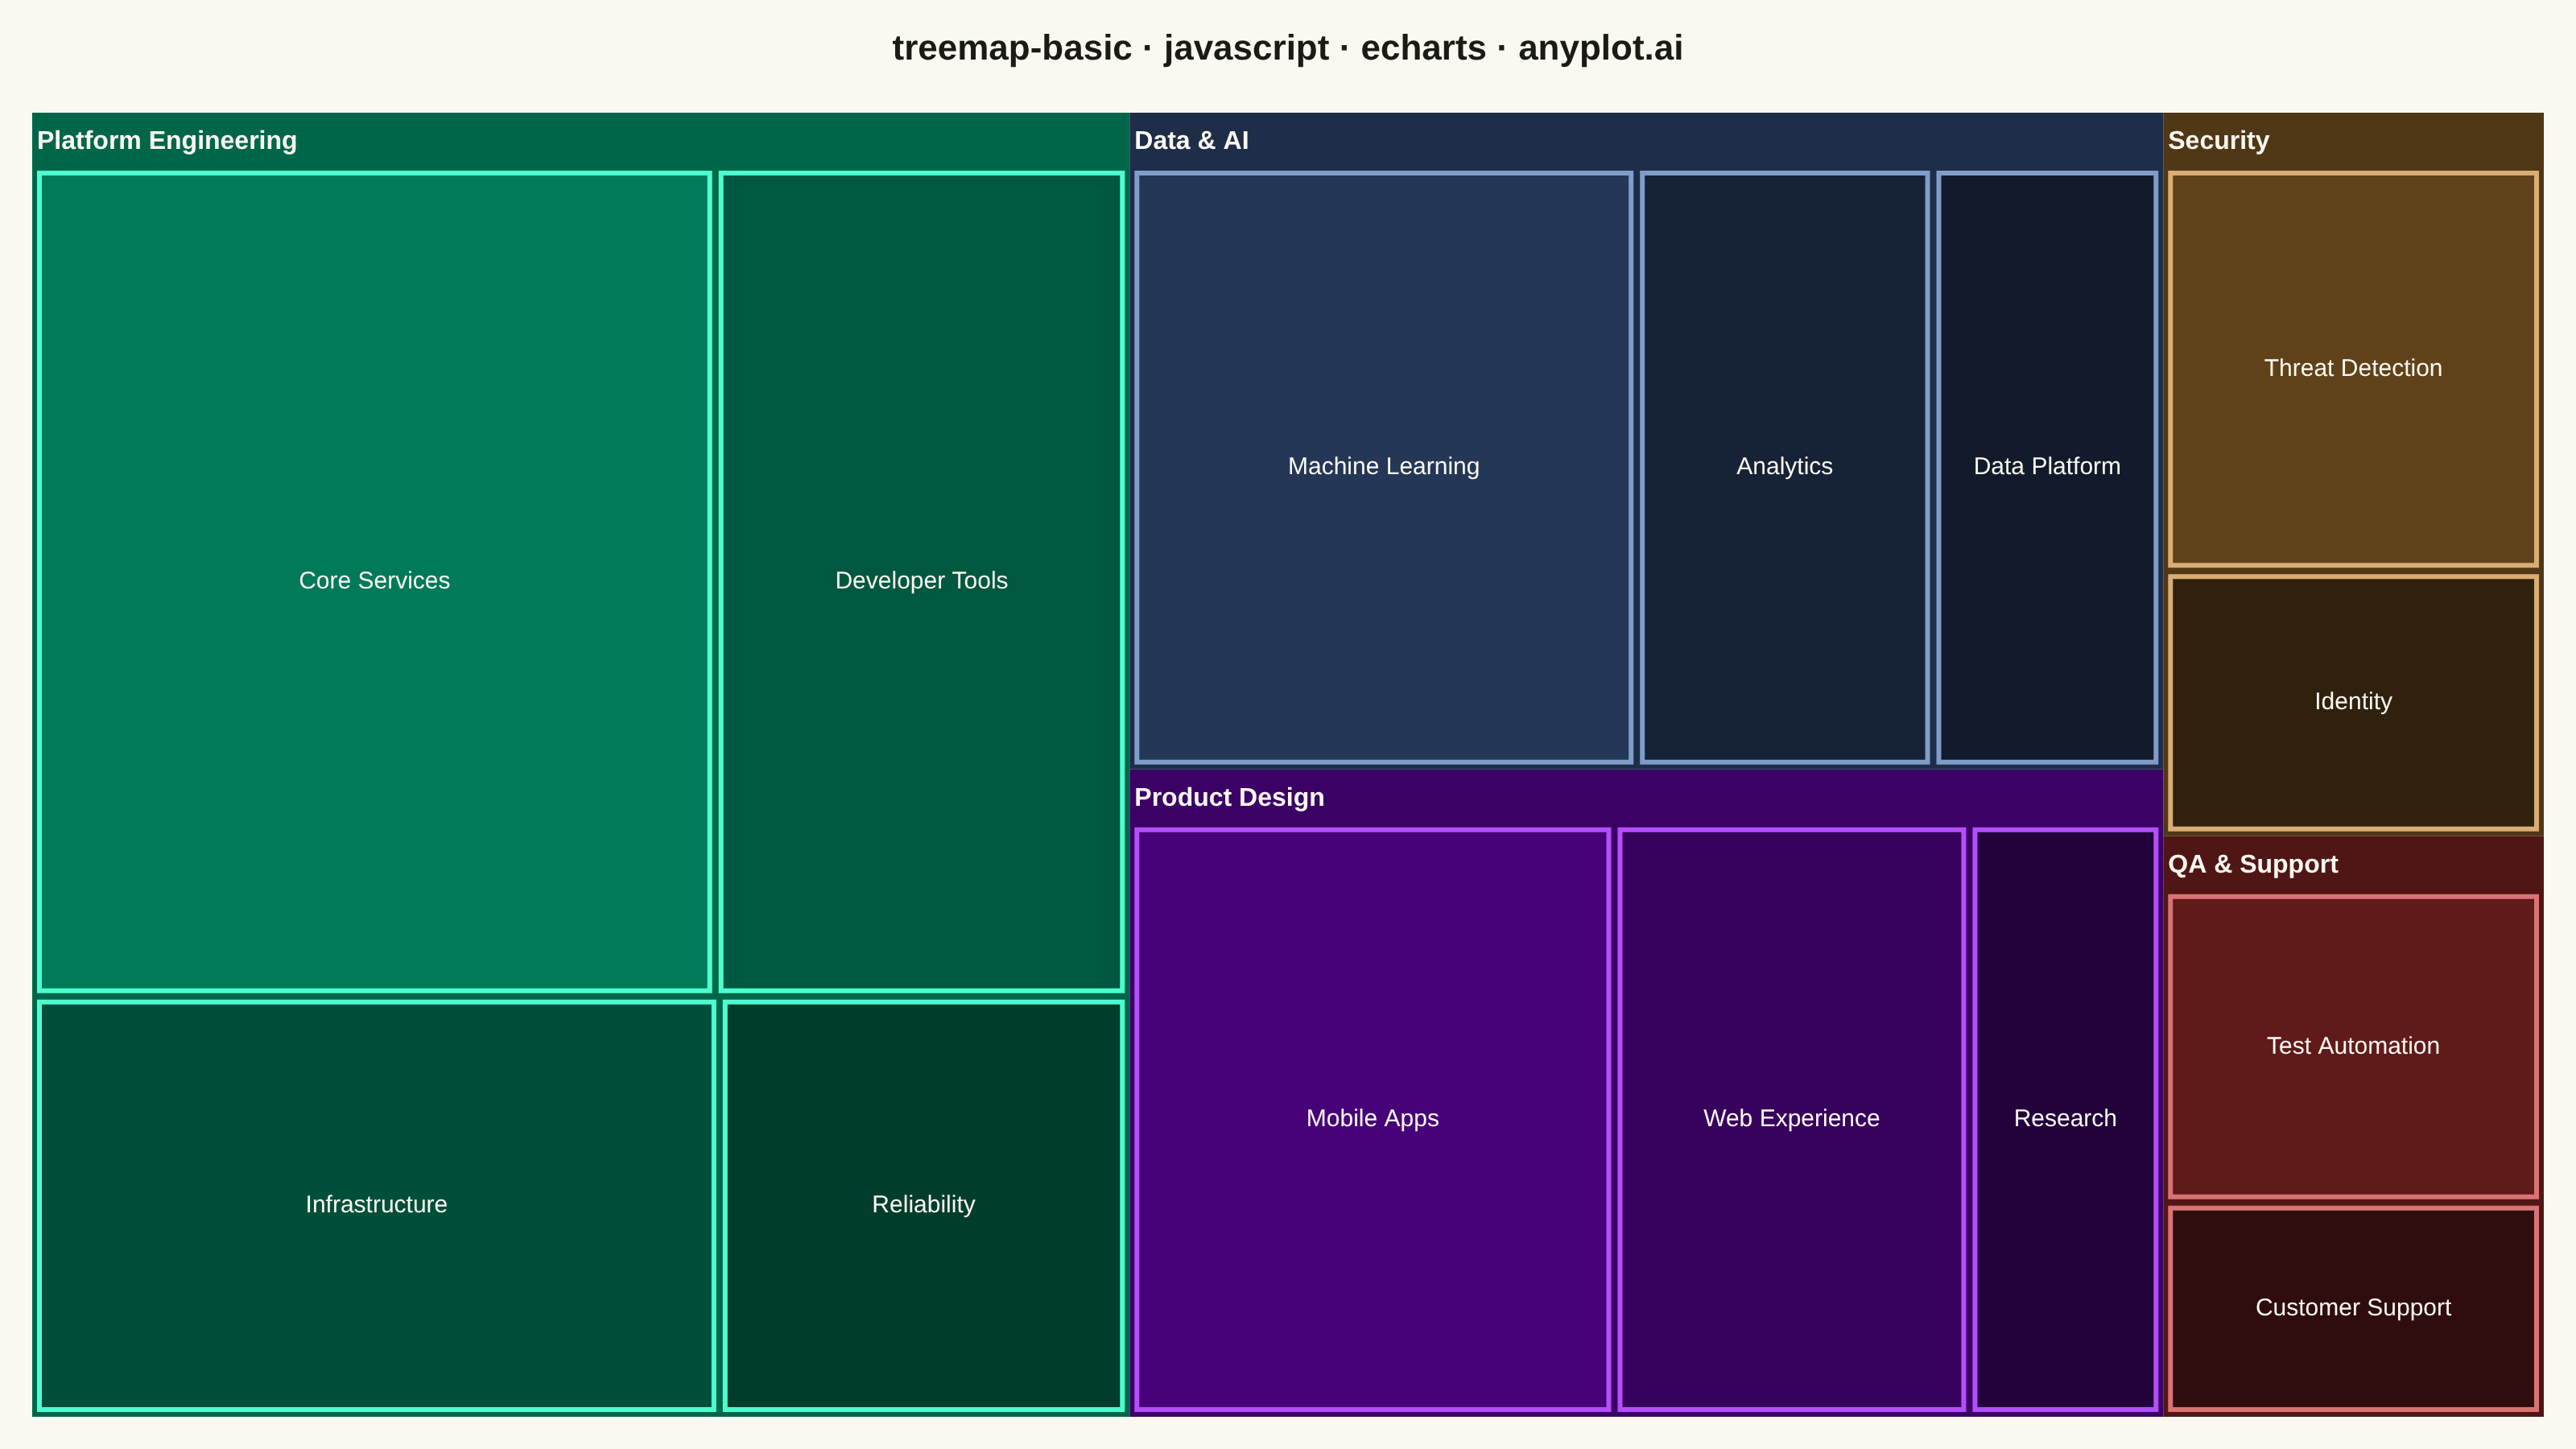
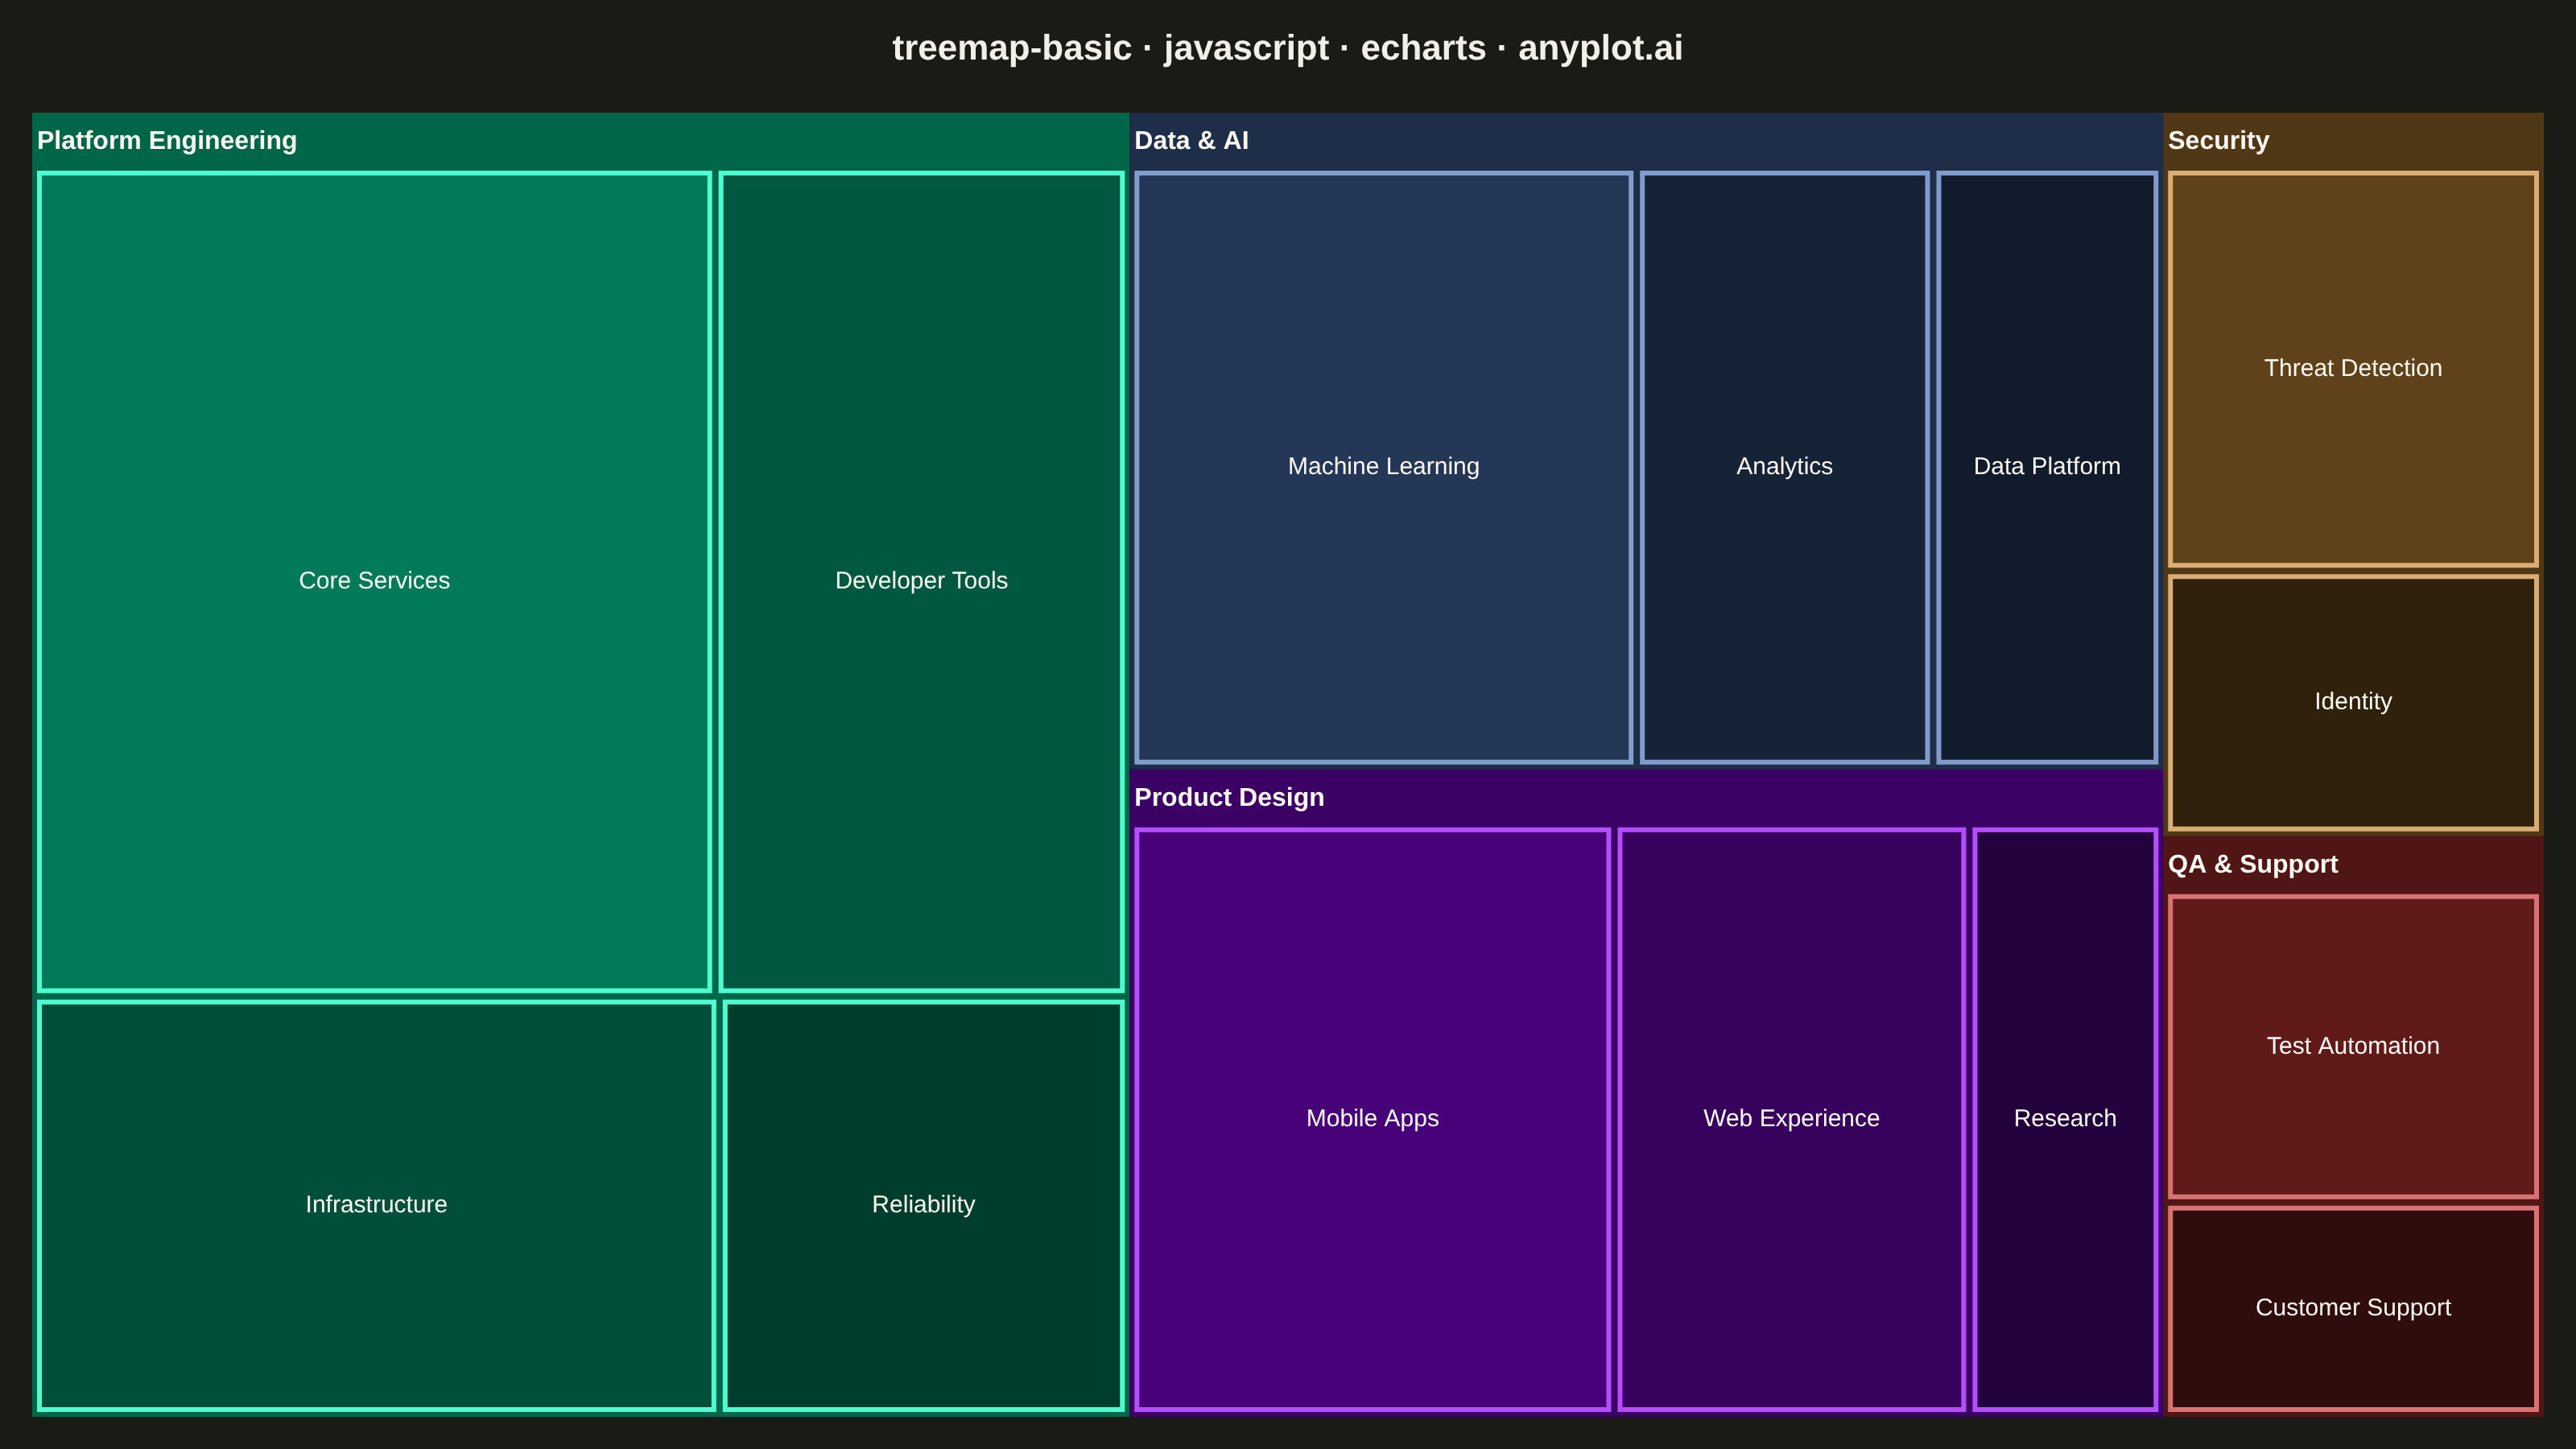
A treemap displaying hierarchical data as nested rectangles, where each rectangle's area is proportional to its value. This visualization excels at showing part-to-whole relationships in hierarchical structures, making it easy to spot large and small items at a glance. Treemaps efficiently use screen space to display large amounts of hierarchical data in a compact form.
// anyplot.ai
// treemap-basic: Basic Treemap
// Library: echarts 6.1.0 | JavaScript 22.23.1
// Quality: 94/100 | Created: 2026-08-04

const t = window.ANYPLOT_TOKENS;
// Text drawn on the data-colored tiles themselves (not the page background)
// stays a fixed light cream in both themes, since tile fill colors are
// identical between light/dark — only the page chrome around them flips.
const TILE_LABEL = "#FAF8F1";

// --- Data (in-memory, deterministic) ----------------------------------------
// Annual R&D budget ($ thousands) by division and project
const divisions = [
  {
    name: "Platform Engineering",
    children: [
      { name: "Core Services", value: 1850 },
      { name: "Developer Tools", value: 1120 },
      { name: "Infrastructure", value: 940 },
      { name: "Reliability", value: 560 },
    ],
  },
  {
    name: "Product Design",
    children: [
      { name: "Mobile Apps", value: 980 },
      { name: "Web Experience", value: 720 },
      { name: "Research", value: 390 },
    ],
  },
  {
    name: "Data & AI",
    children: [
      { name: "Machine Learning", value: 1040 },
      { name: "Analytics", value: 610 },
      { name: "Data Platform", value: 470 },
    ],
  },
  {
    name: "Security",
    children: [
      { name: "Threat Detection", value: 520 },
      { name: "Identity", value: 340 },
    ],
  },
  {
    name: "QA & Support",
    children: [
      { name: "Test Automation", value: 410 },
      { name: "Customer Support", value: 280 },
    ],
  },
];

// --- Init --------------------------------------------------------------------
const chart = echarts.init(document.getElementById("container"));

// --- Option --------------------------------------------------------------------
chart.setOption({
  animation: false,
  color: t.palette,
  backgroundColor: "transparent",
  title: {
    text: "treemap-basic · javascript · echarts · anyplot.ai",
    left: "center",
    textStyle: { color: t.ink, fontSize: 22 },
  },
  tooltip: { show: false },
  series: [
    {
      type: "treemap",
      top: 70,
      bottom: 20,
      left: 20,
      right: 20,
      roam: false,
      nodeClick: false,
      breadcrumb: { show: false },
      // Explicit per-division color (indexed by the division's position in
      // this array, not by ECharts' default value-descending sort) so the
      // canonical Imprint palette order is guaranteed regardless of data.
      data: divisions.map((d, i) => ({
        ...d,
        itemStyle: { color: t.palette[i] },
      })),
      itemStyle: {
        borderColor: t.pageBg,
        borderWidth: 3,
        gapWidth: 3,
      },
      levels: [
        {
          // depth 0 — invisible root container, no header of its own
          upperLabel: { show: false },
          itemStyle: { borderWidth: 0, gapWidth: 0 },
        },
        {
          // depth 1 — divisions: colored per Imprint palette above.
          // colorSaturation here sets the *lightness* range ECharts uses to
          // shade this division's own children (depth-2 project tiles) by
          // relative value — capped low enough that even the largest child
          // in a division stays dark enough for the fixed cream label to
          // clear 4.5:1 contrast. borderColorSaturation darkens the
          // division's own hue for the header strip, keeping it distinct
          // from both the page background and the project tiles nested
          // inside it.
          colorSaturation: [0.12, 0.24],
          itemStyle: { borderColorSaturation: 0.2, gapWidth: 4 },
          upperLabel: {
            show: true,
            height: 36,
            color: TILE_LABEL,
            fontSize: 16,
            fontWeight: 600,
          },
        },
        {
          // depth 2 — projects, shaded from the parent division color
          itemStyle: { borderColorSaturation: 0.65, gapWidth: 2 },
          label: {
            show: true,
            color: TILE_LABEL,
            fontSize: 15,
            fontWeight: 500,
            overflow: "truncate",
          },
        },
      ],
    },
  ],
});
Runnable source as JSON, for any HTTP client: https://api.anyplot.ai/specs/treemap-basic/echarts/code. Any spec id and library id listed in llms-full.txt fit the same URL shape; every URL below is complete and callable.
{
  "spec_id": "treemap-basic",
  "language": "javascript",
  "library": "echarts",
  "page": "https://anyplot.ai/treemap-basic/javascript/echarts",
  "hub": "https://anyplot.ai/treemap-basic",
  "code_json": "https://api.anyplot.ai/specs/treemap-basic/echarts/code",
  "spec_json": "https://api.anyplot.ai/specs/treemap-basic",
  "render_light_png": "https://storage.googleapis.com/anyplot-images/plots/treemap-basic/javascript/echarts/plot-light.png",
  "render_dark_png": "https://storage.googleapis.com/anyplot-images/plots/treemap-basic/javascript/echarts/plot-dark.png",
  "interactive_light_html": "https://storage.googleapis.com/anyplot-images/plots/treemap-basic/javascript/echarts/plot-light.html",
  "interactive_dark_html": "https://storage.googleapis.com/anyplot-images/plots/treemap-basic/javascript/echarts/plot-dark.html",
  "quality_score": 94.0,
  "license": "MIT",
  "guide": "https://anyplot.ai/llms.txt"
}
Part of Basic Treemap on anyplot.ai.