The same plot in 13 other libraries — JavaScript: D3.js, Apache ECharts, MUI X Charts; Python: Altair, Bokeh, lets-plot, Matplotlib, Plotly, plotnine, Pygal, Seaborn; R: ggplot2; Julia: Makie.jl. Compare all 14 side by side: Basic Treemap in Python, R, Julia and JavaScript.
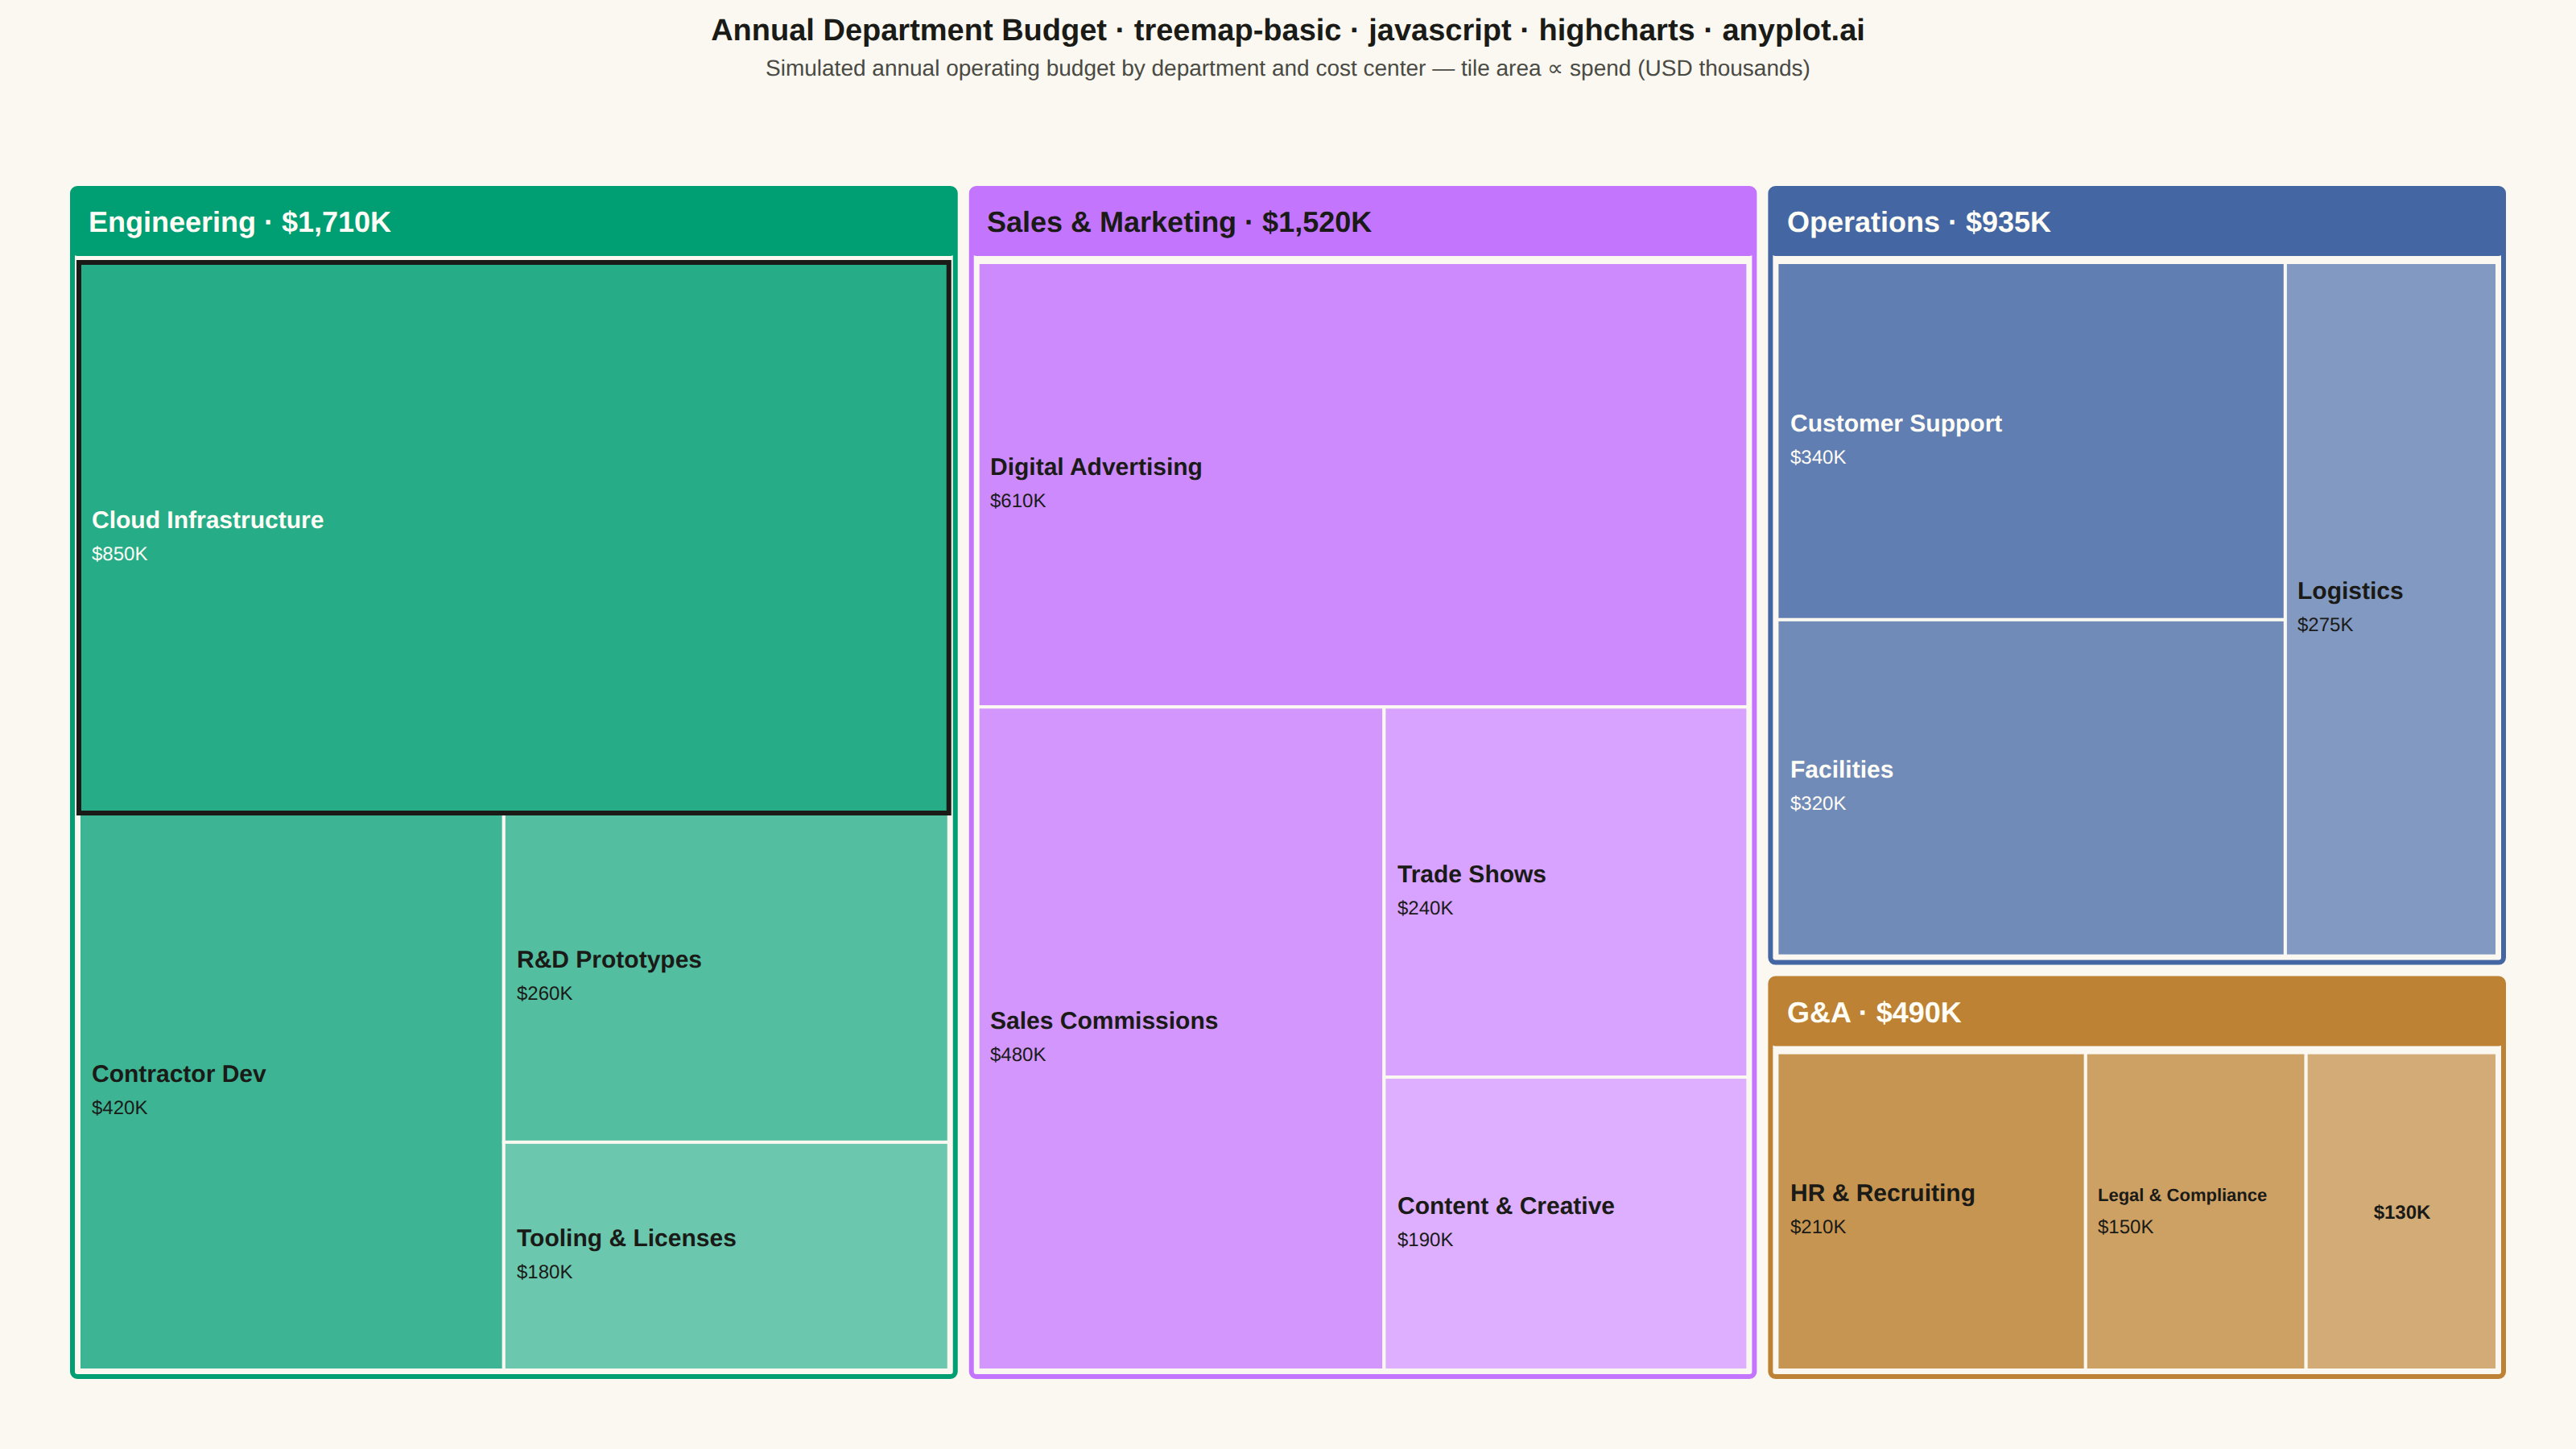
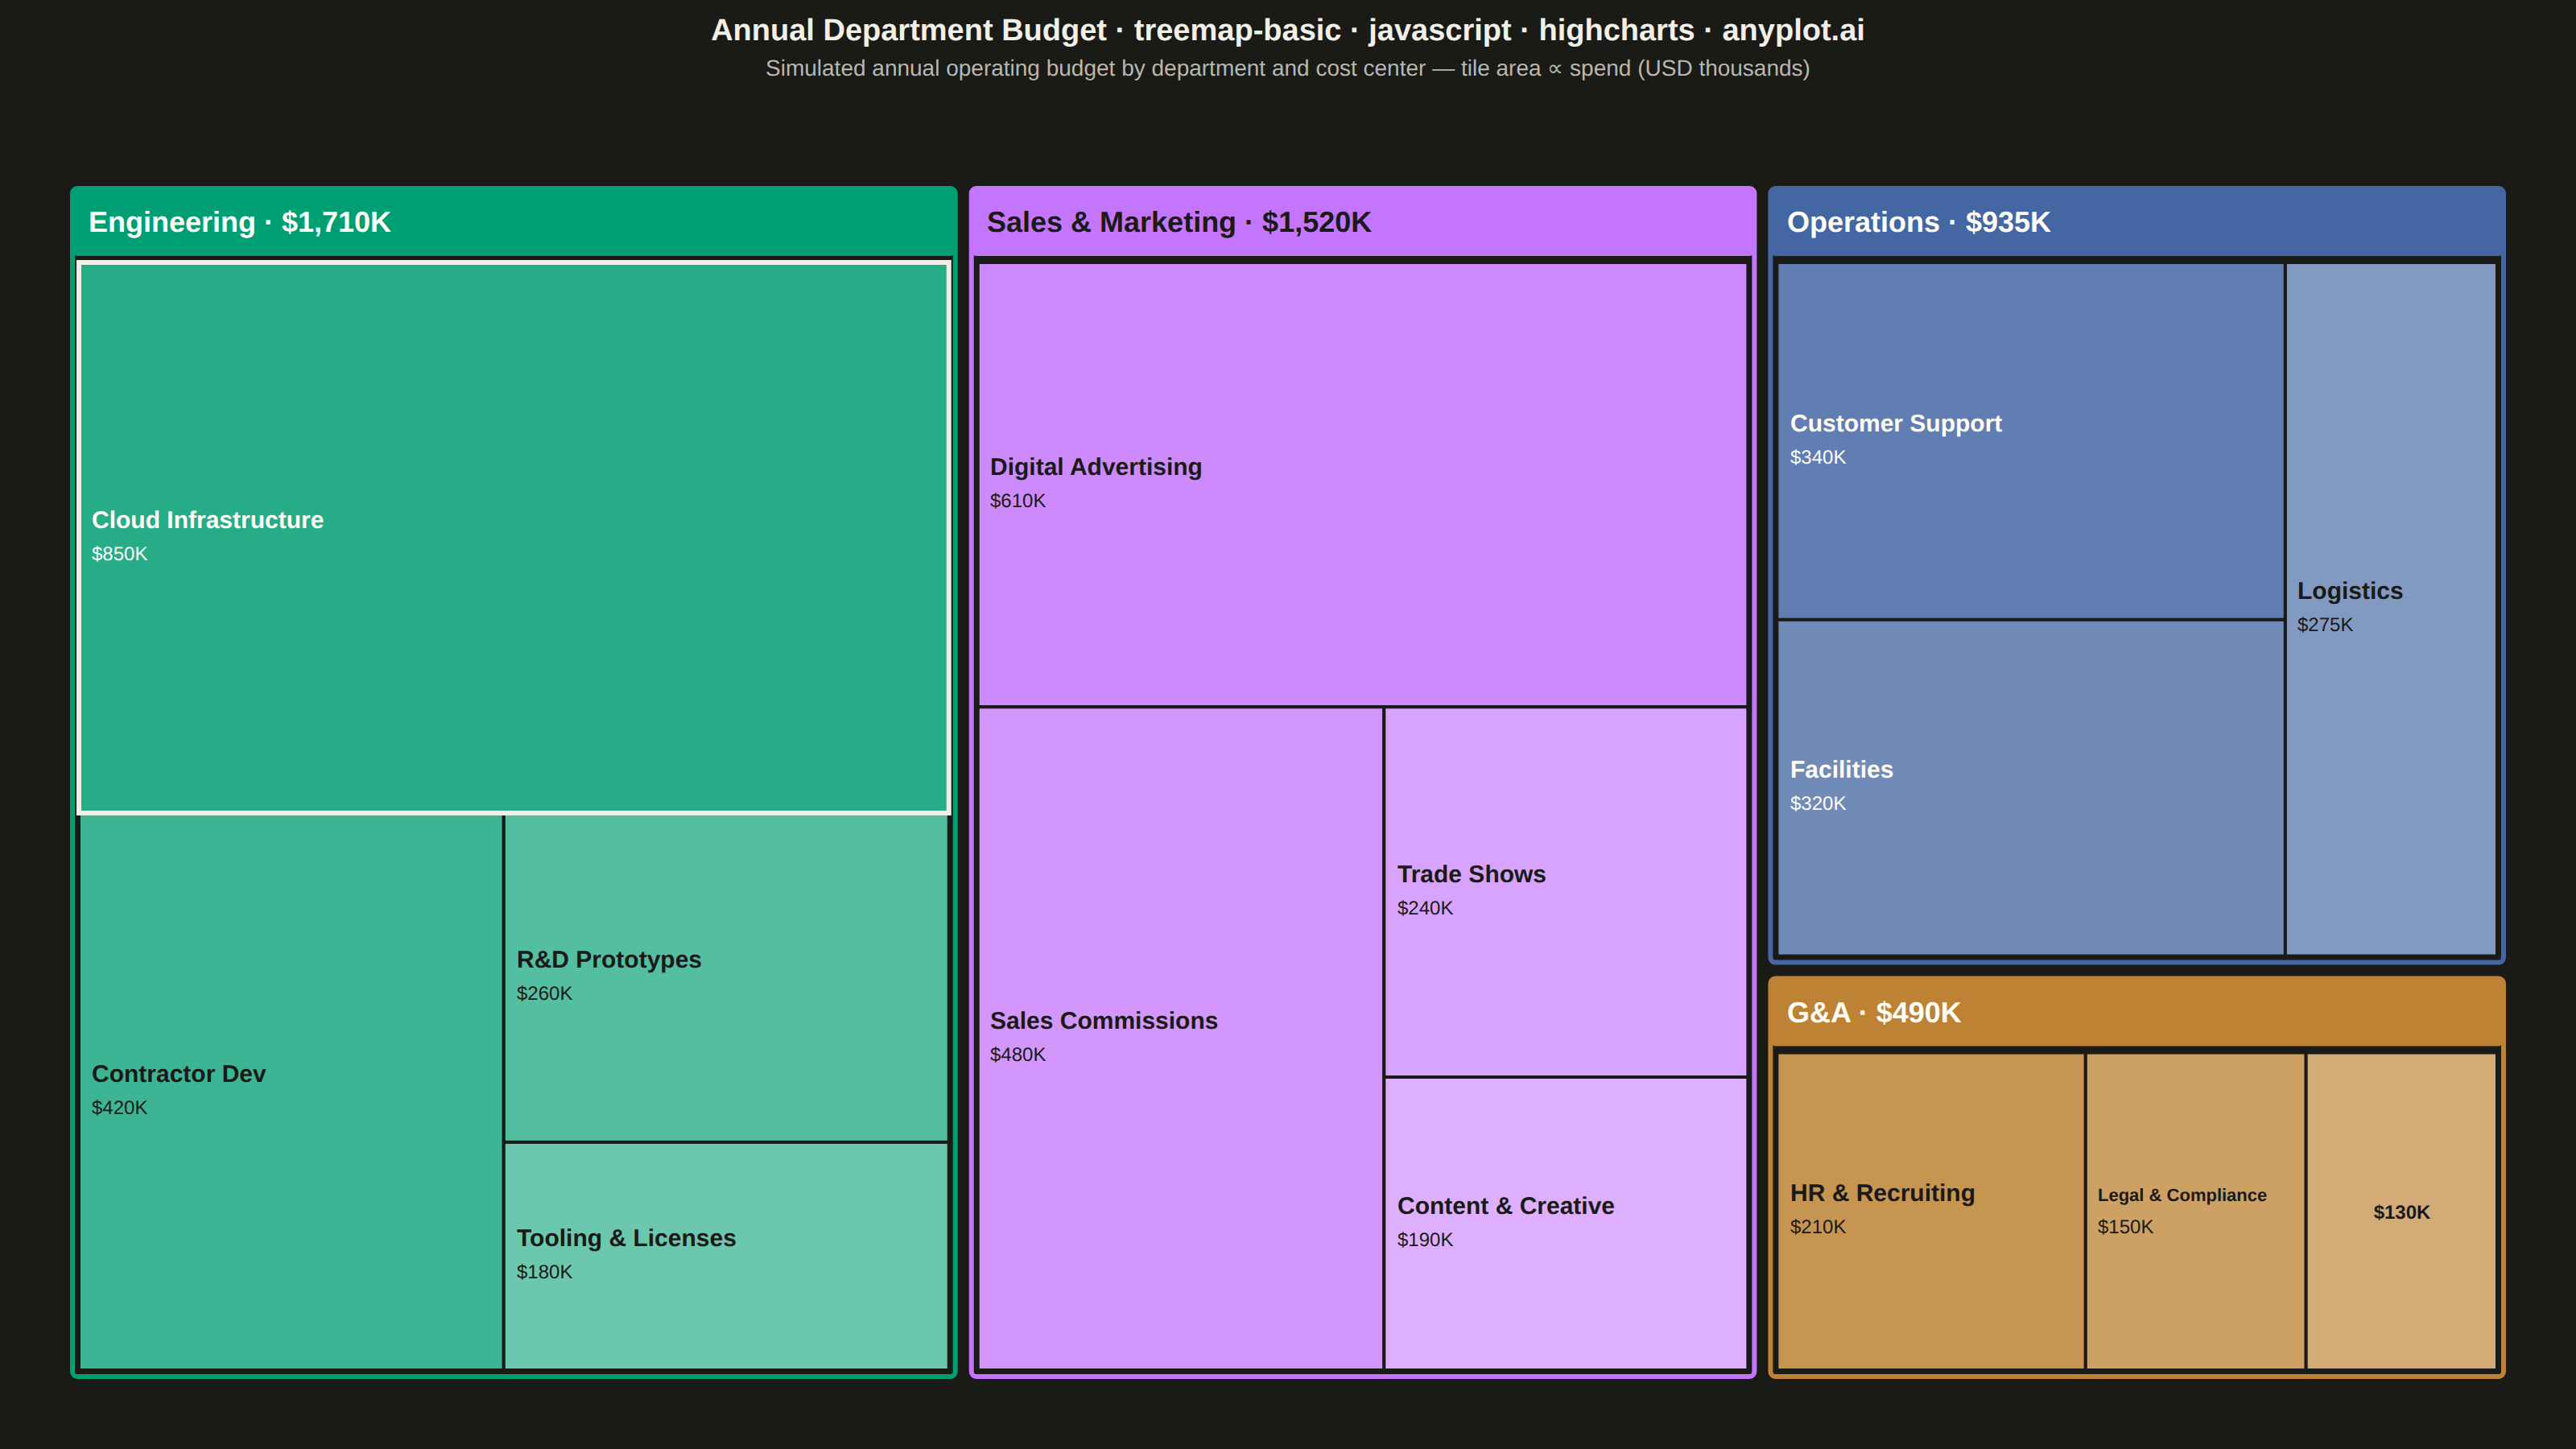
A treemap displaying hierarchical data as nested rectangles, where each rectangle's area is proportional to its value. This visualization excels at showing part-to-whole relationships in hierarchical structures, making it easy to spot large and small items at a glance. Treemaps efficiently use screen space to display large amounts of hierarchical data in a compact form.
// anyplot.ai
// treemap-basic: Basic Treemap
// Library: highcharts 12.6.0 | JavaScript 22.23.2
// Quality: 90/100 | Created: 2026-08-24

//# anyplot-orientation: landscape

// Only the core Highcharts bundle is loaded (no `treemap` module), so the
// rectangles are computed with a squarified-treemap algorithm (Bruls,
// Huizing & van Wijk) and drawn by hand with `chart.renderer.rect()` — the
// same hand-drawn technique sunburst-basic / sankey-basic / heatmap-basic
// use for series types the core bundle doesn't ship. Hover uses a native
// SVG `<title>` per rectangle (same trick as sunburst-basic), which covers
// the whole tile — not just an inscribed circle.

const t = window.ANYPLOT_TOKENS;

// --- Data: annual department budget by cost center (USD thousands) --------
const DEPARTMENTS = [
  {
    name: "Engineering",
    items: [
      { name: "Cloud Infrastructure", value: 850 },
      { name: "Contractor Dev", value: 420 },
      { name: "R&D Prototypes", value: 260 },
      { name: "Tooling & Licenses", value: 180 },
    ],
  },
  {
    name: "Sales & Marketing",
    items: [
      { name: "Digital Advertising", value: 610 },
      { name: "Sales Commissions", value: 480 },
      { name: "Trade Shows", value: 240 },
      { name: "Content & Creative", value: 190 },
    ],
  },
  {
    name: "Operations",
    items: [
      { name: "Customer Support", value: 340 },
      { name: "Facilities", value: 320 },
      { name: "Logistics", value: 275 },
    ],
  },
  {
    name: "G&A",
    items: [
      { name: "HR & Recruiting", value: 210 },
      { name: "Legal & Compliance", value: 150 },
      { name: "Finance & Accounting", value: 130 },
    ],
  },
];

DEPARTMENTS.forEach((dept, i) => {
  dept.color = t.palette[i]; // canonical order — abstract departments, no semantic hue
  dept.total = dept.items.reduce((s, d) => s + d.value, 0);
});
const GRAND_TOTAL = DEPARTMENTS.reduce((s, d) => s + d.total, 0);
// Largest single cost center overall — gets a bolder border below as the
// chart's one focal-point emphasis beyond the standard size/color/tint encoding.
const TOP_LEAF_VALUE = Math.max(...DEPARTMENTS.flatMap((d) => d.items.map((i) => i.value)));

// --- Squarified treemap layout (values -> rectangles) -----------------------
function worstRatio(row, side) {
  const sum = row.reduce((s, d) => s + d.area, 0);
  const maxA = Math.max(...row.map((d) => d.area));
  const minA = Math.min(...row.map((d) => d.area));
  return Math.max((side * side * maxA) / (sum * sum), (sum * sum) / (side * side * minA));
}

function squarify(items, x0, y0, x1, y1, out) {
  if (!items.length) return;
  const w = x1 - x0;
  const h = y1 - y0;
  const side = Math.min(w, h);
  let row = [items[0]];
  let i = 1;
  while (i < items.length) {
    const nextRow = row.concat(items[i]);
    if (worstRatio(nextRow, side) <= worstRatio(row, side)) {
      row = nextRow;
      i++;
    } else {
      break;
    }
  }
  const rowSum = row.reduce((s, d) => s + d.area, 0);
  if (w >= h) {
    const stripW = rowSum / h;
    let cy = y0;
    row.forEach((d) => {
      const rectH = d.area / stripW;
      out.push({ item: d, x: x0, y: cy, w: stripW, h: rectH });
      cy += rectH;
    });
    squarify(items.slice(row.length), x0 + stripW, y0, x1, y1, out);
  } else {
    const stripH = rowSum / w;
    let cx = x0;
    row.forEach((d) => {
      const rectW = d.area / stripH;
      out.push({ item: d, x: cx, y: y0, w: rectW, h: stripH });
      cx += rectW;
    });
    squarify(items.slice(row.length), x0, y0 + stripH, x1, y1, out);
  }
}

function layout(entries, x0, y0, x1, y1) {
  const total = entries.reduce((s, d) => s + d.value, 0);
  const scale = ((x1 - x0) * (y1 - y0)) / total;
  const sized = entries
    .slice()
    .sort((a, b) => b.value - a.value)
    .map((d) => ({ ...d, area: d.value * scale }));
  const out = [];
  squarify(sized, x0, y0, x1, y1, out);
  return out;
}

// --- Color + text helpers -----------------------------------------------
function hexToRgb(hex) {
  const c = parseInt(hex.slice(1), 16);
  return [(c >> 16) & 255, (c >> 8) & 255, c & 255];
}
function mix(hexA, hexB, f) {
  const [r1, g1, b1] = hexToRgb(hexA);
  const [r2, g2, b2] = hexToRgb(hexB);
  const r = Math.round(r1 + (r2 - r1) * f);
  const g = Math.round(g1 + (g2 - g1) * f);
  const b = Math.round(b1 + (b2 - b1) * f);
  return `#${[r, g, b].map((v) => v.toString(16).padStart(2, "0")).join("")}`;
}
function luma(hex) {
  const [r, g, b] = hexToRgb(hex);
  return (0.299 * r + 0.587 * g + 0.114 * b) / 255;
}
const labelColorFor = (bgHex) => (luma(bgHex) > 0.55 ? "#1A1A17" : "#FFFDF6");
const money = (v) => `$${v.toLocaleString("en-US")}K`;

// Shrink-to-fit: returns the largest fontSize in [min, nominal] whose
// estimated text width fits maxWidth, or null if even `min` overflows —
// callers treat null as "omit the label" (small tiles stay unlabeled).
function fitFontSize(text, maxWidth, nominal, min) {
  for (let size = nominal; size >= min; size--) {
    if (text.length * size * 0.56 + 6 <= maxWidth) return size;
  }
  return null;
}

// --- Title (fontsize scaled off the 67-char baseline) -----------------------
const TITLE_TEXT = "Annual Department Budget · treemap-basic · javascript · highcharts · anyplot.ai";
const TITLE_FS = Math.max(Math.round(22 * Math.min(1, 67 / TITLE_TEXT.length)), 14);

// --- Chart shell (no series/axes — the treemap is drawn by hand) -----------
const chart = Highcharts.chart("container", {
  chart: {
    backgroundColor: "transparent",
    animation: false,
    style: { fontFamily: "inherit" },
    marginTop: 112,
    marginBottom: 40,
    marginLeft: 40,
    marginRight: 40,
  },
  credits: { enabled: false },
  title: {
    text: TITLE_TEXT,
    style: { color: t.ink, fontSize: TITLE_FS + "px", fontWeight: "600" },
  },
  subtitle: {
    text: "Simulated annual operating budget by department and cost center — tile area ∝ spend (USD thousands)",
    style: { color: t.inkSoft, fontSize: "14px" },
  },
  xAxis: { visible: false },
  yAxis: { visible: false },
  legend: { enabled: false },
  plotOptions: { series: { animation: false } },
  series: [],
});

const PLOT_W = chart.plotWidth;
const PLOT_H = chart.plotHeight;
const DEPT_GAP = 10;
const LEAF_GAP = 4;
const HEADER_H = 42;
const HEADER_MIN_W = 90;
const HEADER_MIN_H = 90;

function addTooltip(el, text) {
  const titleEl = document.createElementNS("http://www.w3.org/2000/svg", "title");
  titleEl.textContent = text;
  el.element.appendChild(titleEl);
}

const g = chart.renderer.g("treemap").add();

// --- Level 1: department blocks ---------------------------------------------
const deptItems = DEPARTMENTS.map((d) => ({ name: d.name, value: d.total, dept: d }));
const deptRects = layout(deptItems, 0, 0, PLOT_W, PLOT_H);

deptRects.forEach(({ item, x, y, w, h }) => {
  const dept = item.dept;
  const bx = chart.plotLeft + x + DEPT_GAP / 2;
  const by = chart.plotTop + y + DEPT_GAP / 2;
  const bw = w - DEPT_GAP;
  const bh = h - DEPT_GAP;
  const deptPct = ((dept.total / GRAND_TOTAL) * 100).toFixed(1);

  const showHeader = bw >= HEADER_MIN_W && bh >= HEADER_MIN_H;
  const border = chart.renderer
    .rect(bx, by, bw, bh, 3)
    .attr({ fill: "none", stroke: dept.color, "stroke-width": 3, zIndex: 2 })
    .add(g);
  addTooltip(border, `${dept.name}\n${money(dept.total)} total (${deptPct}% of budget)`);

  let leafY0 = by + LEAF_GAP;
  if (showHeader) {
    const headerEl = chart.renderer
      .rect(bx, by, bw, HEADER_H, 3)
      .attr({ fill: dept.color, zIndex: 3 })
      .add(g);
    addTooltip(headerEl, `${dept.name}\n${money(dept.total)} total (${deptPct}% of budget)`);

    const headerLabel = `${dept.name} · ${money(dept.total)}`;
    const headerSize = fitFontSize(headerLabel, bw - 20, 18, 12);
    const text = headerSize ? headerLabel : dept.name;
    const finalSize = headerSize || fitFontSize(dept.name, bw - 20, 18, 12);
    if (finalSize) {
      chart.renderer
        .text(text, bx + 10, by + HEADER_H / 2 + finalSize * 0.35)
        .attr({ align: "left", zIndex: 4 })
        .css({ color: labelColorFor(dept.color), fontSize: `${finalSize}px`, fontWeight: "600", pointerEvents: "none" })
        .add(g);
    }
    leafY0 = by + HEADER_H + LEAF_GAP;
  }

  const innerX0 = bx + LEAF_GAP;
  const innerY0 = leafY0;
  const innerX1 = bx + bw - LEAF_GAP;
  const innerY1 = by + bh - LEAF_GAP;
  if (innerX1 <= innerX0 || innerY1 <= innerY0) return;

  const leafRects = layout(dept.items, innerX0, innerY0, innerX1, innerY1);
  leafRects.forEach((leaf, rank) => {
    const tint = Math.min(0.15 + rank * 0.09, 0.6);
    const fill = mix(dept.color, "#FFFFFF", tint);
    const pct = ((leaf.item.value / GRAND_TOTAL) * 100).toFixed(1);
    const isTopLeaf = leaf.item.value === TOP_LEAF_VALUE;

    const tileEl = chart.renderer
      .rect(leaf.x, leaf.y, leaf.w, leaf.h)
      .attr({
        fill,
        stroke: isTopLeaf ? t.ink : t.pageBg,
        "stroke-width": isTopLeaf ? 3 : 2,
        zIndex: isTopLeaf ? 4 : 3,
      })
      .add(g);
    addTooltip(
      tileEl,
      `${dept.name} → ${leaf.item.name}\n${money(leaf.item.value)} (${pct}% of budget)${isTopLeaf ? " — largest line item" : ""}`,
    );

    const nameSize = fitFontSize(leaf.item.name, leaf.w - 16, 15, 10);
    if (nameSize && leaf.h >= 30) {
      const showValue = leaf.h >= 52 && leaf.w >= 60;
      const nameY = showValue ? leaf.y + leaf.h / 2 - 6 : leaf.y + leaf.h / 2 + nameSize * 0.35;
      chart.renderer
        .text(leaf.item.name, leaf.x + 8, nameY)
        .attr({ align: "left", zIndex: 5 })
        .css({ color: labelColorFor(fill), fontSize: `${nameSize}px`, fontWeight: "600", pointerEvents: "none" })
        .add(g);
      if (showValue) {
        chart.renderer
          .text(money(leaf.item.value), leaf.x + 8, leaf.y + leaf.h / 2 + 14)
          .attr({ align: "left", zIndex: 5 })
          .css({ color: labelColorFor(fill), fontSize: "12px", pointerEvents: "none" })
          .add(g);
      }
    } else {
      // Fallback for tiles too small to fit the cost-center name: fall back to
      // a value-only label (smaller min font) so no tile ships completely blank.
      const valueText = money(leaf.item.value);
      const valueSize = fitFontSize(valueText, leaf.w - 10, 12, 7);
      if (valueSize && leaf.h >= 16) {
        chart.renderer
          .text(valueText, leaf.x + leaf.w / 2, leaf.y + leaf.h / 2 + valueSize * 0.35)
          .attr({ align: "center", zIndex: 5 })
          .css({ color: labelColorFor(fill), fontSize: `${valueSize}px`, fontWeight: "600", pointerEvents: "none" })
          .add(g);
      }
    }
  });
});
Runnable source as JSON, for any HTTP client: https://api.anyplot.ai/specs/treemap-basic/highcharts/code. Any spec id and library id listed in llms-full.txt fit the same URL shape; every URL below is complete and callable.
{
  "spec_id": "treemap-basic",
  "language": "javascript",
  "library": "highcharts",
  "page": "https://anyplot.ai/treemap-basic/javascript/highcharts",
  "hub": "https://anyplot.ai/treemap-basic",
  "code_json": "https://api.anyplot.ai/specs/treemap-basic/highcharts/code",
  "spec_json": "https://api.anyplot.ai/specs/treemap-basic",
  "render_light_png": "https://storage.googleapis.com/anyplot-images/plots/treemap-basic/javascript/highcharts/plot-light.png",
  "render_dark_png": "https://storage.googleapis.com/anyplot-images/plots/treemap-basic/javascript/highcharts/plot-dark.png",
  "interactive_light_html": "https://storage.googleapis.com/anyplot-images/plots/treemap-basic/javascript/highcharts/plot-light.html",
  "interactive_dark_html": "https://storage.googleapis.com/anyplot-images/plots/treemap-basic/javascript/highcharts/plot-dark.html",
  "quality_score": 90.0,
  "license": "MIT",
  "guide": "https://anyplot.ai/llms.txt"
}
Part of Basic Treemap on anyplot.ai.