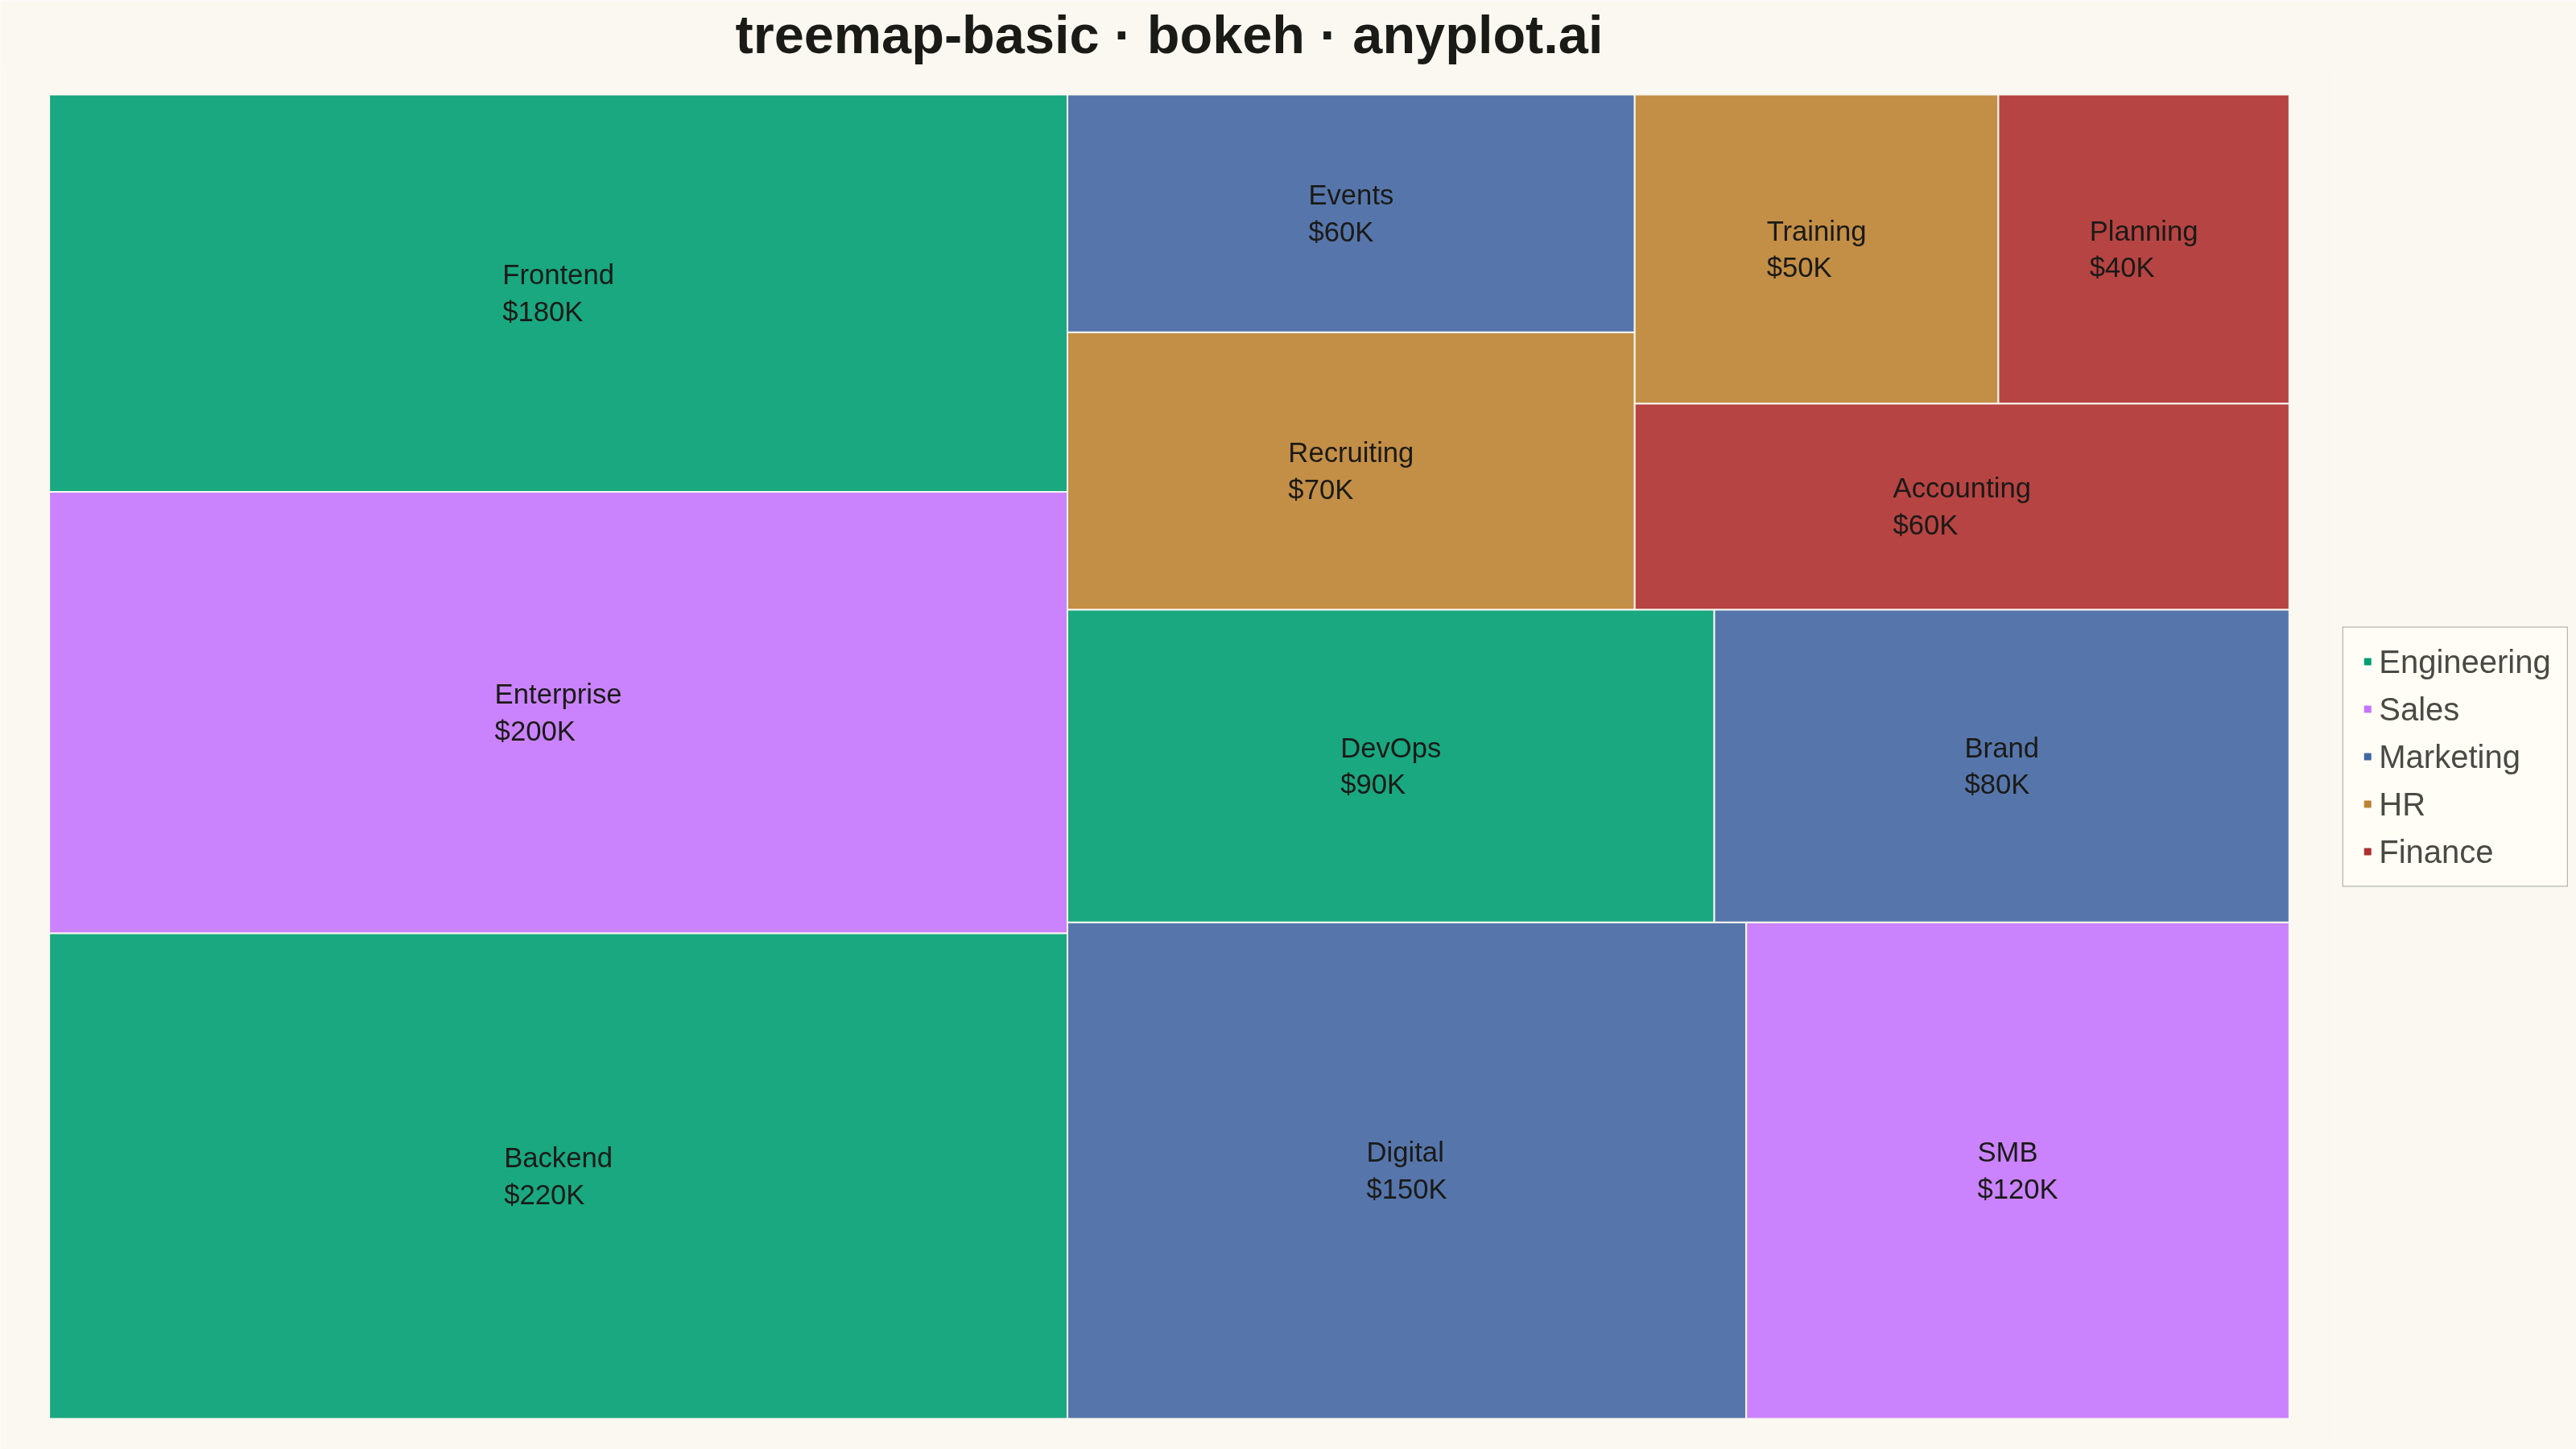
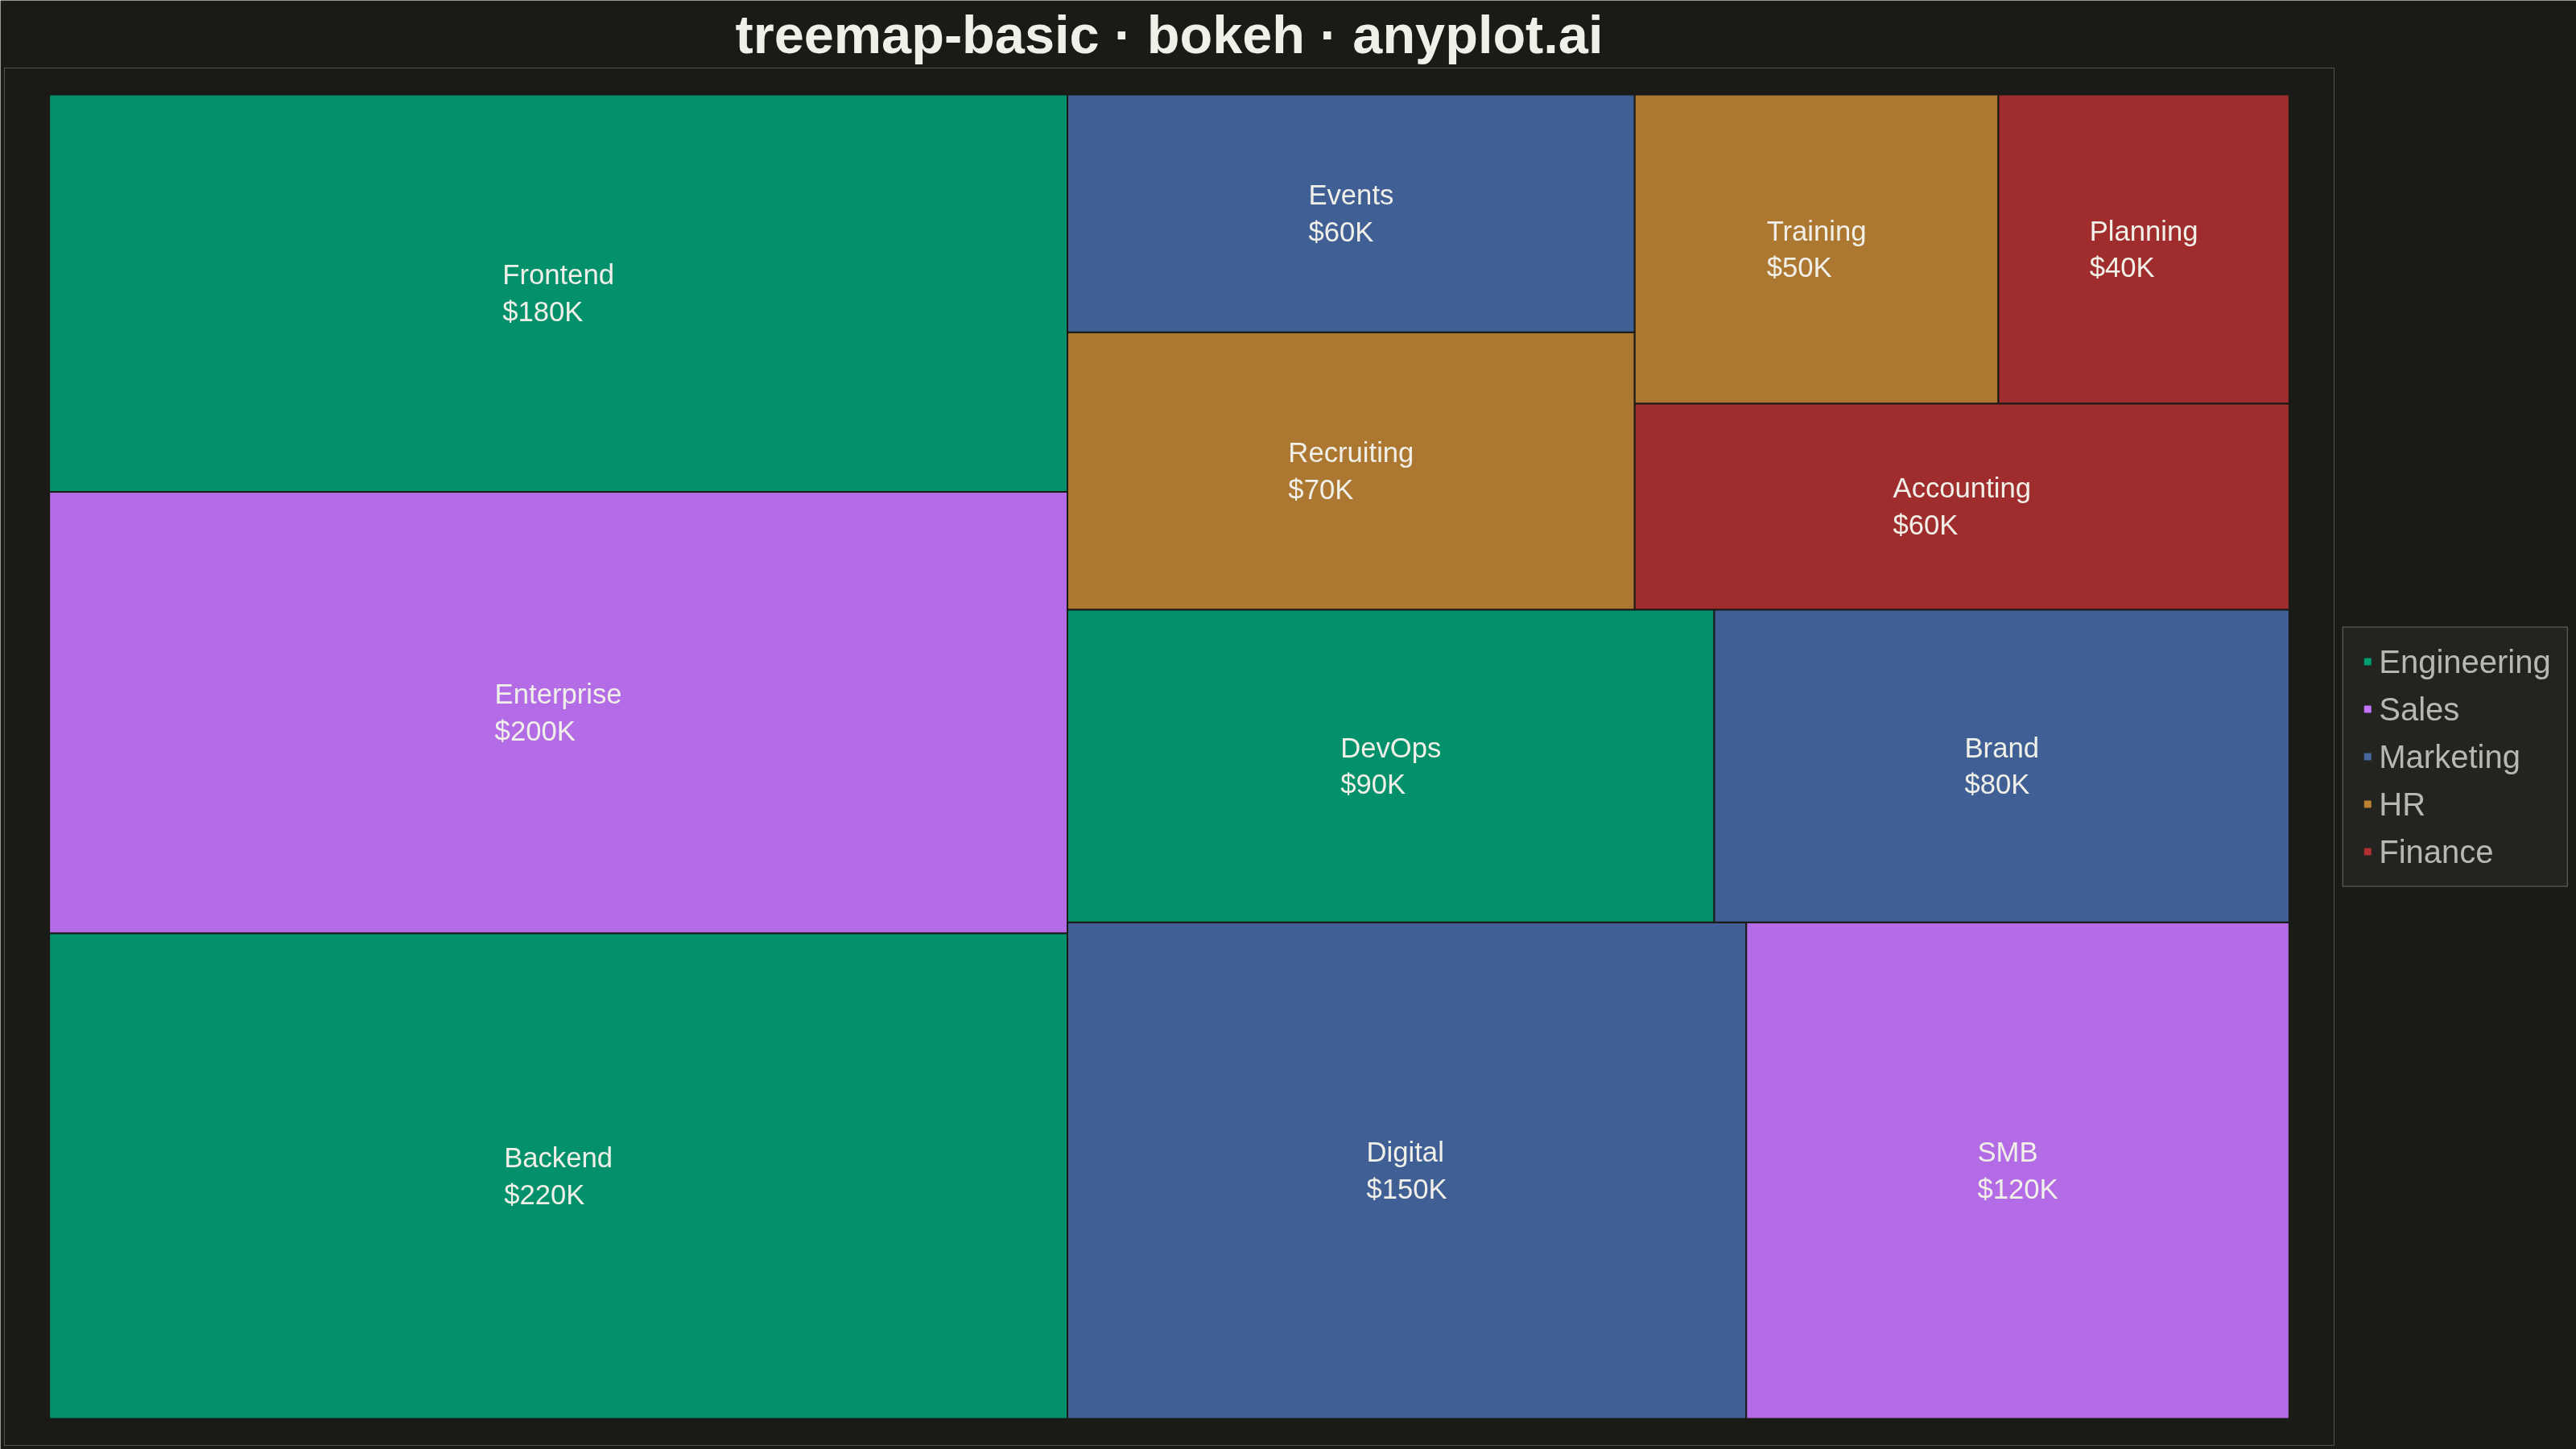
A treemap displaying hierarchical data as nested rectangles, where each rectangle's area is proportional to its value. This visualization excels at showing part-to-whole relationships in hierarchical structures, making it easy to spot large and small items at a glance. Treemaps efficiently use screen space to display large amounts of hierarchical data in a compact form.
""" anyplot.ai
treemap-basic: Basic Treemap
Library: bokeh 3.9.2 | Python 3.13.14
Quality: 81/100 | Updated: 2026-08-04
"""

import os
import time
from pathlib import Path

import pandas as pd
from bokeh.io import output_file, save
from bokeh.models import ColumnDataSource, HoverTool, LabelSet, Legend, LegendItem
from bokeh.plotting import figure
from selenium import webdriver
from selenium.webdriver.chrome.options import Options


# Theme tokens
THEME = os.getenv("ANYPLOT_THEME", "light")
PAGE_BG = "#FAF8F1" if THEME == "light" else "#1A1A17"
ELEVATED_BG = "#FFFDF6" if THEME == "light" else "#242420"
INK = "#1A1A17" if THEME == "light" else "#F0EFE8"
INK_SOFT = "#4A4A44" if THEME == "light" else "#B8B7B0"

IMPRINT = ["#009E73", "#C475FD", "#4467A3", "#BD8233", "#AE3030", "#2ABCCD"]

# Data - budget allocation by department and project
data = [
    {"category": "Engineering", "subcategory": "Backend", "value": 220},
    {"category": "Engineering", "subcategory": "Frontend", "value": 180},
    {"category": "Sales", "subcategory": "Enterprise", "value": 200},
    {"category": "Marketing", "subcategory": "Digital", "value": 150},
    {"category": "Sales", "subcategory": "SMB", "value": 120},
    {"category": "Engineering", "subcategory": "DevOps", "value": 90},
    {"category": "Marketing", "subcategory": "Brand", "value": 80},
    {"category": "HR", "subcategory": "Recruiting", "value": 70},
    {"category": "Marketing", "subcategory": "Events", "value": 60},
    {"category": "Finance", "subcategory": "Accounting", "value": 60},
    {"category": "HR", "subcategory": "Training", "value": 50},
    {"category": "Finance", "subcategory": "Planning", "value": 40},
]

# Create dataframe
df = pd.DataFrame(data)

# Group rows by category (largest total budget first), then by value
# descending within each category. Keeping same-category rows contiguous
# makes the squarify layout cluster them spatially, so category membership
# reads as a spatial grouping and not just a color coincidence.
category_totals = df.groupby("category")["value"].sum().sort_values(ascending=False)
category_rank = {cat: i for i, cat in enumerate(category_totals.index)}
df["_cat_rank"] = df["category"].map(category_rank)
df = df.sort_values(["_cat_rank", "value"], ascending=[True, False]).drop(columns="_cat_rank").reset_index(drop=True)

# Map categories to colors using the Imprint palette
unique_categories = df["category"].unique()
category_color_map = {cat: IMPRINT[i % len(IMPRINT)] for i, cat in enumerate(unique_categories)}

# Extract values and labels
values = df["value"].values
labels = df["subcategory"].values
categories = df["category"].values

# Normalize sizes to fit in 100x100 area
total_value = sum(values)
normalized = [v * 10000 / total_value for v in values]


# Squarify algorithm for treemap layout
def squarify(sizes, x=0, y=0, w=100, h=100):
    """Layout rectangles using squarify algorithm."""
    rects = []
    if not sizes:
        return rects

    remaining = list(enumerate(sizes))

    while remaining:
        if w >= h:
            # Horizontal layout
            row = []
            row_area = 0
            best_ratio = float("inf")

            for _i, (idx, size) in enumerate(remaining):
                test_row = row + [(idx, size)]
                test_area = row_area + size
                col_width = test_area / h if h > 0 else 0

                ratios = []
                for _, s in test_row:
                    rect_h = s / col_width if col_width > 0 else 0
                    ratio = max(col_width / rect_h, rect_h / col_width) if rect_h > 0 else float("inf")
                    ratios.append(ratio)
                test_ratio = max(ratios) if ratios else float("inf")

                if test_ratio <= best_ratio:
                    row = test_row
                    row_area = test_area
                    best_ratio = test_ratio
                else:
                    break

            col_width = row_area / h if h > 0 else 0
            rect_y = y
            for idx, size in row:
                rect_h = size / col_width if col_width > 0 else 0
                rects.append({"idx": idx, "x": x, "y": rect_y, "dx": col_width, "dy": rect_h})
                rect_y += rect_h

            x += col_width
            w -= col_width
            remaining = remaining[len(row) :]
        else:
            # Vertical layout
            row = []
            row_area = 0
            best_ratio = float("inf")

            for _i, (idx, size) in enumerate(remaining):
                test_row = row + [(idx, size)]
                test_area = row_area + size
                row_height = test_area / w if w > 0 else 0

                ratios = []
                for _, s in test_row:
                    rect_w = s / row_height if row_height > 0 else 0
                    ratio = max(rect_w / row_height, row_height / rect_w) if rect_w > 0 else float("inf")
                    ratios.append(ratio)
                test_ratio = max(ratios) if ratios else float("inf")

                if test_ratio <= best_ratio:
                    row = test_row
                    row_area = test_area
                    best_ratio = test_ratio
                else:
                    break

            row_height = row_area / w if w > 0 else 0
            rect_x = x
            for idx, size in row:
                rect_w = size / row_height if row_height > 0 else 0
                rects.append({"idx": idx, "x": rect_x, "y": y, "dx": rect_w, "dy": row_height})
                rect_x += rect_w

            y += row_height
            h -= row_height
            remaining = remaining[len(row) :]

    return rects


rects = squarify(normalized)
rects = sorted(rects, key=lambda r: r["idx"])


def category_boundaries(rects, categories, tol=1e-6):
    """Find shared edges between rectangles of different categories.

    Returns the (x0, y0, x1, y1) segments to draw as bold divider lines —
    the spec calls for subtle borders that "show hierarchy boundaries", so
    only edges between two different categories get the heavier treatment.
    """
    segments = []
    for i, a in enumerate(rects):
        ax0, ay0, ax1, ay1 = a["x"], a["y"], a["x"] + a["dx"], a["y"] + a["dy"]
        for b in rects[i + 1 :]:
            if categories[a["idx"]] == categories[b["idx"]]:
                continue
            bx0, by0, bx1, by1 = b["x"], b["y"], b["x"] + b["dx"], b["y"] + b["dy"]

            if abs(ax1 - bx0) < tol or abs(bx1 - ax0) < tol:
                shared_x = ax1 if abs(ax1 - bx0) < tol else ax0
                lo, hi = max(ay0, by0), min(ay1, by1)
                if hi - lo > tol:
                    segments.append((shared_x, lo, shared_x, hi))

            if abs(ay1 - by0) < tol or abs(by1 - ay0) < tol:
                shared_y = ay1 if abs(ay1 - by0) < tol else ay0
                lo, hi = max(ax0, bx0), min(ax1, bx1)
                if hi - lo > tol:
                    segments.append((lo, shared_y, hi, shared_y))

    return segments


boundary_segments = category_boundaries(rects, categories)

# Extract rectangle data for plotting
x_centers = []
y_centers = []
widths = []
heights = []
colors = []
display_labels = []
hover_category = []
hover_subcategory = []
hover_value = []
hover_share = []

for r in rects:
    idx = r["idx"]
    rx, ry = r["x"], r["y"]
    rw, rh = r["dx"], r["dy"]

    x_centers.append(rx + rw / 2)
    y_centers.append(ry + rh / 2)
    widths.append(rw)
    heights.append(rh)
    colors.append(category_color_map[categories[idx]])
    hover_category.append(categories[idx])
    hover_subcategory.append(labels[idx])
    hover_value.append(int(values[idx]))
    hover_share.append(round(100 * values[idx] / total_value, 1))

    if rw > 10 and rh > 8:
        display_labels.append(f"{labels[idx]}\n${int(values[idx])}K")
    elif rw > 6 or rh > 6:
        display_labels.append(labels[idx])
    else:
        display_labels.append("")

# Create data source
source = ColumnDataSource(
    data={
        "x": x_centers,
        "y": y_centers,
        "width": widths,
        "height": heights,
        "color": colors,
        "label": display_labels,
        "category": hover_category,
        "subcategory": hover_subcategory,
        "value": hover_value,
        "share": hover_share,
    }
)

# Hover tooltip — idiomatic bokeh interactivity for the HTML detail view
# (inert in the static PNG since toolbar_location=None, but active on hover
# in plot-{THEME}.html)
hover = HoverTool(
    tooltips=[
        ("Department", "@category"),
        ("Project", "@subcategory"),
        ("Budget", "$@value{0,0}K"),
        ("Share of total", "@share%"),
    ]
)

# Create figure
p = figure(
    width=3200,
    height=1800,
    title="treemap-basic · bokeh · anyplot.ai",
    x_range=(-2, 102),
    y_range=(-2, 102),
    tools=[hover],
    toolbar_location=None,
)

# Style figure background
p.background_fill_color = PAGE_BG
p.border_fill_color = PAGE_BG
p.outline_line_color = None

# Draw rectangles
p.rect(
    x="x",
    y="y",
    width="width",
    height="height",
    source=source,
    fill_color="color",
    fill_alpha=0.90,
    line_color=PAGE_BG,
    line_width=2,
    hover_fill_alpha=1.0,
    hover_line_color=INK,
)

# Bold divider lines only where two different categories meet — reinforces
# the hierarchy spatially (not just via color), leaving within-category
# rectangles separated by the thin uniform border above.
if boundary_segments:
    bx0, by0, bx1, by1 = zip(*boundary_segments, strict=True)
    p.segment(x0=list(bx0), y0=list(by0), x1=list(bx1), y1=list(by1), line_color=INK_SOFT, line_width=5)

# Add labels
labels_set = LabelSet(
    x="x",
    y="y",
    text="label",
    source=source,
    text_align="center",
    text_baseline="middle",
    text_font_size="26pt",
    text_color=INK,
)
p.add_layout(labels_set)

# Style title
p.title.text_font_size = "50pt"
p.title.text_color = INK
p.title.align = "center"

# Hide axes for cleaner look
p.xaxis.visible = False
p.yaxis.visible = False
p.xgrid.visible = False
p.ygrid.visible = False

# Legend — real bokeh Legend anchored in the right gutter, outside the
# treemap's 0-100 data area, so it never overlaps a rectangle. Each item
# references an invisible dummy renderer colored from category_color_map.
legend_items = []
for cat, color in category_color_map.items():
    dummy = p.scatter(x=[-10], y=[-10], marker="square", size=0, fill_color=color, line_color=color)
    legend_items.append(LegendItem(label=cat, renderers=[dummy]))

legend = Legend(
    items=legend_items,
    location="center",
    label_text_font_size="30pt",
    label_text_color=INK_SOFT,
    background_fill_color=ELEVATED_BG,
    border_line_color=INK_SOFT,
    padding=20,
    spacing=14,
)
p.add_layout(legend, "right")

# Save HTML
output_file(f"plot-{THEME}.html")
save(p)

# Screenshot with headless Chrome
W, H = 3200, 1800
opts = Options()
for arg in (
    "--headless=new",
    "--no-sandbox",
    "--disable-dev-shm-usage",
    "--disable-gpu",
    f"--window-size={W},{H}",
    "--hide-scrollbars",
):
    opts.add_argument(arg)

driver = webdriver.Chrome(options=opts)
driver.set_window_size(W, H)
driver.get(f"file://{Path(f'plot-{THEME}.html').resolve()}")
# Headless Chrome's --window-size sets the OUTER window, which still reserves
# a phantom title-bar height even headless — pin the viewport exactly via CDP.
driver.execute_cdp_cmd(
    "Emulation.setDeviceMetricsOverride", {"width": W, "height": H, "deviceScaleFactor": 1, "mobile": False}
)
time.sleep(3)
driver.save_screenshot(f"plot-{THEME}.png")
driver.quit()
Runnable source as JSON, for any HTTP client: https://api.anyplot.ai/specs/treemap-basic/bokeh/code. Any spec id and library id listed in llms-full.txt fit the same URL shape; every URL below is complete and callable.
{
  "spec_id": "treemap-basic",
  "language": "python",
  "library": "bokeh",
  "page": "https://anyplot.ai/treemap-basic/python/bokeh",
  "hub": "https://anyplot.ai/treemap-basic",
  "code_json": "https://api.anyplot.ai/specs/treemap-basic/bokeh/code",
  "spec_json": "https://api.anyplot.ai/specs/treemap-basic",
  "render_light_png": "https://storage.googleapis.com/anyplot-images/plots/treemap-basic/python/bokeh/plot-light.png",
  "render_dark_png": "https://storage.googleapis.com/anyplot-images/plots/treemap-basic/python/bokeh/plot-dark.png",
  "interactive_light_html": "https://storage.googleapis.com/anyplot-images/plots/treemap-basic/python/bokeh/plot-light.html",
  "interactive_dark_html": "https://storage.googleapis.com/anyplot-images/plots/treemap-basic/python/bokeh/plot-dark.html",
  "quality_score": 81.0,
  "license": "MIT",
  "guide": "https://anyplot.ai/llms.txt"
}
Part of Basic Treemap on anyplot.ai.