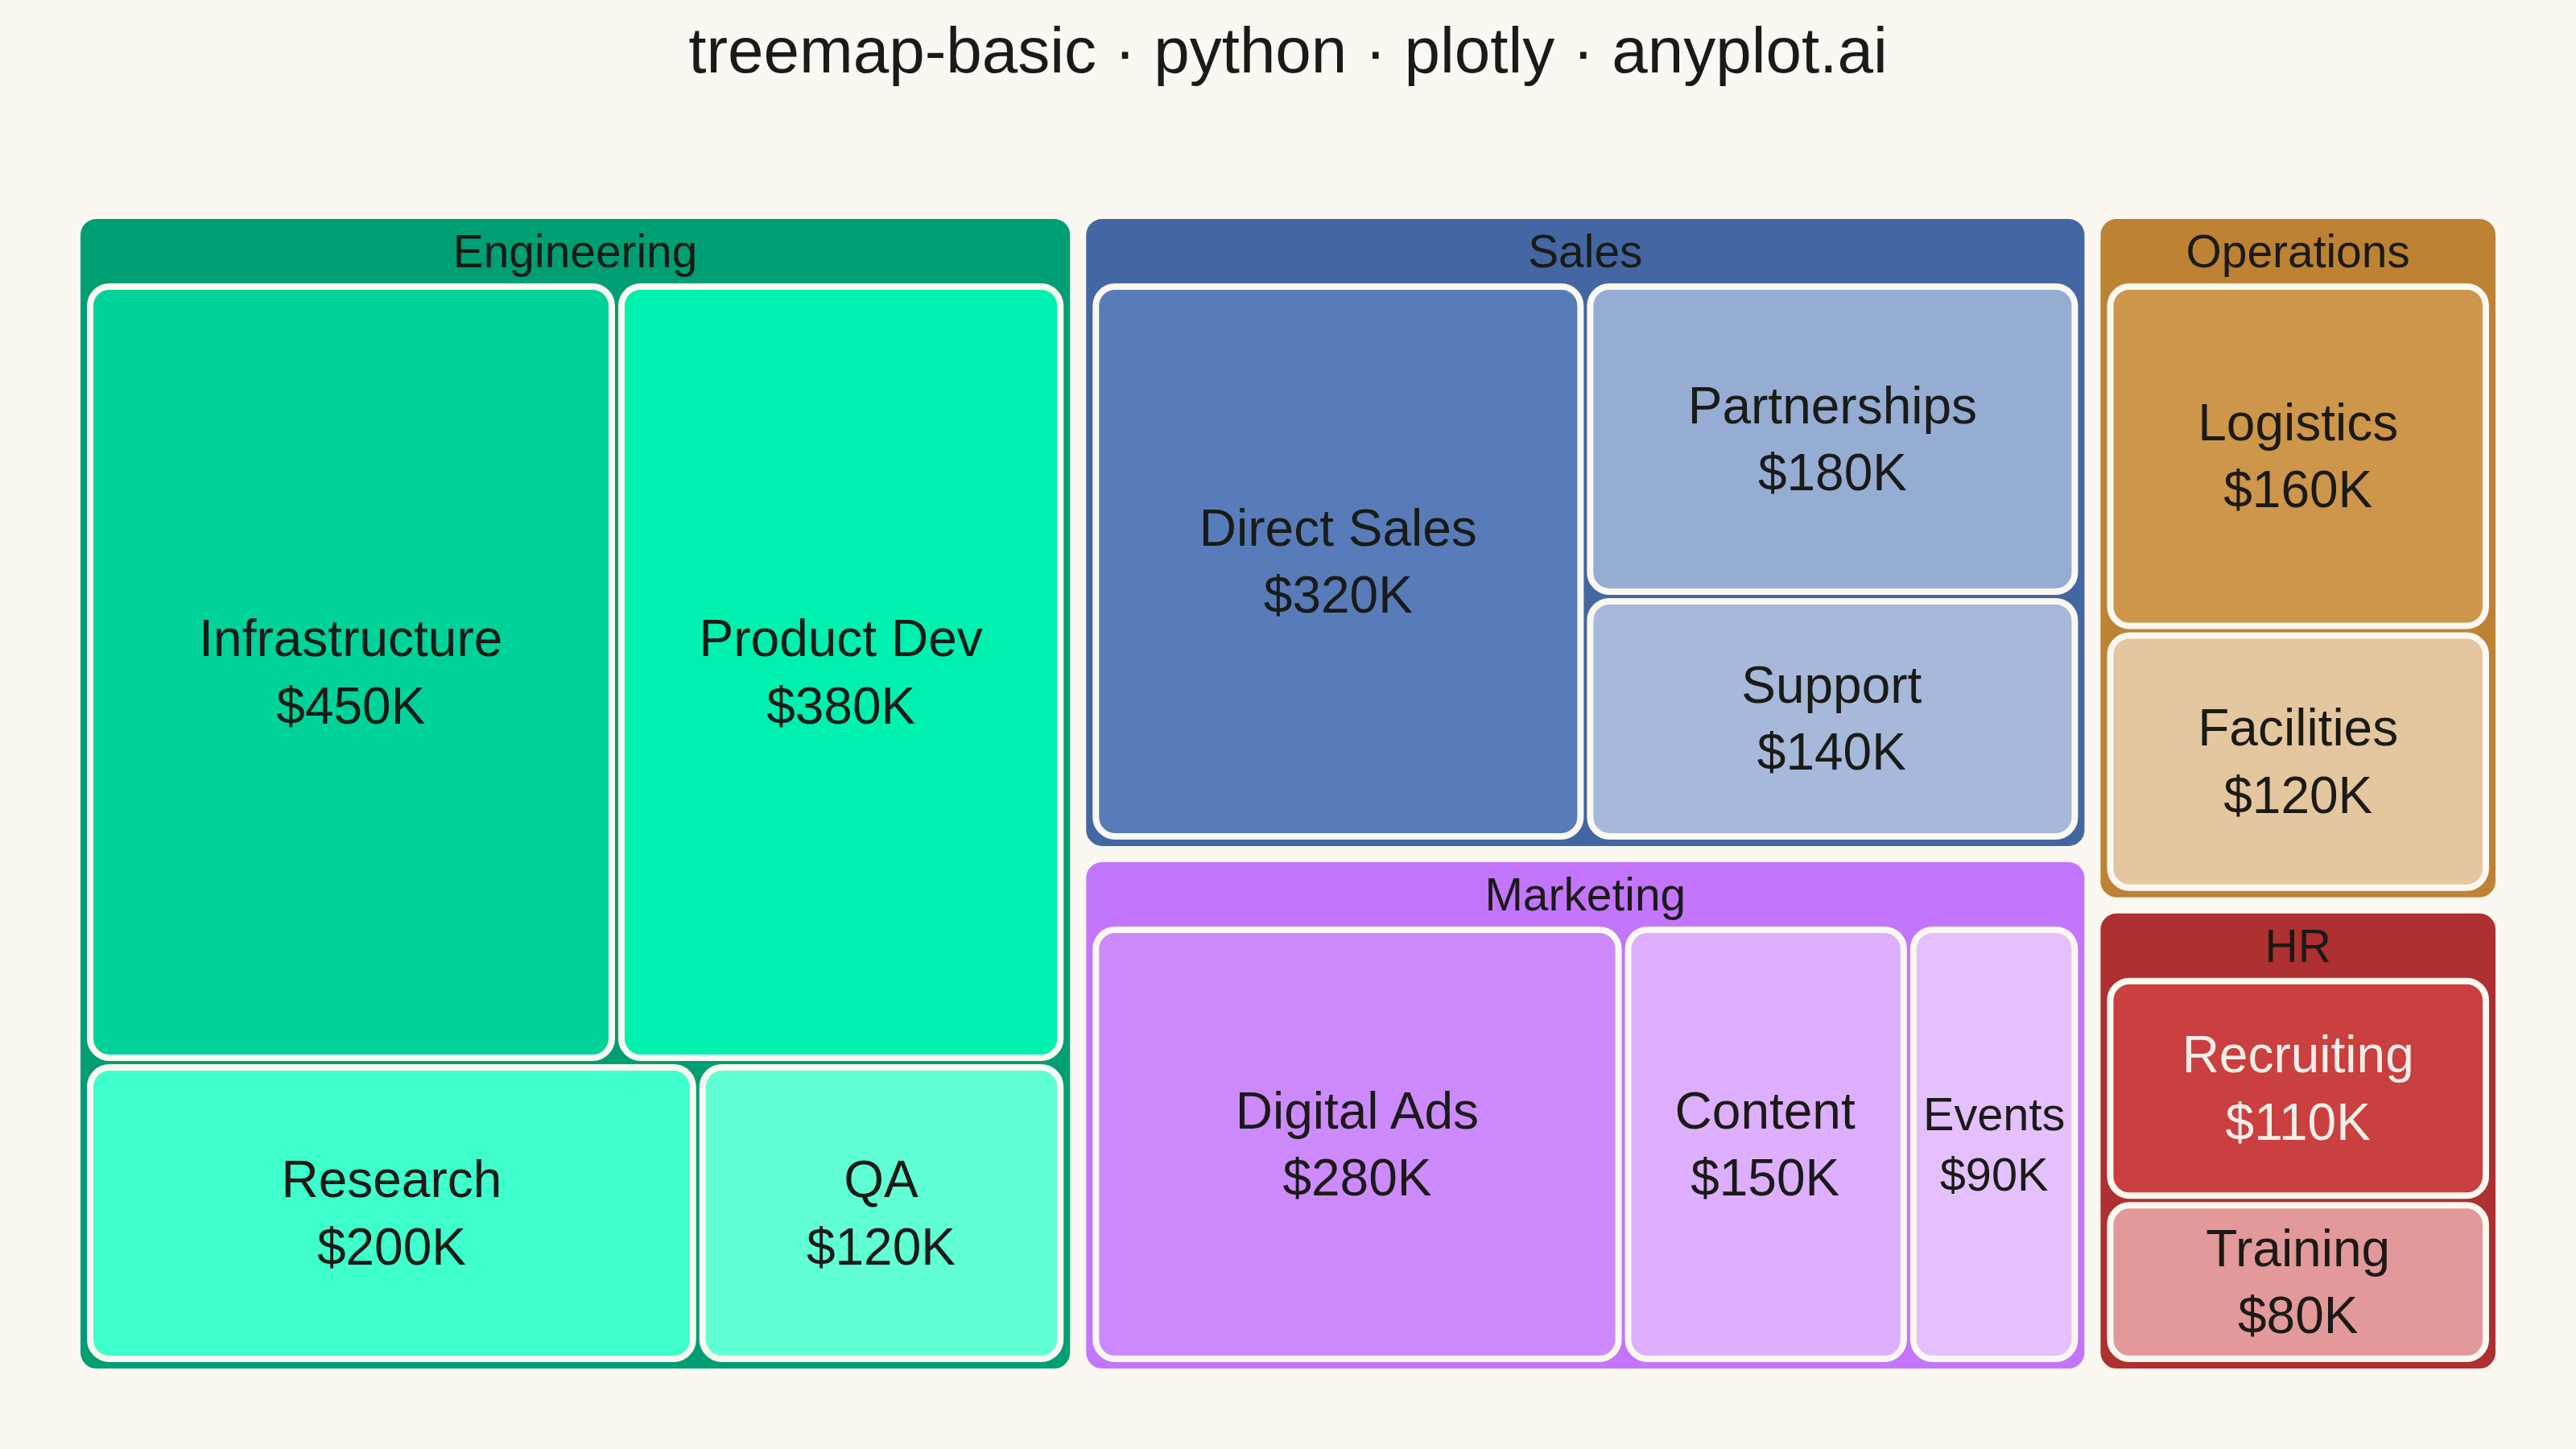
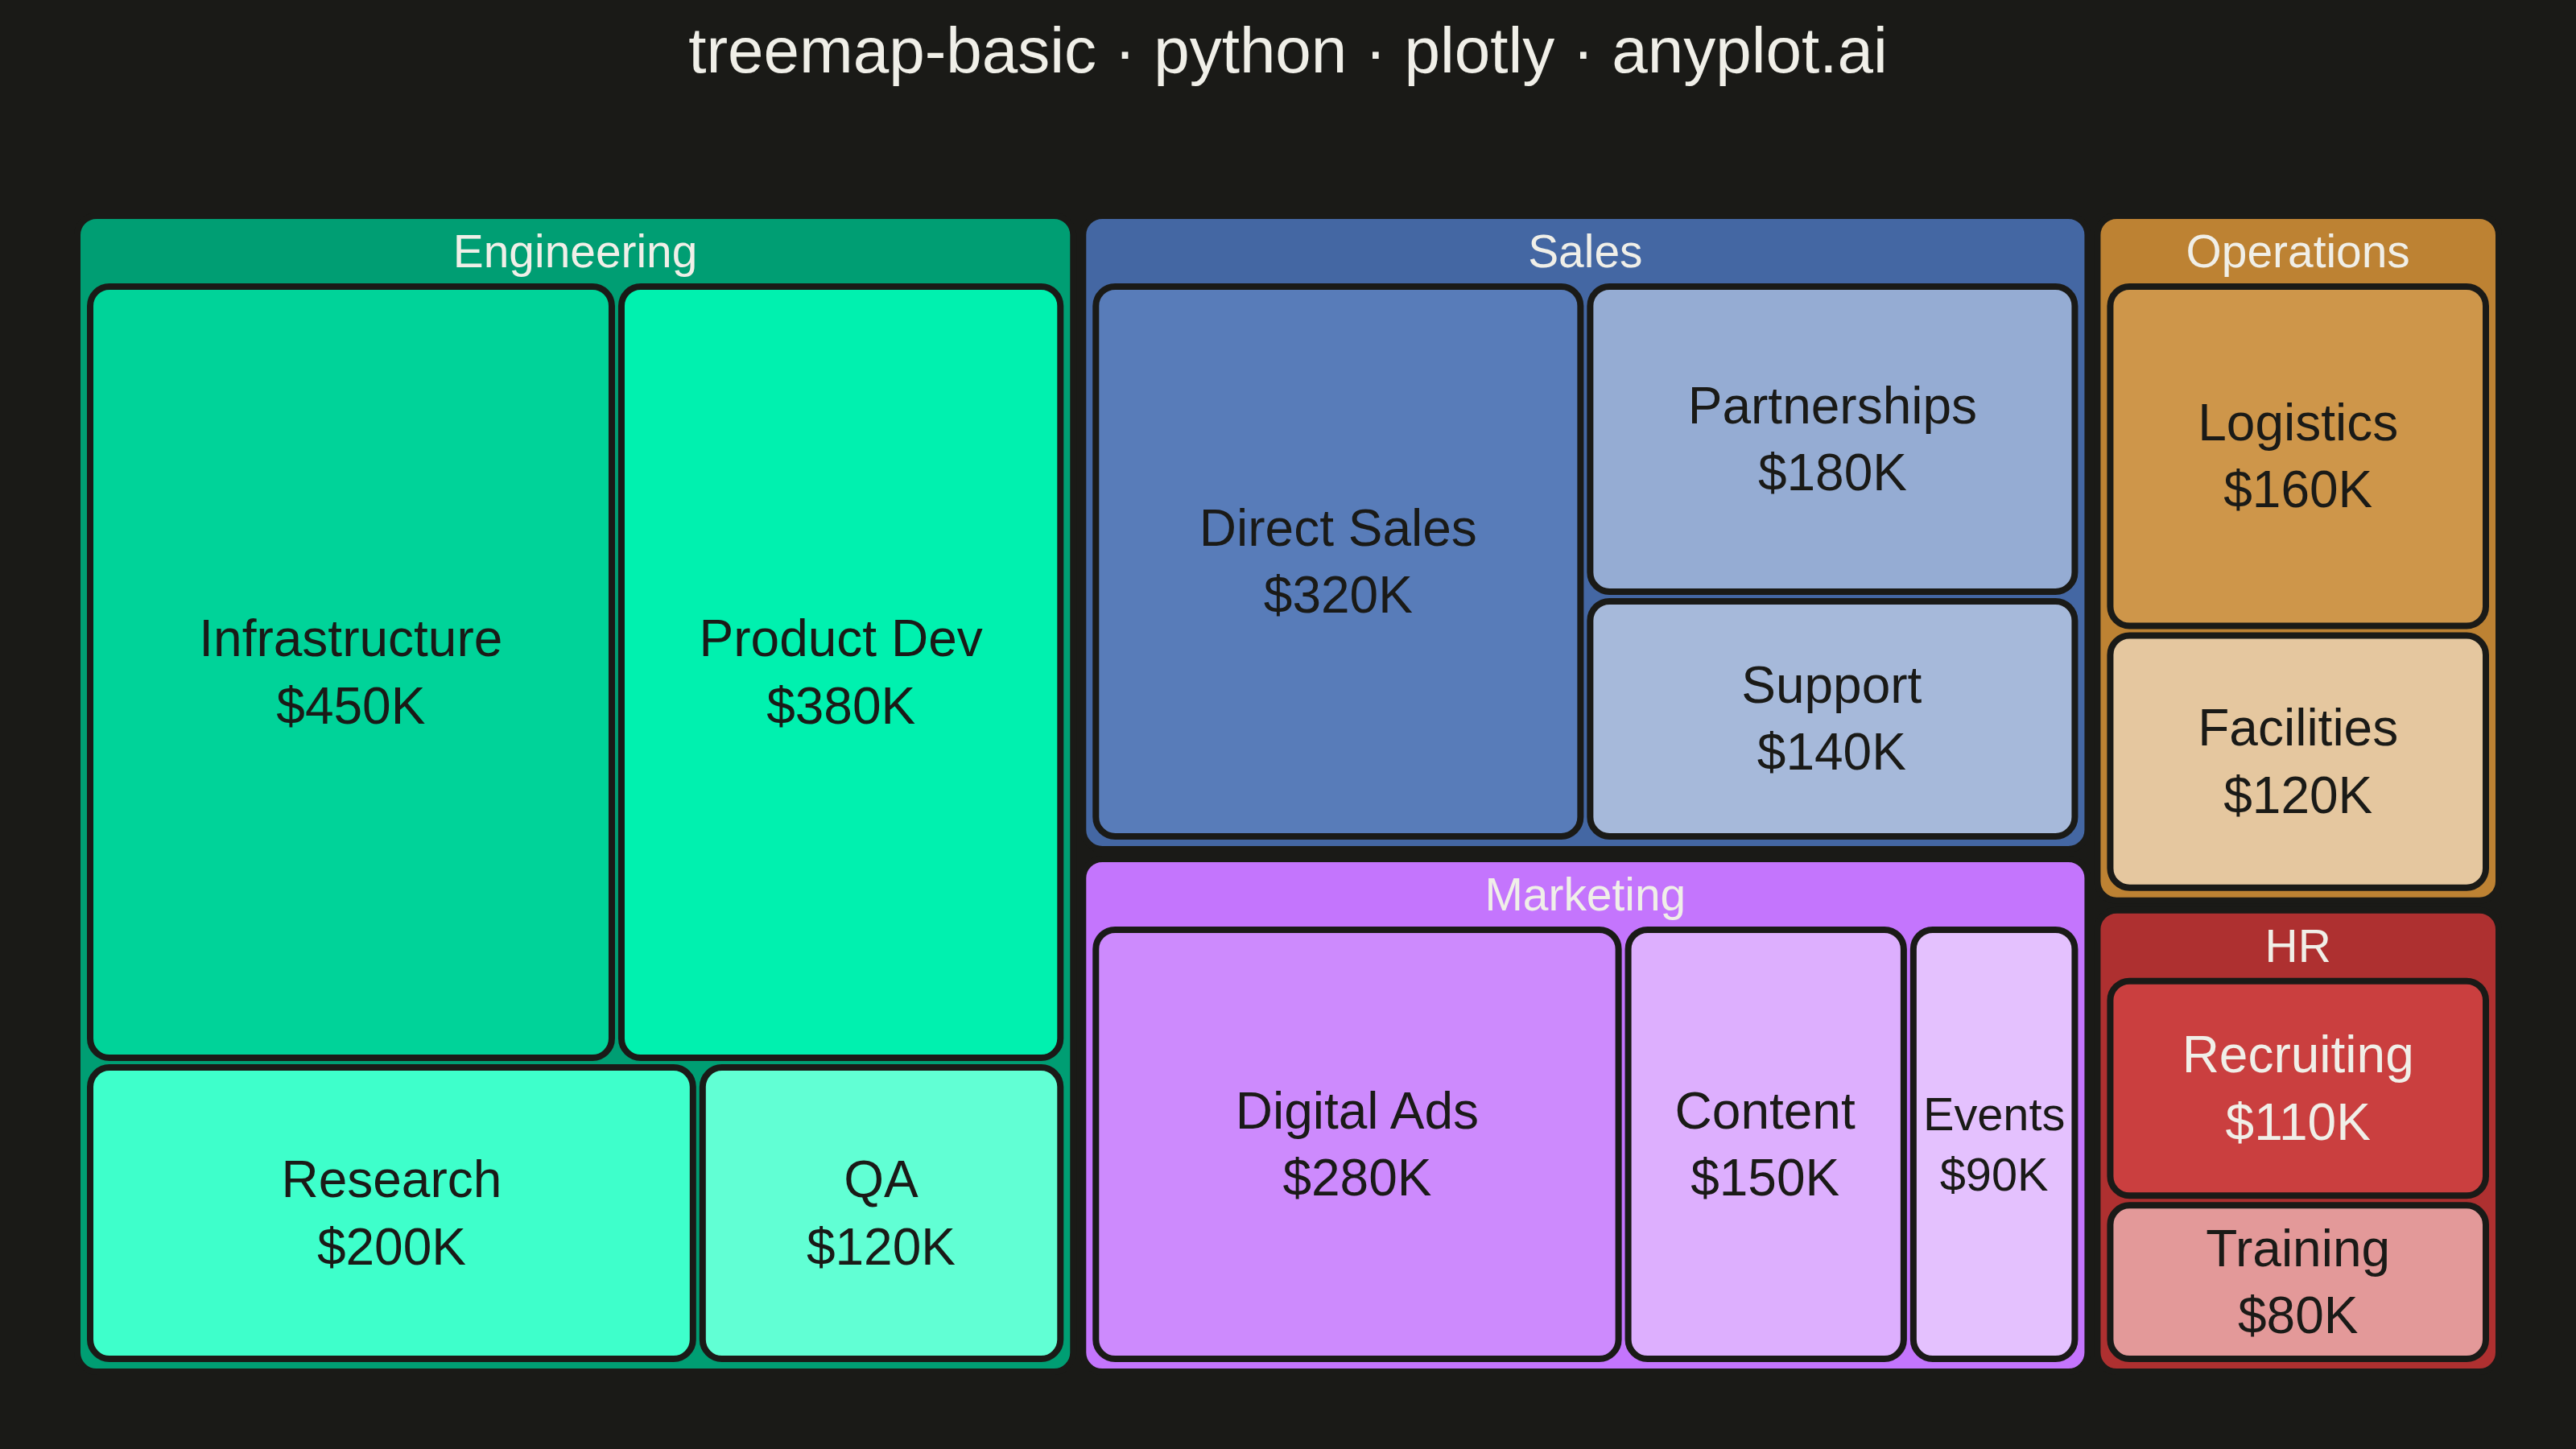
A treemap displaying hierarchical data as nested rectangles, where each rectangle's area is proportional to its value. This visualization excels at showing part-to-whole relationships in hierarchical structures, making it easy to spot large and small items at a glance. Treemaps efficiently use screen space to display large amounts of hierarchical data in a compact form.
""" anyplot.ai
treemap-basic: Basic Treemap
Library: plotly 6.9.0 | Python 3.13.14
Quality: 95/100 | Updated: 2026-08-04
"""

import colorsys
import os
import sys


sys.path = [p for p in sys.path if p != os.path.dirname(os.path.abspath(__file__))]
import plotly.graph_objects as go


# Theme tokens
THEME = os.getenv("ANYPLOT_THEME", "light")
PAGE_BG = "#FAF8F1" if THEME == "light" else "#1A1A17"
INK = "#1A1A17" if THEME == "light" else "#F0EFE8"
INK_SOFT = "#4A4A44" if THEME == "light" else "#B8B7B0"

# Imprint palette (canonical order) for main categories
IMPRINT = ["#009E73", "#C475FD", "#4467A3", "#BD8233", "#AE3030"]

# Data - Budget allocation by department and project (in thousands)
categories = [
    "Engineering",
    "Engineering",
    "Engineering",
    "Engineering",
    "Marketing",
    "Marketing",
    "Marketing",
    "Sales",
    "Sales",
    "Sales",
    "Operations",
    "Operations",
    "HR",
    "HR",
]
subcategories = [
    "Infrastructure",
    "Product Dev",
    "QA",
    "Research",
    "Digital Ads",
    "Content",
    "Events",
    "Direct Sales",
    "Partnerships",
    "Support",
    "Logistics",
    "Facilities",
    "Recruiting",
    "Training",
]
values = [450, 380, 120, 200, 280, 150, 90, 320, 180, 140, 160, 120, 110, 80]

unique_cats_ordered = ["Engineering", "Marketing", "Sales", "Operations", "HR"]

# Category totals (each department is a treemap root)
category_totals = {}
for cat, val in zip(categories, values, strict=True):
    category_totals[cat] = category_totals.get(cat, 0) + val


def lighten(hex_color, amount):
    """Blend a hex color toward white in HLS space; amount 0=unchanged, 1=white."""
    r, g, b = (int(hex_color[i : i + 2], 16) / 255 for i in (1, 3, 5))
    h, lightness, s = colorsys.rgb_to_hls(r, g, b)
    lightness = lightness + (1 - lightness) * amount
    r2, g2, b2 = colorsys.hls_to_rgb(h, lightness, s)
    return f"#{round(r2 * 255):02X}{round(g2 * 255):02X}{round(b2 * 255):02X}"


def relative_luminance(hex_color):
    """WCAG relative luminance of a hex color."""

    def channel(c):
        c /= 255
        return c / 12.92 if c <= 0.03928 else ((c + 0.055) / 1.055) ** 2.4

    r, g, b = (channel(int(hex_color[i : i + 2], 16)) for i in (1, 3, 5))
    return 0.2126 * r + 0.7152 * g + 0.0722 * b


def best_text_color(bg_hex):
    """Pick whichever ink extreme has higher WCAG contrast against bg_hex.

    Subcategory tiles get lightened toward white by a variable amount to encode
    magnitude, so a single fixed text color washes out on the palest tiles in
    dark theme. Choosing per-tile from the tile's own resulting lightness keeps
    every leaf legible regardless of how far it was tinted.
    """
    dark_ink, light_ink = "#1A1A17", "#F0EFE8"
    bg_lum = relative_luminance(bg_hex)
    contrast_dark = (bg_lum + 0.05) / (relative_luminance(dark_ink) + 0.05)
    contrast_light = (relative_luminance(light_ink) + 0.05) / (bg_lum + 0.05)
    return dark_ink if contrast_dark >= contrast_light else light_ink


# Distinct, hierarchy-safe node ids (avoids label collisions between siblings,
# e.g. two departments both running a "Support" line item); "labels" stays
# display-only text, decoupled from the id used for parent lookups. Departments
# are independent roots (parent "") rather than children of one synthetic
# "Budget" node - Plotly's static export always renders a breadcrumb strip for
# a single unifying root (a kaleido quirk that ignores pathbar.visible=False),
# so per-department roots keep the canvas free of that stray element.
ids = unique_cats_ordered + [f"{cat}/{sub}" for cat, sub in zip(categories, subcategories, strict=True)]
labels = unique_cats_ordered + subcategories
parents = [""] * len(unique_cats_ordered) + categories
treemap_values = [category_totals[cat] for cat in unique_cats_ordered] + values

# Category color assignment (Imprint, canonical order)
category_color = dict(zip(unique_cats_ordered, IMPRINT, strict=True))

# Subcategory shading intensity: within each category, the largest cost center
# keeps the full hue, smaller ones lighten toward the page background - a
# second, color-based encoding of magnitude layered on top of rectangle area.
category_value_range = {
    cat: (min(vals := [v for c, v in zip(categories, values, strict=True) if c == cat]), max(vals))
    for cat in unique_cats_ordered
}

colors = [category_color[cat] for cat in unique_cats_ordered]
for cat, val in zip(categories, values, strict=True):
    lo, hi = category_value_range[cat]
    share = 1.0 if hi == lo else (val - lo) / (hi - lo)
    colors.append(lighten(category_color[cat], 0.55 - 0.4 * share))

# Precomputed display text
text = [f"<b>{cat}</b><br>${category_totals[cat]:,}K" for cat in unique_cats_ordered]
text += [f"{sub}<br>${val:,}K" for sub, val in zip(subcategories, values, strict=True)]

# Depth-aware label sizes reinforce the hierarchy: category headers read first,
# cost-center labels follow at a smaller, secondary size.
textsizes = [24] * len(unique_cats_ordered) + [16] * len(subcategories)

# Depth-aware text color: department headers sit on full-saturation base hues,
# where the theme's INK always contrasts well, so they keep INK. Subcategory
# tiles get lightened by a variable amount to encode magnitude, so a fixed INK
# would wash out on the palest tiles in dark theme - pick each leaf's text
# color from its own resulting tile lightness instead.
textcolors = [INK] * len(unique_cats_ordered) + [best_text_color(c) for c in colors[len(unique_cats_ordered) :]]

# Create treemap
fig = go.Figure(
    go.Treemap(
        ids=ids,
        labels=labels,
        parents=parents,
        values=treemap_values,
        branchvalues="total",
        text=text,
        textinfo="text",
        textposition="middle center",
        textfont={"size": textsizes, "color": textcolors},
        marker={
            "colors": colors,
            "line": {"width": 2, "color": PAGE_BG},
            "cornerradius": 6,
            "pad": {"t": 22, "l": 4, "r": 4, "b": 4},
        },
        hovertemplate=(
            "<b>%{label}</b><br>Budget: $%{value:,.0f}K<br>Share of department: %{percentParent:.1%}<extra></extra>"
        ),
    )
)

# Layout with theme-adaptive styling
fig.update_layout(
    autosize=False,
    title={
        "text": "treemap-basic · python · plotly · anyplot.ai",
        "font": {"size": 20, "color": INK},
        "x": 0.5,
        "xanchor": "center",
    },
    margin={"t": 45, "l": 20, "r": 20, "b": 20},
    paper_bgcolor=PAGE_BG,
    plot_bgcolor=PAGE_BG,
    font={"color": INK_SOFT, "size": 14},
)

# Save
# Hard target: 3200 x 1800 (landscape). See prompts/library/plotly.md "Canvas".
fig.write_image(f"plot-{THEME}.png", width=800, height=450, scale=4)
fig.write_html(f"plot-{THEME}.html", include_plotlyjs="cdn")
Runnable source as JSON, for any HTTP client: https://api.anyplot.ai/specs/treemap-basic/plotly/code. Any spec id and library id listed in llms-full.txt fit the same URL shape; every URL below is complete and callable.
{
  "spec_id": "treemap-basic",
  "language": "python",
  "library": "plotly",
  "page": "https://anyplot.ai/treemap-basic/python/plotly",
  "hub": "https://anyplot.ai/treemap-basic",
  "code_json": "https://api.anyplot.ai/specs/treemap-basic/plotly/code",
  "spec_json": "https://api.anyplot.ai/specs/treemap-basic",
  "render_light_png": "https://storage.googleapis.com/anyplot-images/plots/treemap-basic/python/plotly/plot-light.png",
  "render_dark_png": "https://storage.googleapis.com/anyplot-images/plots/treemap-basic/python/plotly/plot-dark.png",
  "interactive_light_html": "https://storage.googleapis.com/anyplot-images/plots/treemap-basic/python/plotly/plot-light.html",
  "interactive_dark_html": "https://storage.googleapis.com/anyplot-images/plots/treemap-basic/python/plotly/plot-dark.html",
  "quality_score": 95.0,
  "license": "MIT",
  "guide": "https://anyplot.ai/llms.txt"
}
Part of Basic Treemap on anyplot.ai.