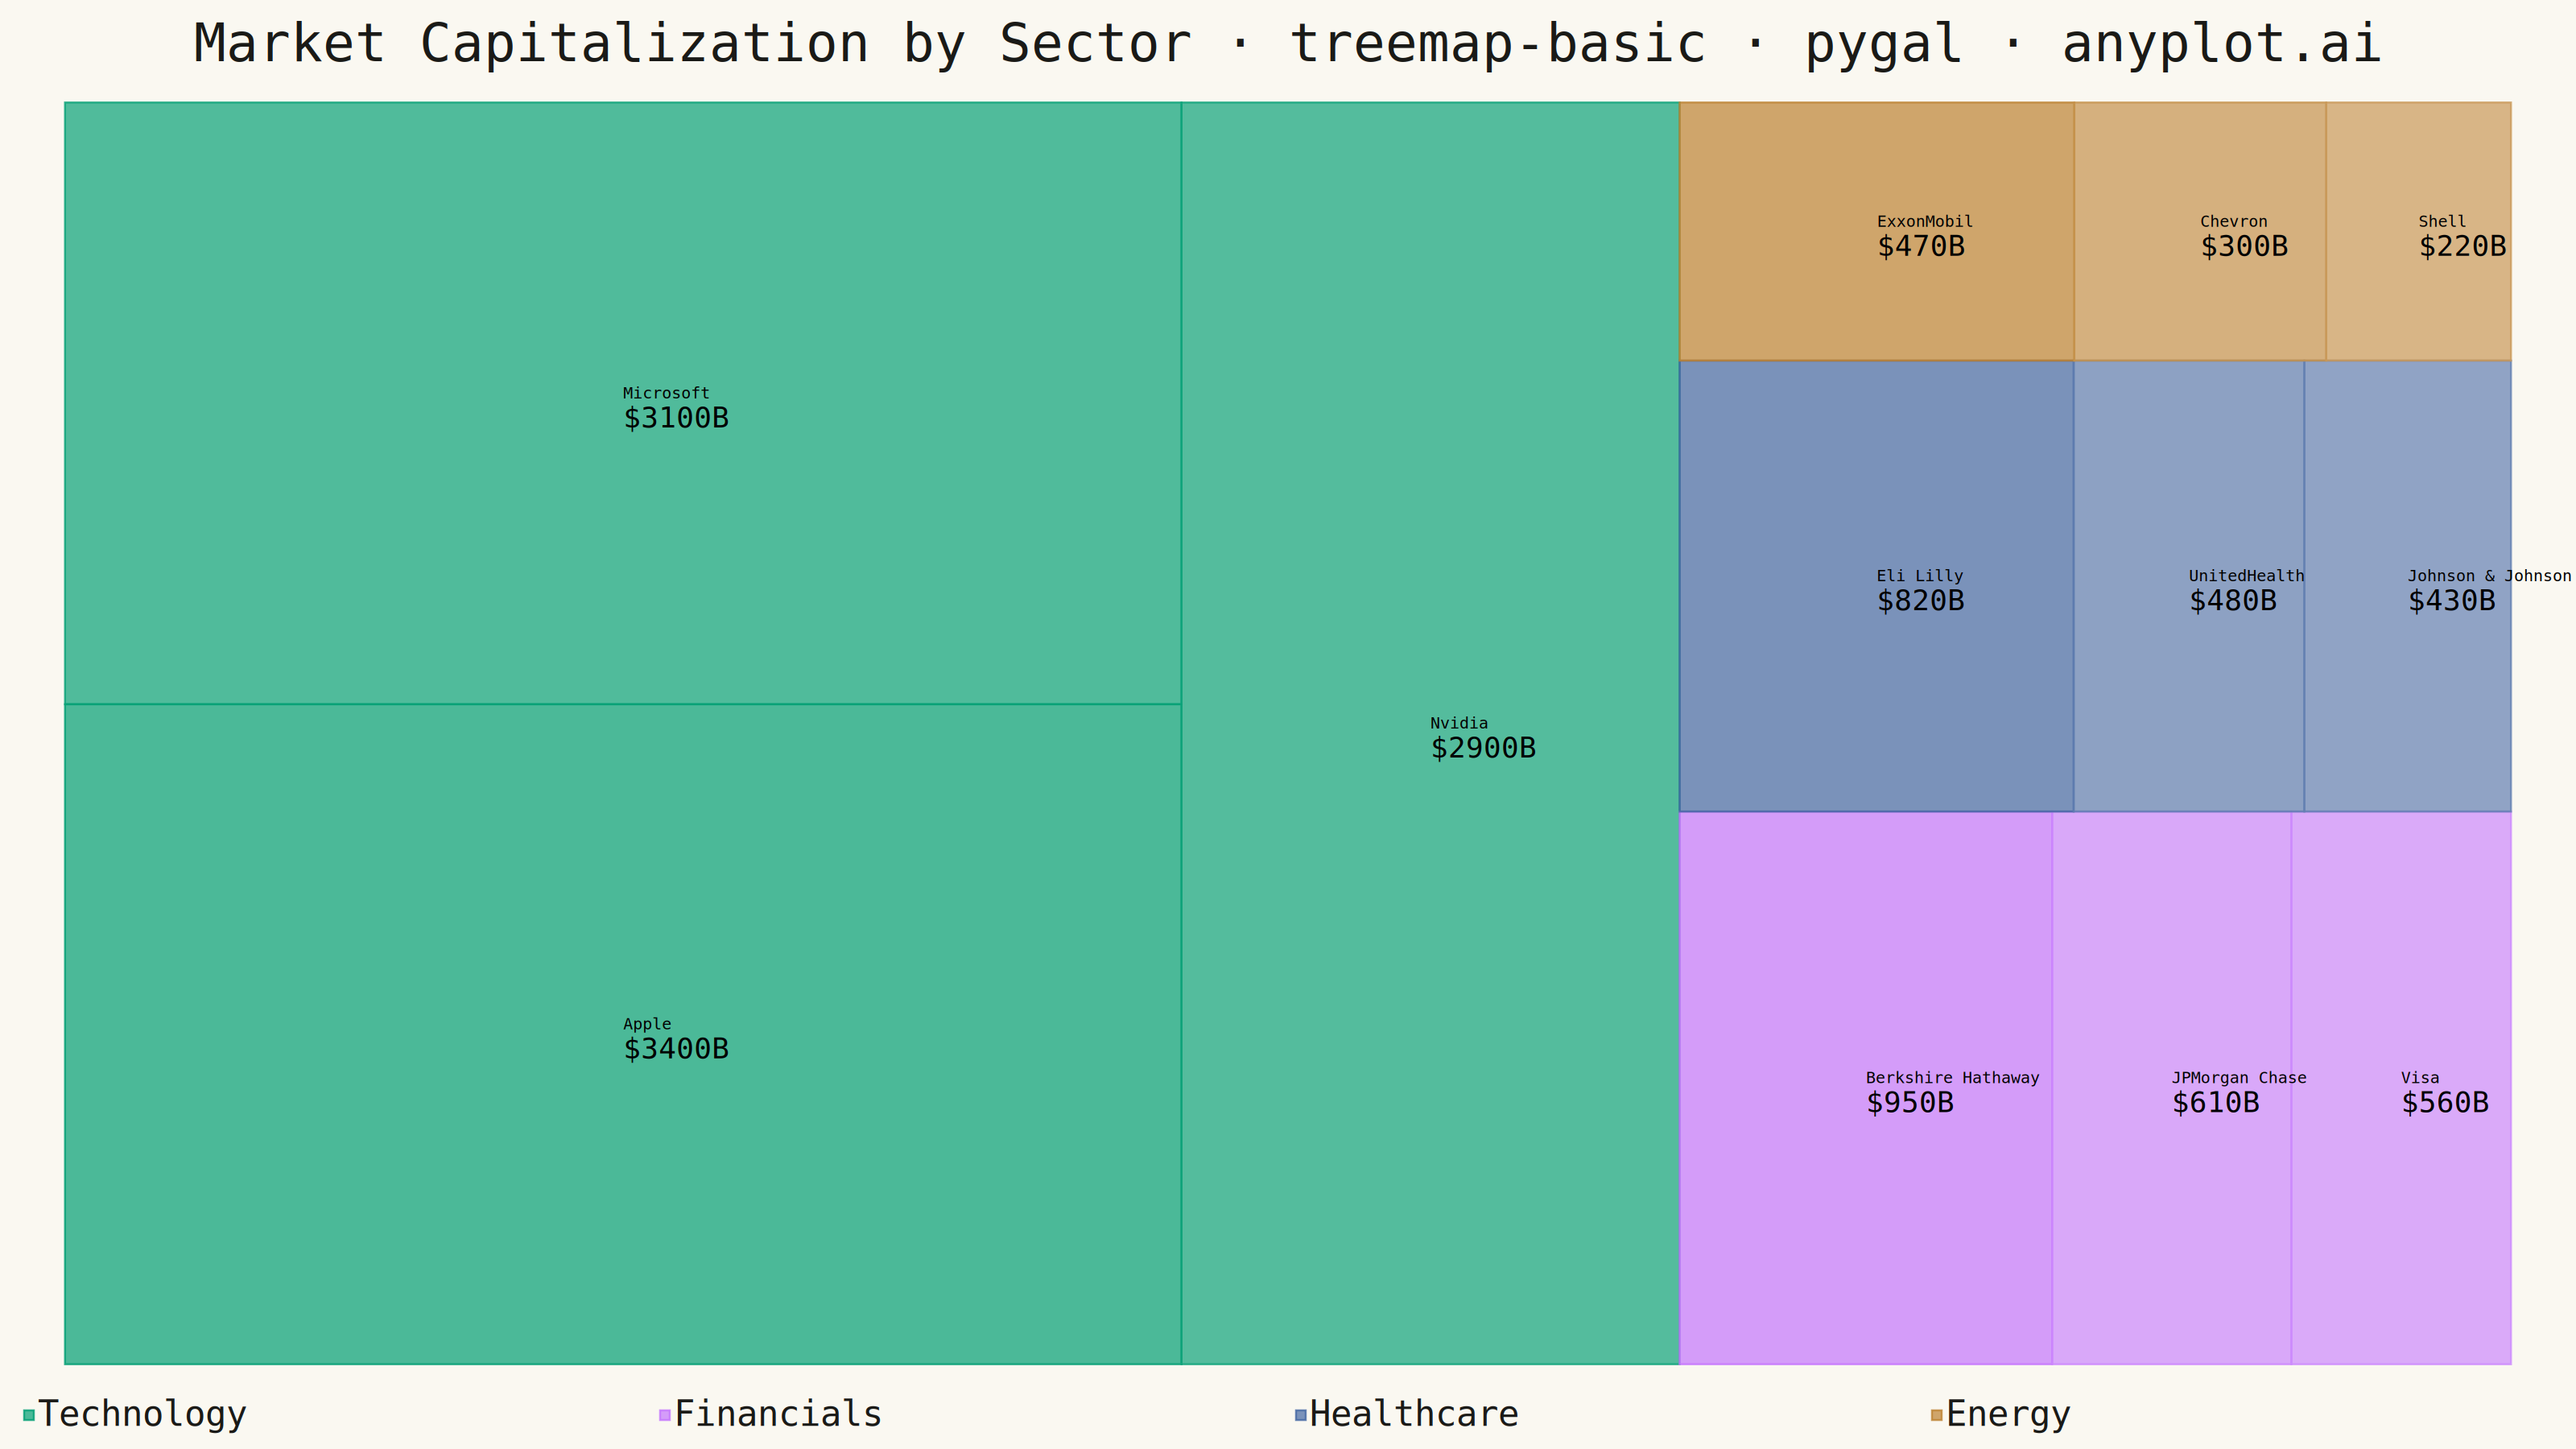
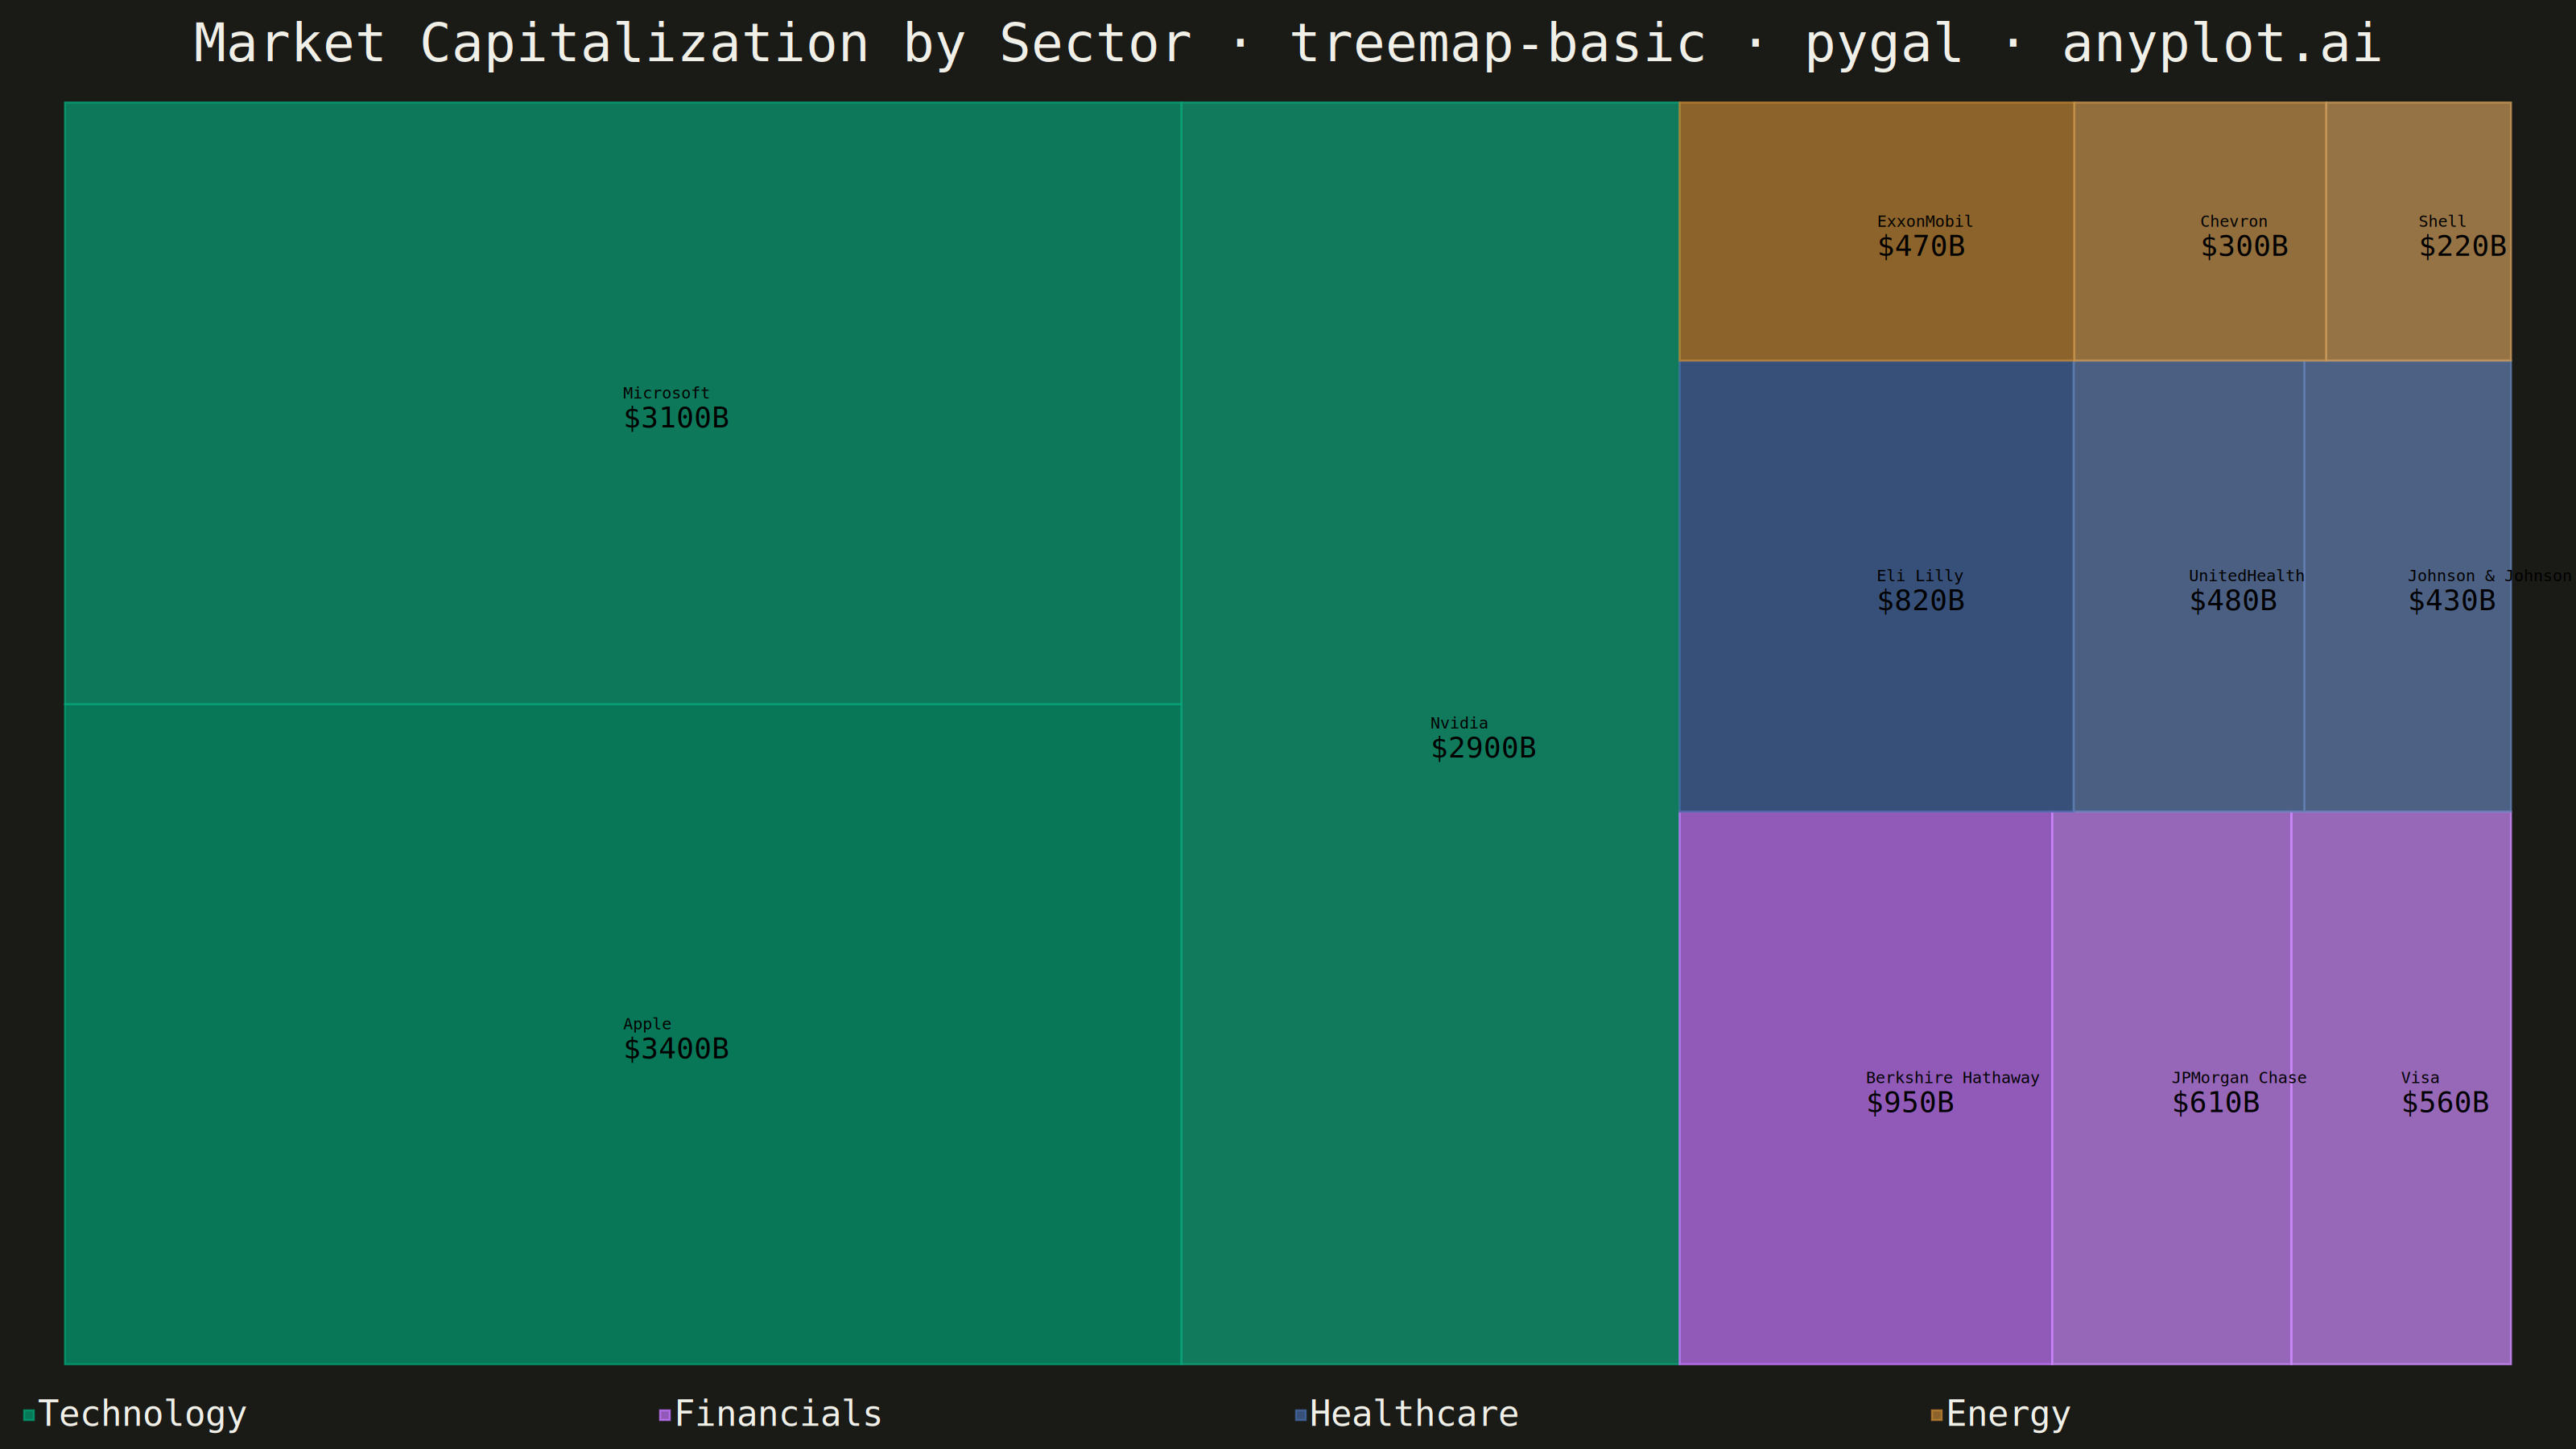
A treemap displaying hierarchical data as nested rectangles, where each rectangle's area is proportional to its value. This visualization excels at showing part-to-whole relationships in hierarchical structures, making it easy to spot large and small items at a glance. Treemaps efficiently use screen space to display large amounts of hierarchical data in a compact form.
""" anyplot.ai
treemap-basic: Basic Treemap
Library: pygal 3.1.3 | Python 3.13.14
Quality: 93/100 | Updated: 2026-08-04
"""

import os

import pygal
from pygal.style import Style


# Theme tokens
THEME = os.getenv("ANYPLOT_THEME", "light")
PAGE_BG = "#FAF8F1" if THEME == "light" else "#1A1A17"
INK = "#1A1A17" if THEME == "light" else "#F0EFE8"
INK_MUTED = "#6B6A63" if THEME == "light" else "#A8A79F"

# Imprint palette (first series always brand green)
IMPRINT = ("#009E73", "#C475FD", "#4467A3", "#BD8233", "#AE3030", "#2ABCCD", "#954477")

# Data - Market capitalization by sector and company (in $B)
data = {
    "Technology": [
        {"value": 3400, "label": "Apple"},
        {"value": 3100, "label": "Microsoft"},
        {"value": 2900, "label": "Nvidia"},
    ],
    "Financials": [
        {"value": 950, "label": "Berkshire Hathaway"},
        {"value": 610, "label": "JPMorgan Chase"},
        {"value": 560, "label": "Visa"},
    ],
    "Healthcare": [
        {"value": 820, "label": "Eli Lilly"},
        {"value": 480, "label": "UnitedHealth"},
        {"value": 430, "label": "Johnson & Johnson"},
    ],
    "Energy": [
        {"value": 470, "label": "ExxonMobil"},
        {"value": 300, "label": "Chevron"},
        {"value": 220, "label": "Shell"},
    ],
}


def _lighten(hex_color, t):
    """Blend hex_color toward white by fraction t (theme-independent)."""
    r, g, b = (int(hex_color[i : i + 2], 16) for i in (1, 3, 5))
    return "#{:02X}{:02X}{:02X}".format(*(int(round(c + (255 - c) * t)) for c in (r, g, b)))


# Value-proportional shading within each sector: the largest company keeps
# the full sector color, smaller ones lighten toward white, reinforcing the
# size hierarchy beyond flat category coloring (spec calls for "nesting
# depth or color shading intensity"). Applied identically in both themes so
# data colors stay theme-independent.
for sector_index, items in enumerate(data.values()):
    sector_color = IMPRINT[sector_index]
    max_value = max(item["value"] for item in items)
    for item in items:
        item["color"] = _lighten(sector_color, 0.35 * (1 - item["value"] / max_value))

# Custom style for 3200x1800 px canvas with theme-adaptive colors
custom_style = Style(
    background=PAGE_BG,
    plot_background=PAGE_BG,
    foreground=INK,
    foreground_strong=INK,
    foreground_subtle=INK_MUTED,
    colors=IMPRINT,
    title_font_size=66,
    label_font_size=56,
    major_label_font_size=44,
    legend_font_size=44,
    value_font_size=36,
    # Treemap per-cell captions are CSS class text.label, styled by
    # value_label_font_size (not label_font_size, which only affects axis
    # text and has no effect on treemaps).
    value_label_font_size=20,
    stroke_width=2.5,
)

# Create treemap
chart = pygal.Treemap(
    width=3200,
    height=1800,
    style=custom_style,
    title="Market Capitalization by Sector · treemap-basic · pygal · anyplot.ai",
    legend_at_bottom=True,
    legend_at_bottom_columns=4,
    print_values=True,
    print_labels=True,
    value_formatter=lambda x: f"${x}B",
)

# Add data by sector
for sector, items in data.items():
    chart.add(sector, items)

# Save as PNG and HTML with theme suffix
chart.render_to_png(f"plot-{THEME}.png")
with open(f"plot-{THEME}.html", "wb") as f:
    f.write(chart.render())
Runnable source as JSON, for any HTTP client: https://api.anyplot.ai/specs/treemap-basic/pygal/code. Any spec id and library id listed in llms-full.txt fit the same URL shape; every URL below is complete and callable.
{
  "spec_id": "treemap-basic",
  "language": "python",
  "library": "pygal",
  "page": "https://anyplot.ai/treemap-basic/python/pygal",
  "hub": "https://anyplot.ai/treemap-basic",
  "code_json": "https://api.anyplot.ai/specs/treemap-basic/pygal/code",
  "spec_json": "https://api.anyplot.ai/specs/treemap-basic",
  "render_light_png": "https://storage.googleapis.com/anyplot-images/plots/treemap-basic/python/pygal/plot-light.png",
  "render_dark_png": "https://storage.googleapis.com/anyplot-images/plots/treemap-basic/python/pygal/plot-dark.png",
  "interactive_light_html": "https://storage.googleapis.com/anyplot-images/plots/treemap-basic/python/pygal/plot-light.html",
  "interactive_dark_html": "https://storage.googleapis.com/anyplot-images/plots/treemap-basic/python/pygal/plot-dark.html",
  "quality_score": 93.0,
  "license": "MIT",
  "guide": "https://anyplot.ai/llms.txt"
}
Part of Basic Treemap on anyplot.ai.