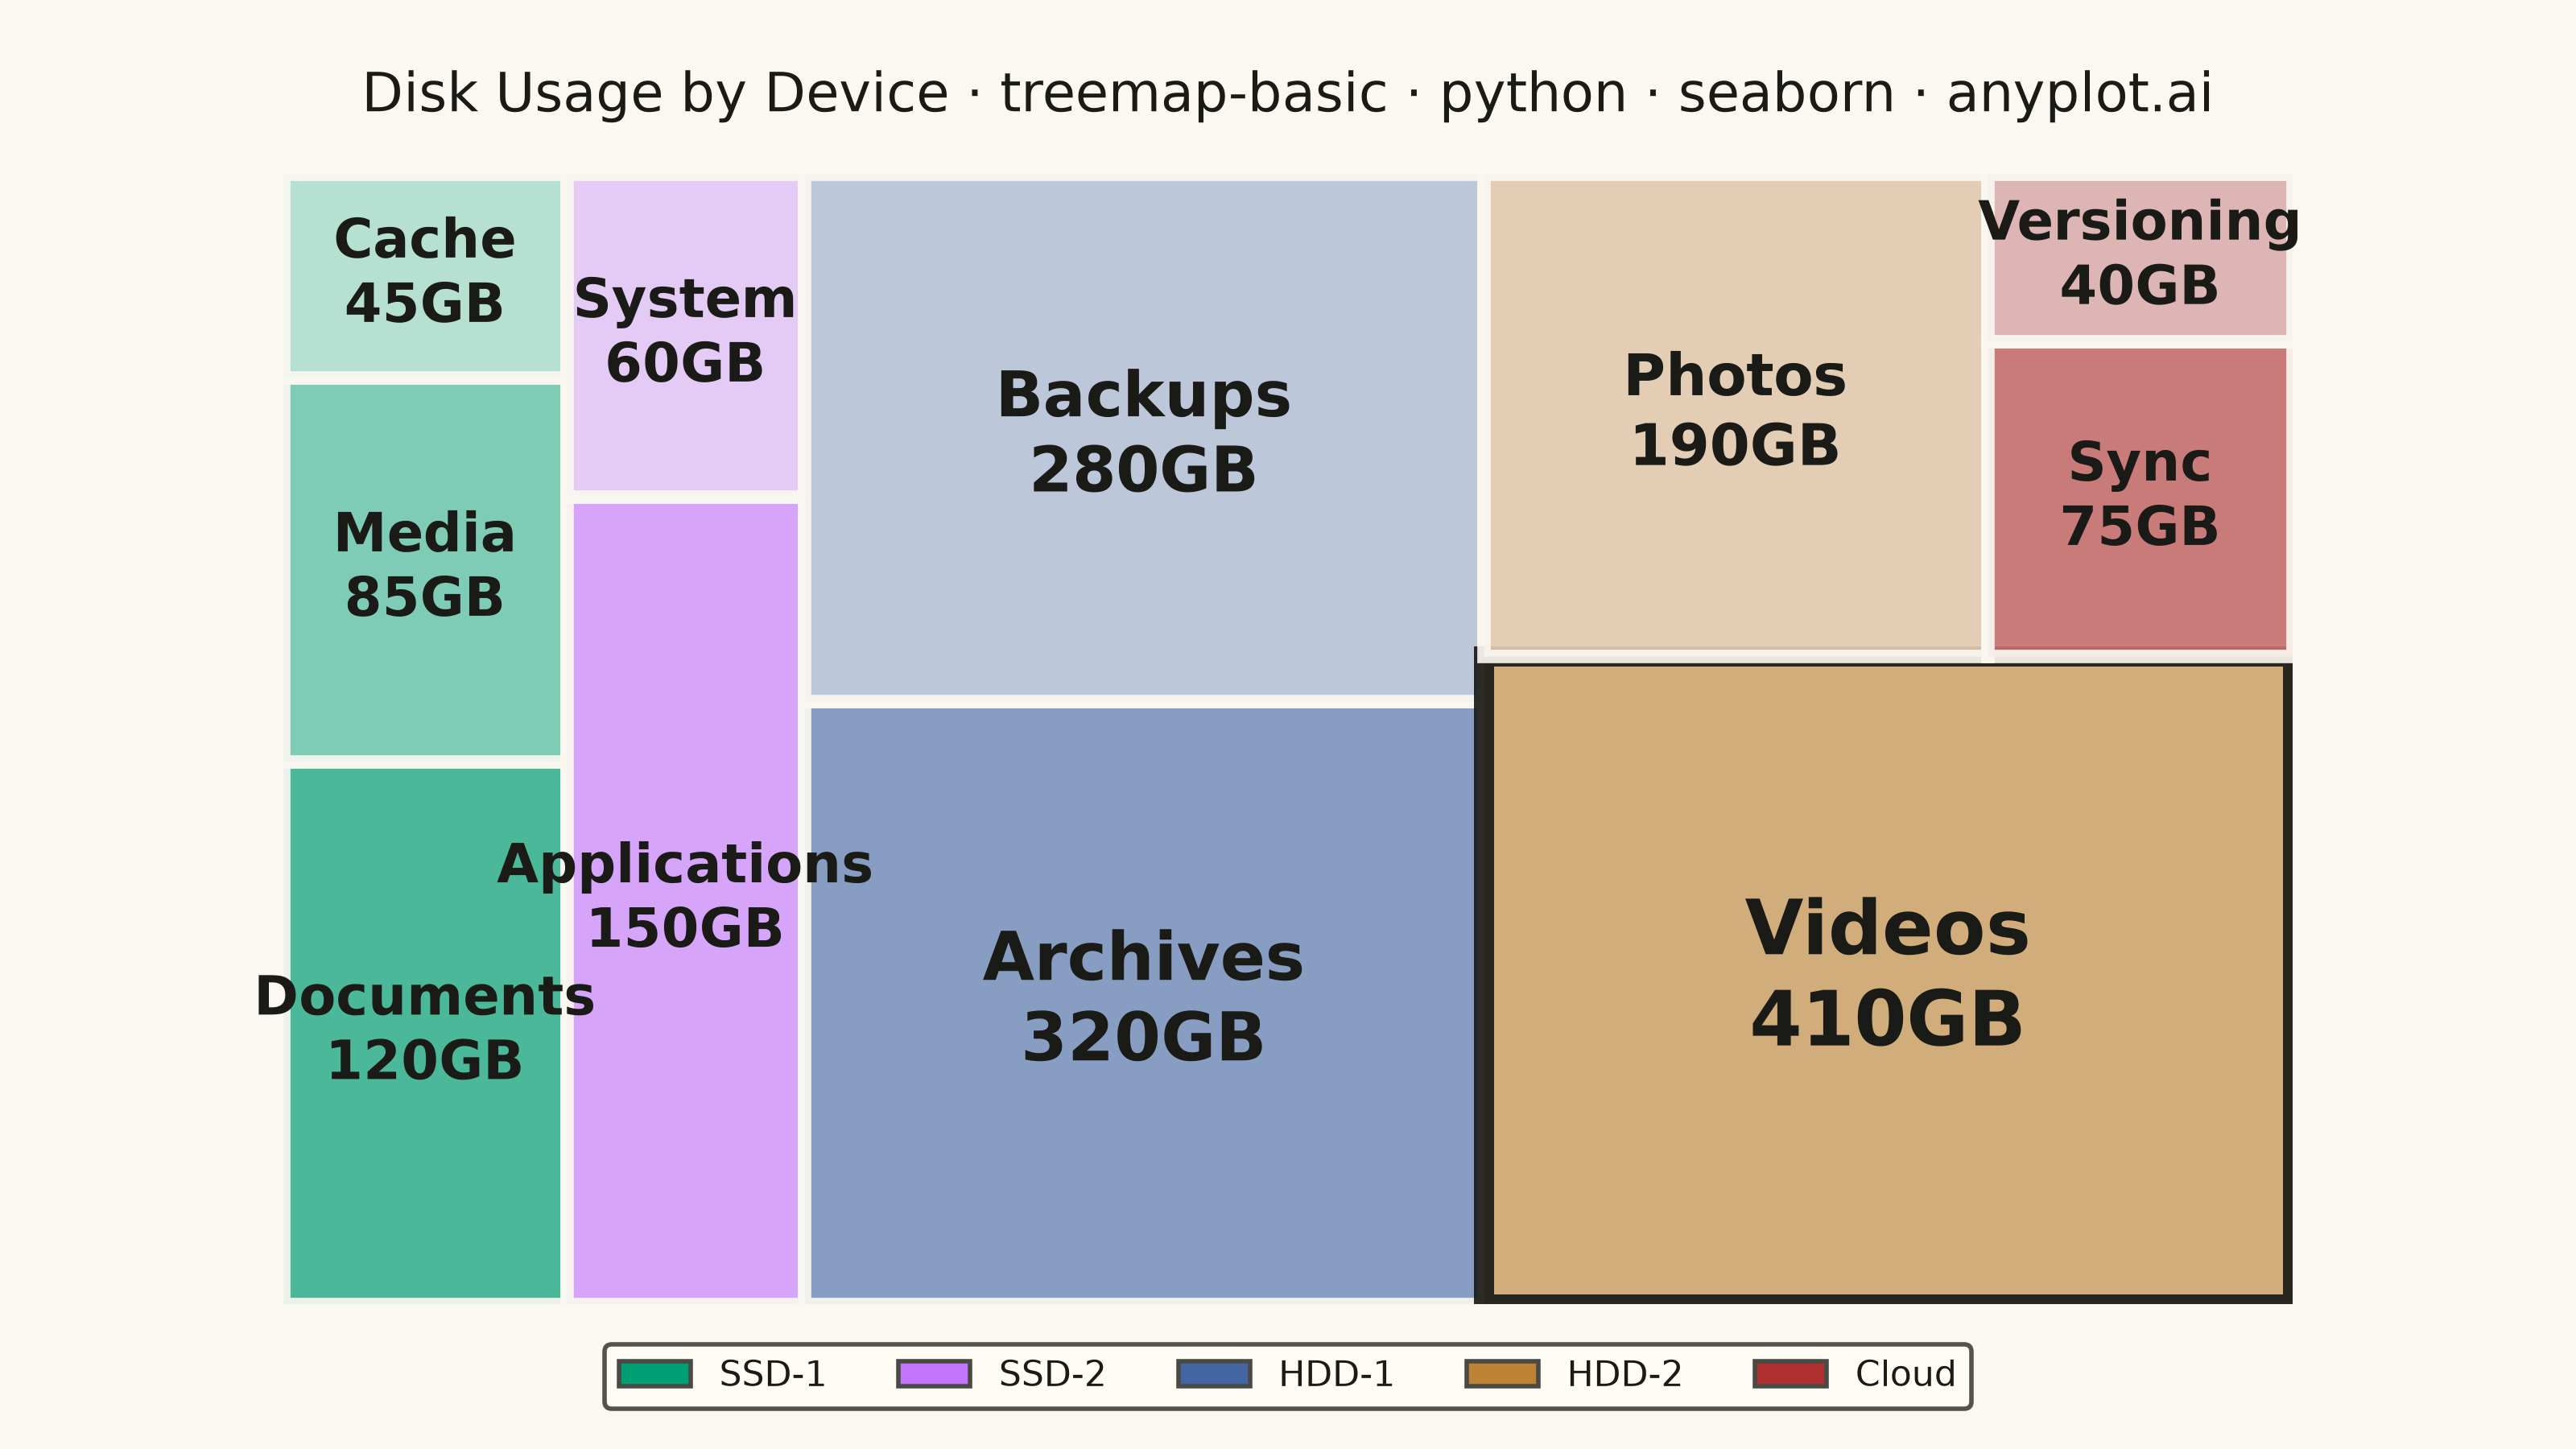
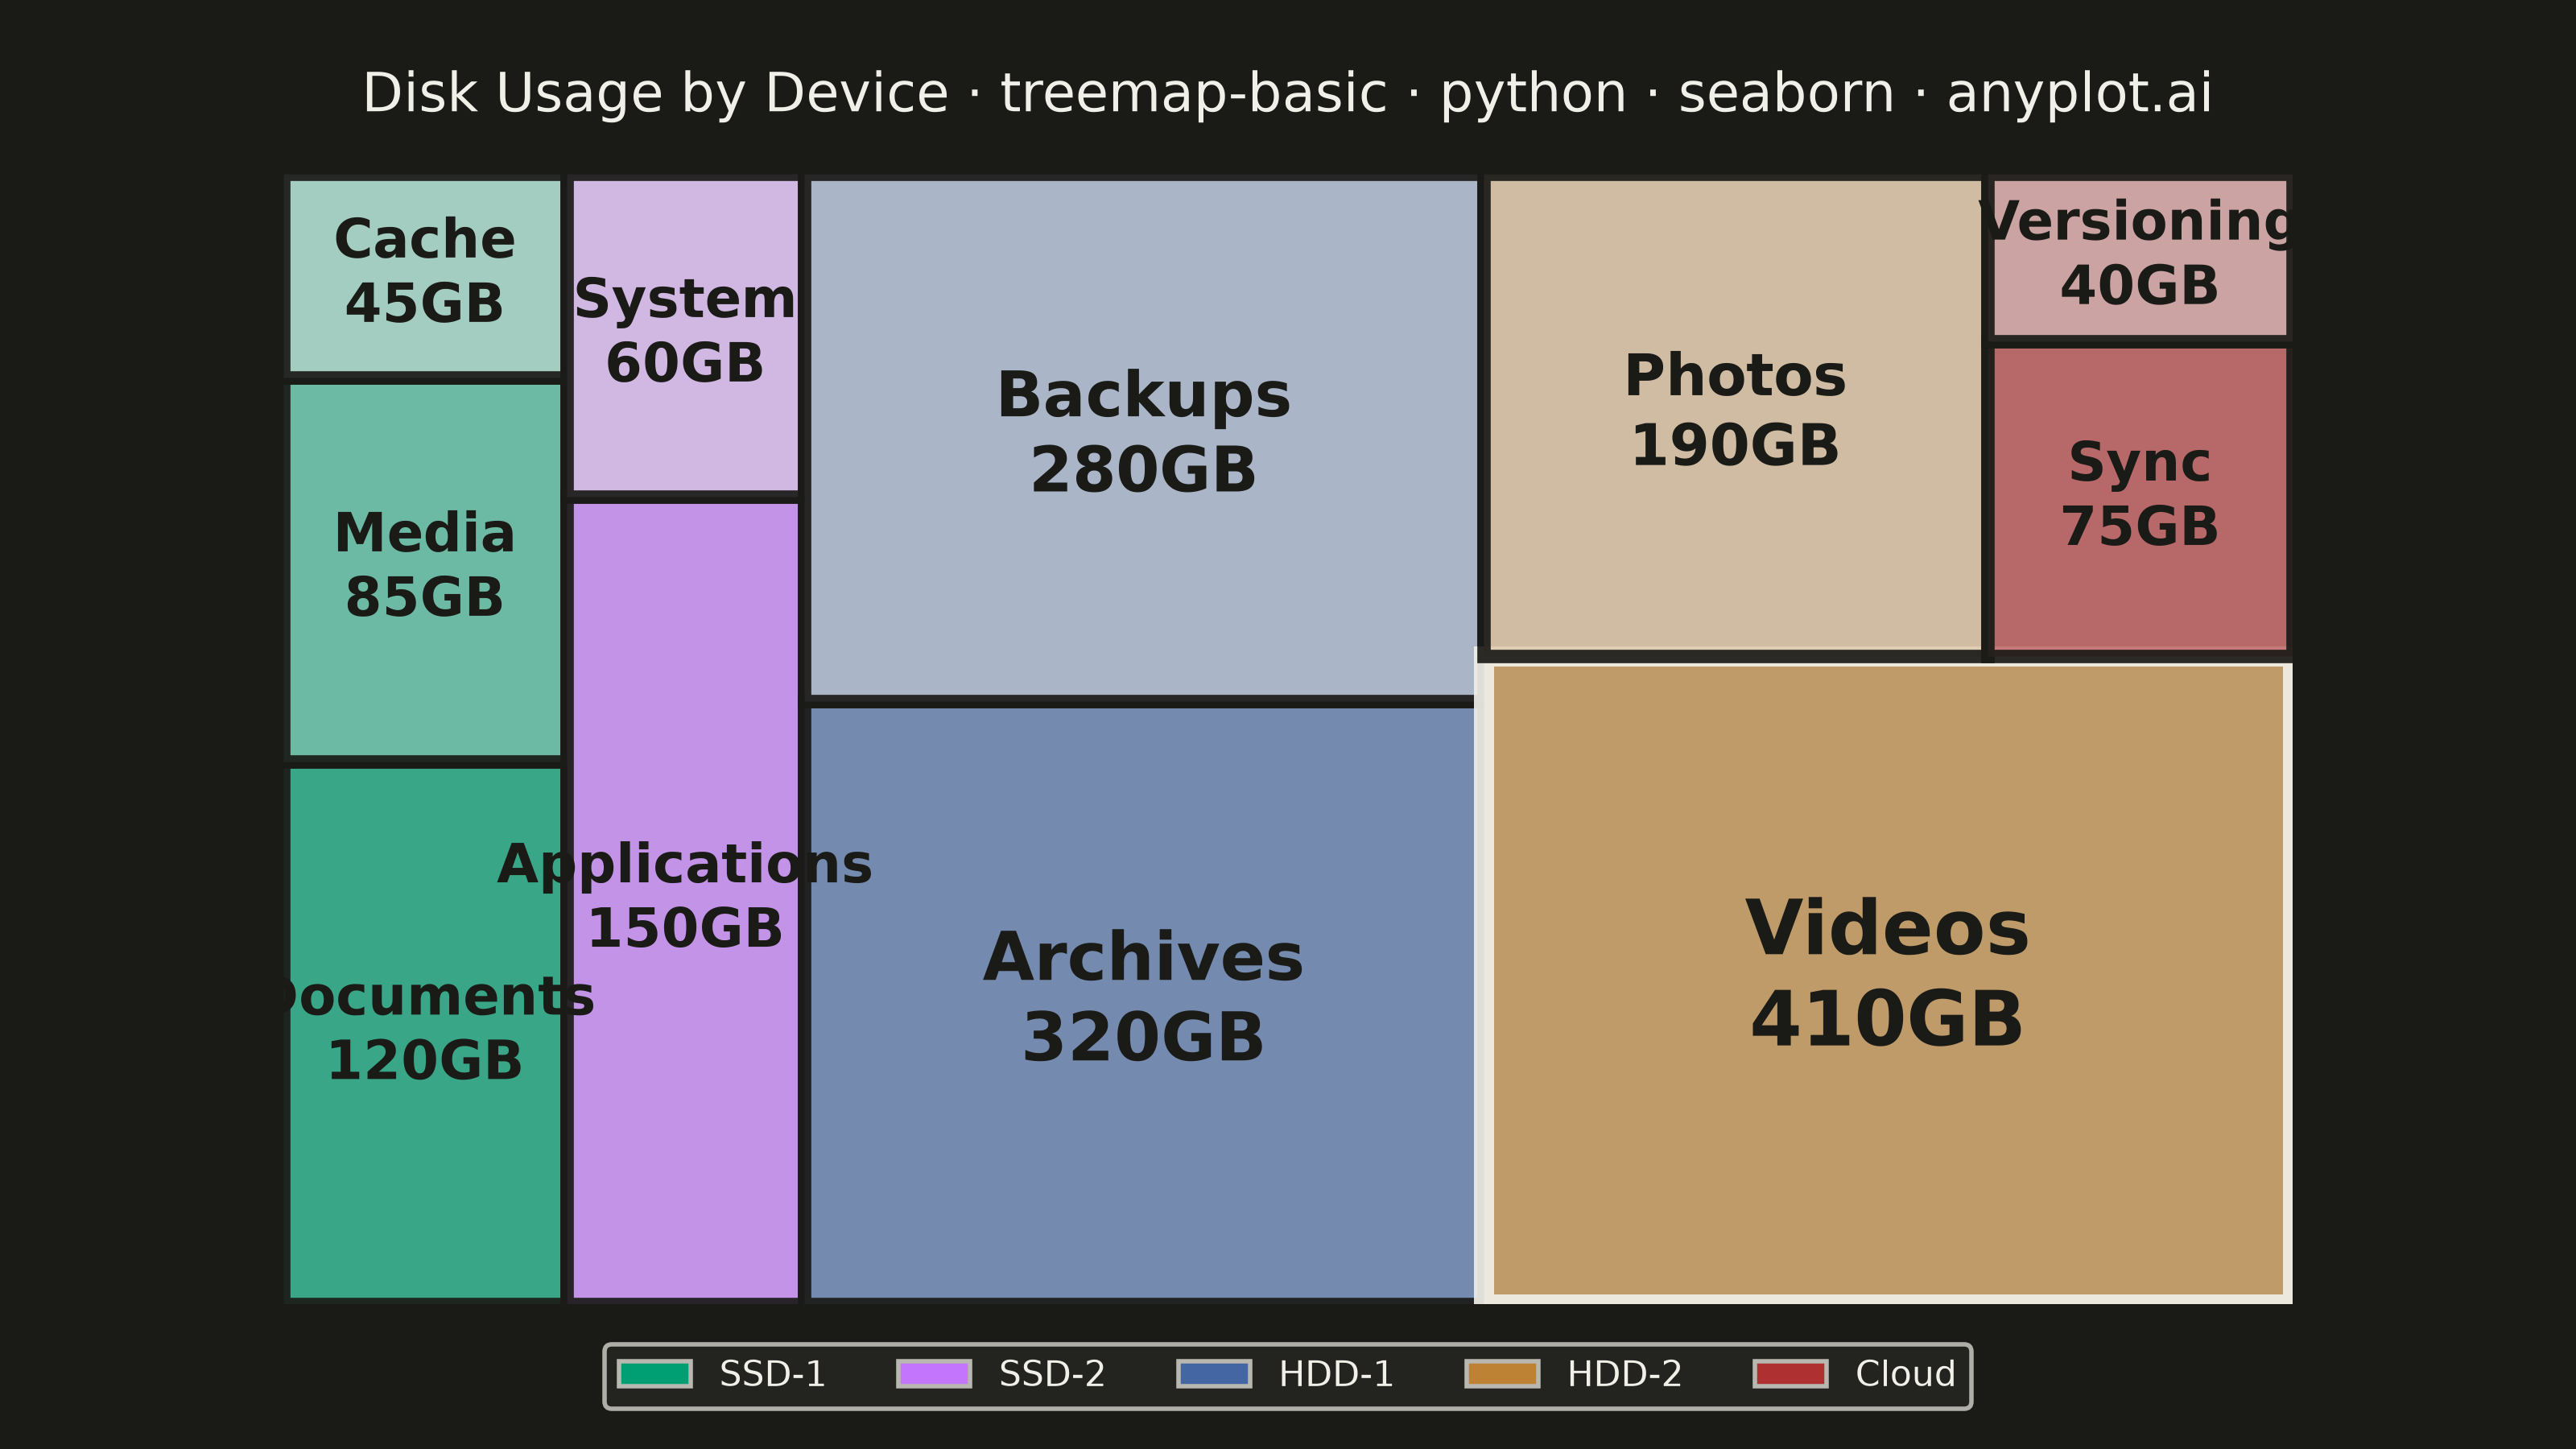
A treemap displaying hierarchical data as nested rectangles, where each rectangle's area is proportional to its value. This visualization excels at showing part-to-whole relationships in hierarchical structures, making it easy to spot large and small items at a glance. Treemaps efficiently use screen space to display large amounts of hierarchical data in a compact form.
""" anyplot.ai
treemap-basic: Basic Treemap
Library: seaborn 0.13.2 | Python 3.13.14
Quality: 85/100 | Updated: 2026-08-04
"""

import os

import matplotlib.pyplot as plt
import numpy as np
import seaborn as sns
import squarify
from matplotlib.patches import Patch, Rectangle


np.random.seed(42)

THEME = os.getenv("ANYPLOT_THEME", "light")
PAGE_BG = "#FAF8F1" if THEME == "light" else "#1A1A17"
ELEVATED_BG = "#FFFDF6" if THEME == "light" else "#242420"
INK = "#1A1A17" if THEME == "light" else "#F0EFE8"
INK_SOFT = "#4A4A44" if THEME == "light" else "#B8B7B0"

sns.set_theme(
    style="ticks",
    rc={
        "figure.facecolor": PAGE_BG,
        "axes.facecolor": PAGE_BG,
        "text.color": INK,
        "legend.facecolor": ELEVATED_BG,
        "legend.edgecolor": INK_SOFT,
    },
)

# Imprint palette — canonical order, first series always #009E73
IMPRINT = ["#009E73", "#C475FD", "#4467A3", "#BD8233", "#AE3030", "#2ABCCD", "#954477"]

# Data - Disk usage by storage device and data type (GB)
data = [
    ("SSD-1", "Documents", 120),
    ("SSD-1", "Media", 85),
    ("SSD-1", "Cache", 45),
    ("SSD-2", "Applications", 150),
    ("SSD-2", "System", 60),
    ("HDD-1", "Archives", 320),
    ("HDD-1", "Backups", 280),
    ("HDD-2", "Videos", 410),
    ("HDD-2", "Photos", 190),
    ("Cloud", "Sync", 75),
    ("Cloud", "Versioning", 40),
]

categories = [d[0] for d in data]
subcategories = [d[1] for d in data]
values = [d[2] for d in data]

unique_categories = ["SSD-1", "SSD-2", "HDD-1", "HDD-2", "Cloud"]
category_colors = dict(zip(unique_categories, IMPRINT, strict=False))

width, height = 160, 90

rects = squarify.normalize_sizes(values, width, height)
rects = squarify.squarify(rects, 0, 0, width, height)

fig, ax = plt.subplots(figsize=(8, 4.5), dpi=400, facecolor=PAGE_BG)
ax.set_facecolor(PAGE_BG)

category_counts = {}
category_indices = {}
for i, cat in enumerate(categories):
    if cat not in category_counts:
        category_counts[cat] = 0
        category_indices[cat] = []
    category_indices[cat].append(i)
    category_counts[cat] += 1

# The single largest rectangle by area anchors the visual hierarchy — the reader's
# eye should land there first, so it gets a bolder outline than the rest.
largest_idx = max(range(len(rects)), key=lambda i: rects[i]["dx"] * rects[i]["dy"])

for i, rect in enumerate(rects):
    cat = categories[i]
    base_color = category_colors[cat]

    cat_items = category_indices[cat]
    rank_in_category = cat_items.index(i)
    num_in_category = len(cat_items)

    shades = sns.light_palette(base_color, n_colors=num_in_category + 2, reverse=True)
    shade_color = shades[rank_in_category + 1]

    is_largest = i == largest_idx
    rectangle = Rectangle(
        (rect["x"], rect["y"]),
        rect["dx"],
        rect["dy"],
        facecolor=shade_color,
        edgecolor=INK if is_largest else PAGE_BG,
        linewidth=4.5 if is_largest else 3,
        alpha=0.92,
    )
    ax.add_patch(rectangle)

    area = rect["dx"] * rect["dy"]
    if area > 150:
        r_val, g_val, b_val = shade_color[:3]
        luminance = 0.299 * r_val + 0.587 * g_val + 0.114 * b_val
        text_color = "#1A1A17" if luminance > 0.5 else "#FFFFFF"
        fontsize = min(18, max(12, int(area**0.35)))

        label = f"{subcategories[i]}\n{values[i]}GB"
        ax.text(
            rect["x"] + rect["dx"] / 2,
            rect["y"] + rect["dy"] / 2,
            label,
            ha="center",
            va="center",
            fontsize=fontsize,
            fontweight="bold",
            color=text_color,
        )

ax.set_xlim(0, width)
ax.set_ylim(0, height)
ax.axis("off")
ax.set_aspect("equal")

title = "Disk Usage by Device · treemap-basic · python · seaborn · anyplot.ai"
title_fontsize = max(8, round(12 * min(1.0, 67 / len(title))))
ax.set_title(title, fontsize=title_fontsize, fontweight="medium", color=INK, pad=14)

legend_handles = [Patch(facecolor=category_colors[cat], label=cat, edgecolor=INK_SOFT) for cat in unique_categories]
ax.legend(
    handles=legend_handles,
    loc="upper center",
    fontsize=8,
    framealpha=0.95,
    facecolor=ELEVATED_BG,
    edgecolor=INK_SOFT,
    ncol=5,
    bbox_to_anchor=(0.5, -0.02),
)

fig.subplots_adjust(left=0.02, right=0.98, top=0.88, bottom=0.1)
plt.savefig(f"plot-{THEME}.png", dpi=400, facecolor=PAGE_BG)
Runnable source as JSON, for any HTTP client: https://api.anyplot.ai/specs/treemap-basic/seaborn/code. Any spec id and library id listed in llms-full.txt fit the same URL shape; every URL below is complete and callable.
{
  "spec_id": "treemap-basic",
  "language": "python",
  "library": "seaborn",
  "page": "https://anyplot.ai/treemap-basic/python/seaborn",
  "hub": "https://anyplot.ai/treemap-basic",
  "code_json": "https://api.anyplot.ai/specs/treemap-basic/seaborn/code",
  "spec_json": "https://api.anyplot.ai/specs/treemap-basic",
  "render_light_png": "https://storage.googleapis.com/anyplot-images/plots/treemap-basic/python/seaborn/plot-light.png",
  "render_dark_png": "https://storage.googleapis.com/anyplot-images/plots/treemap-basic/python/seaborn/plot-dark.png",
  "quality_score": 85.0,
  "license": "MIT",
  "guide": "https://anyplot.ai/llms.txt"
}
Part of Basic Treemap on anyplot.ai.