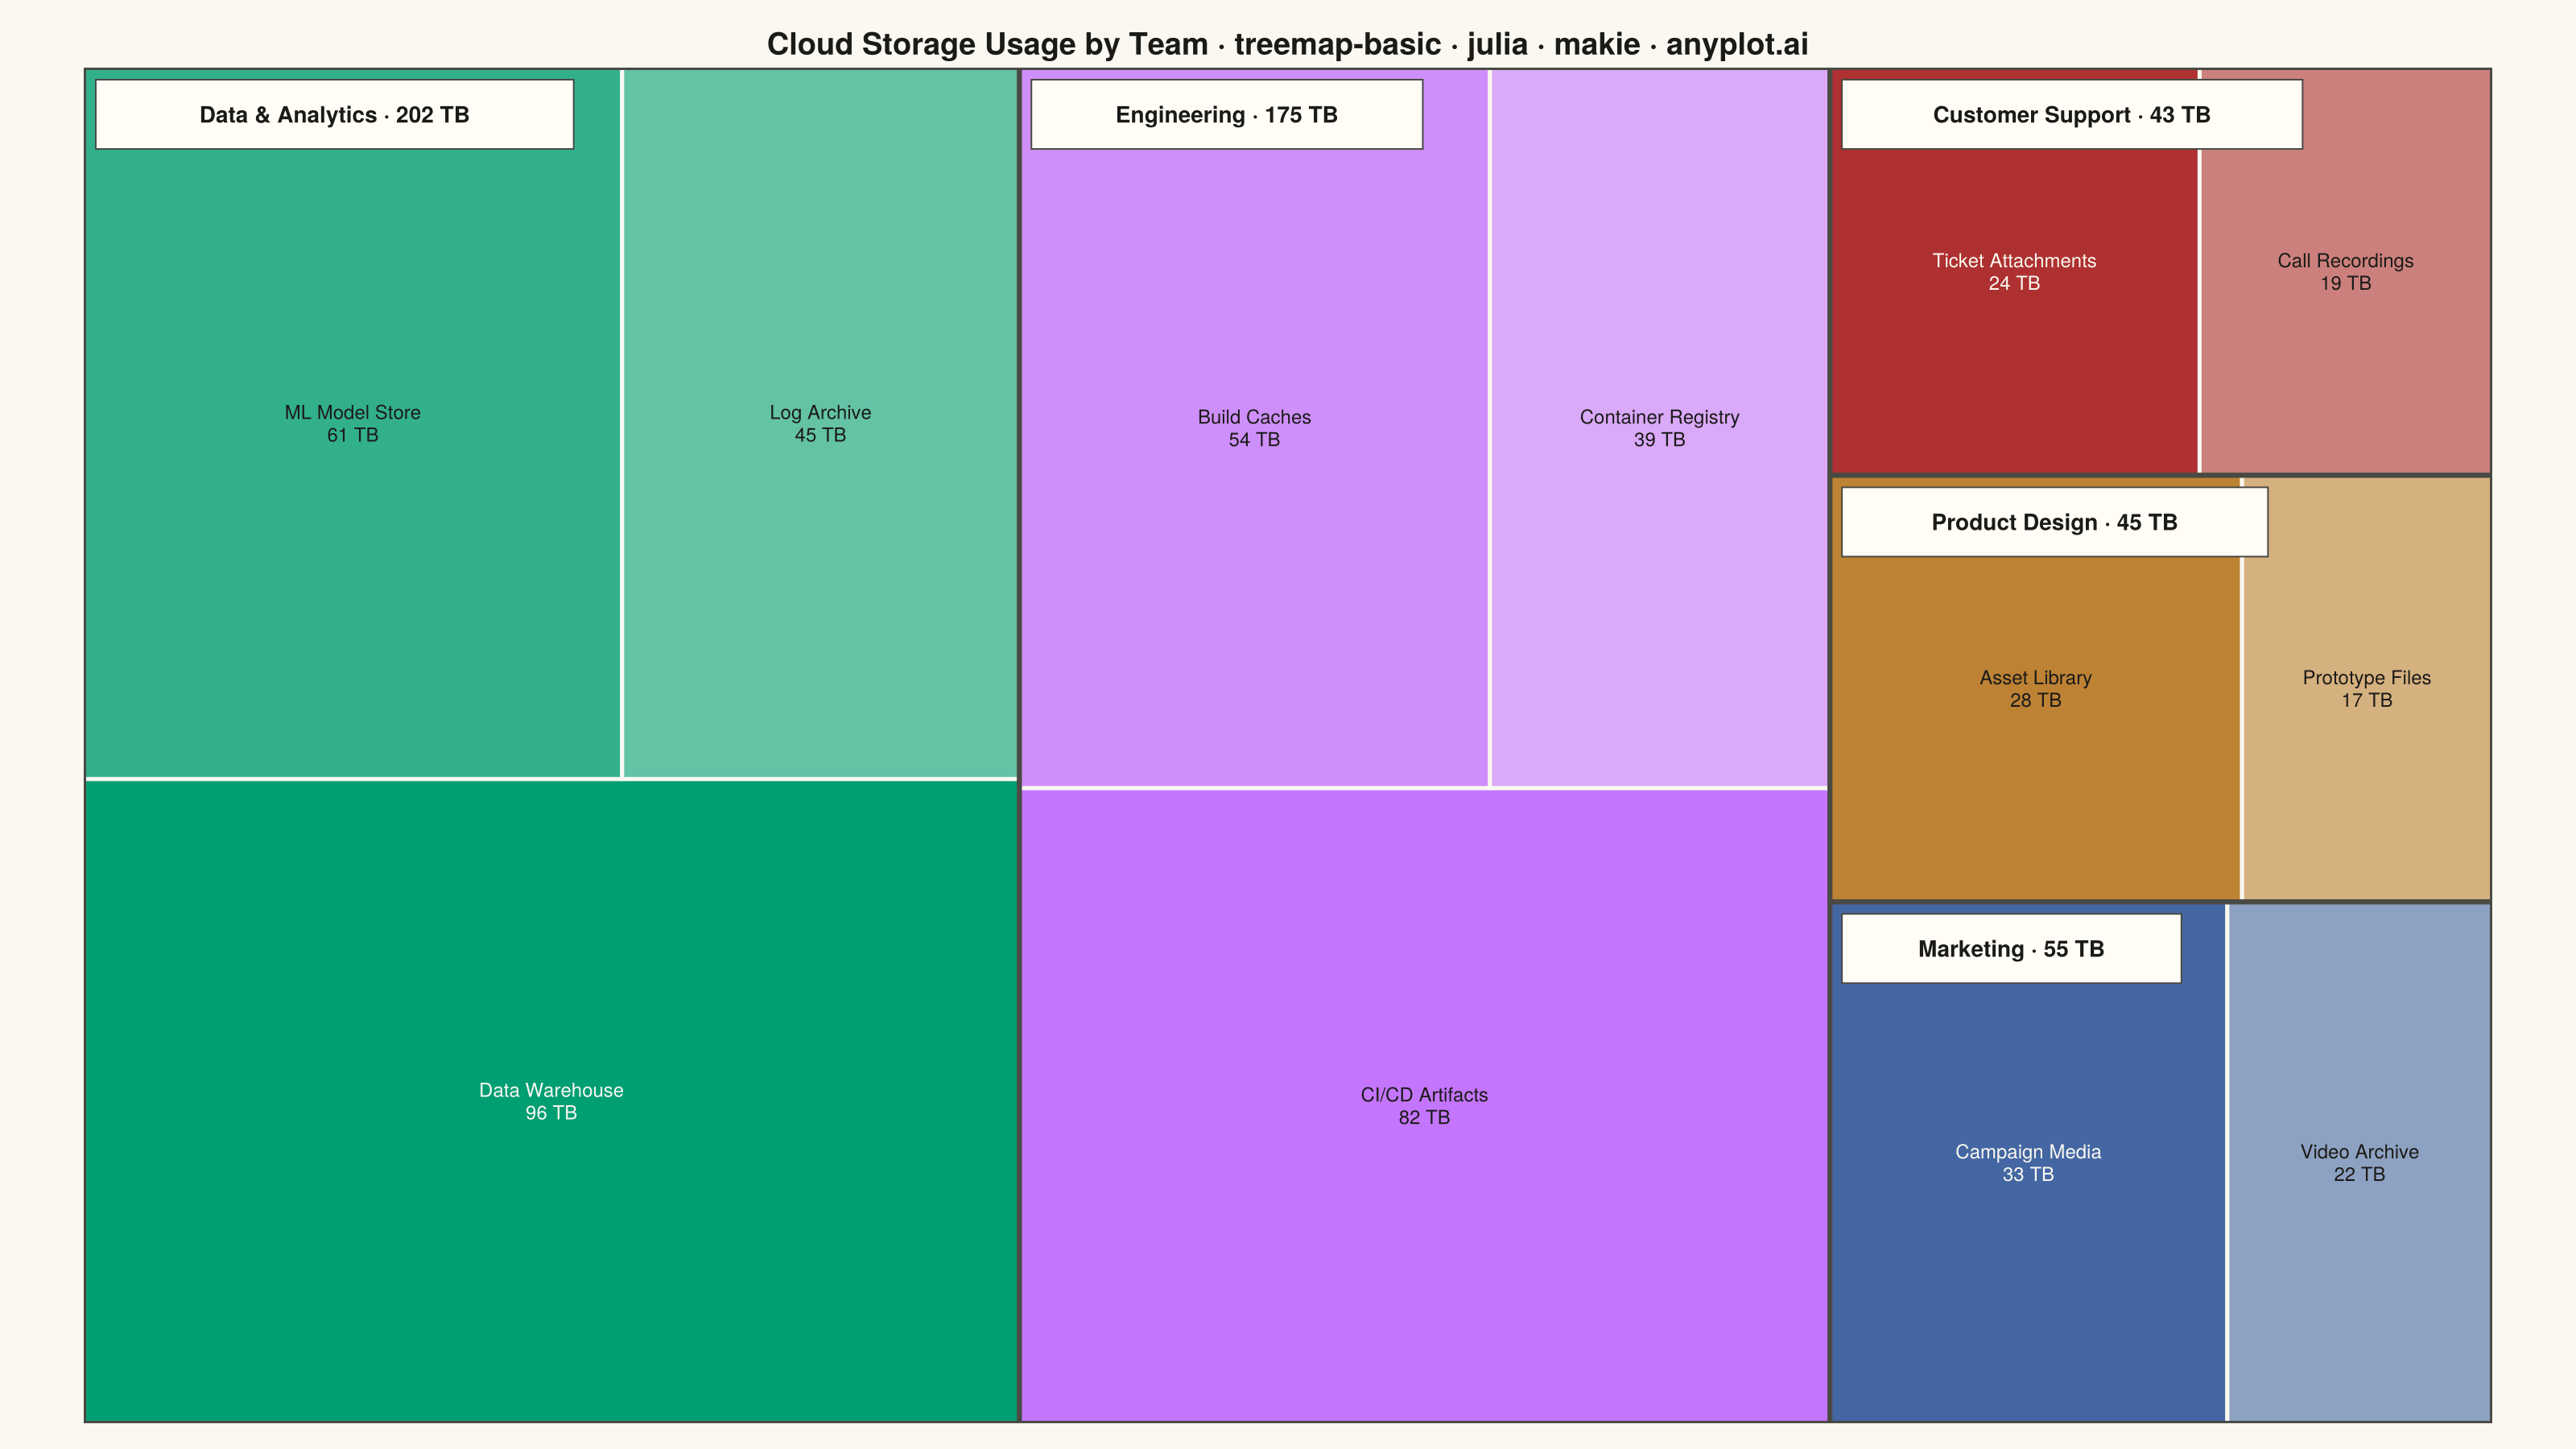
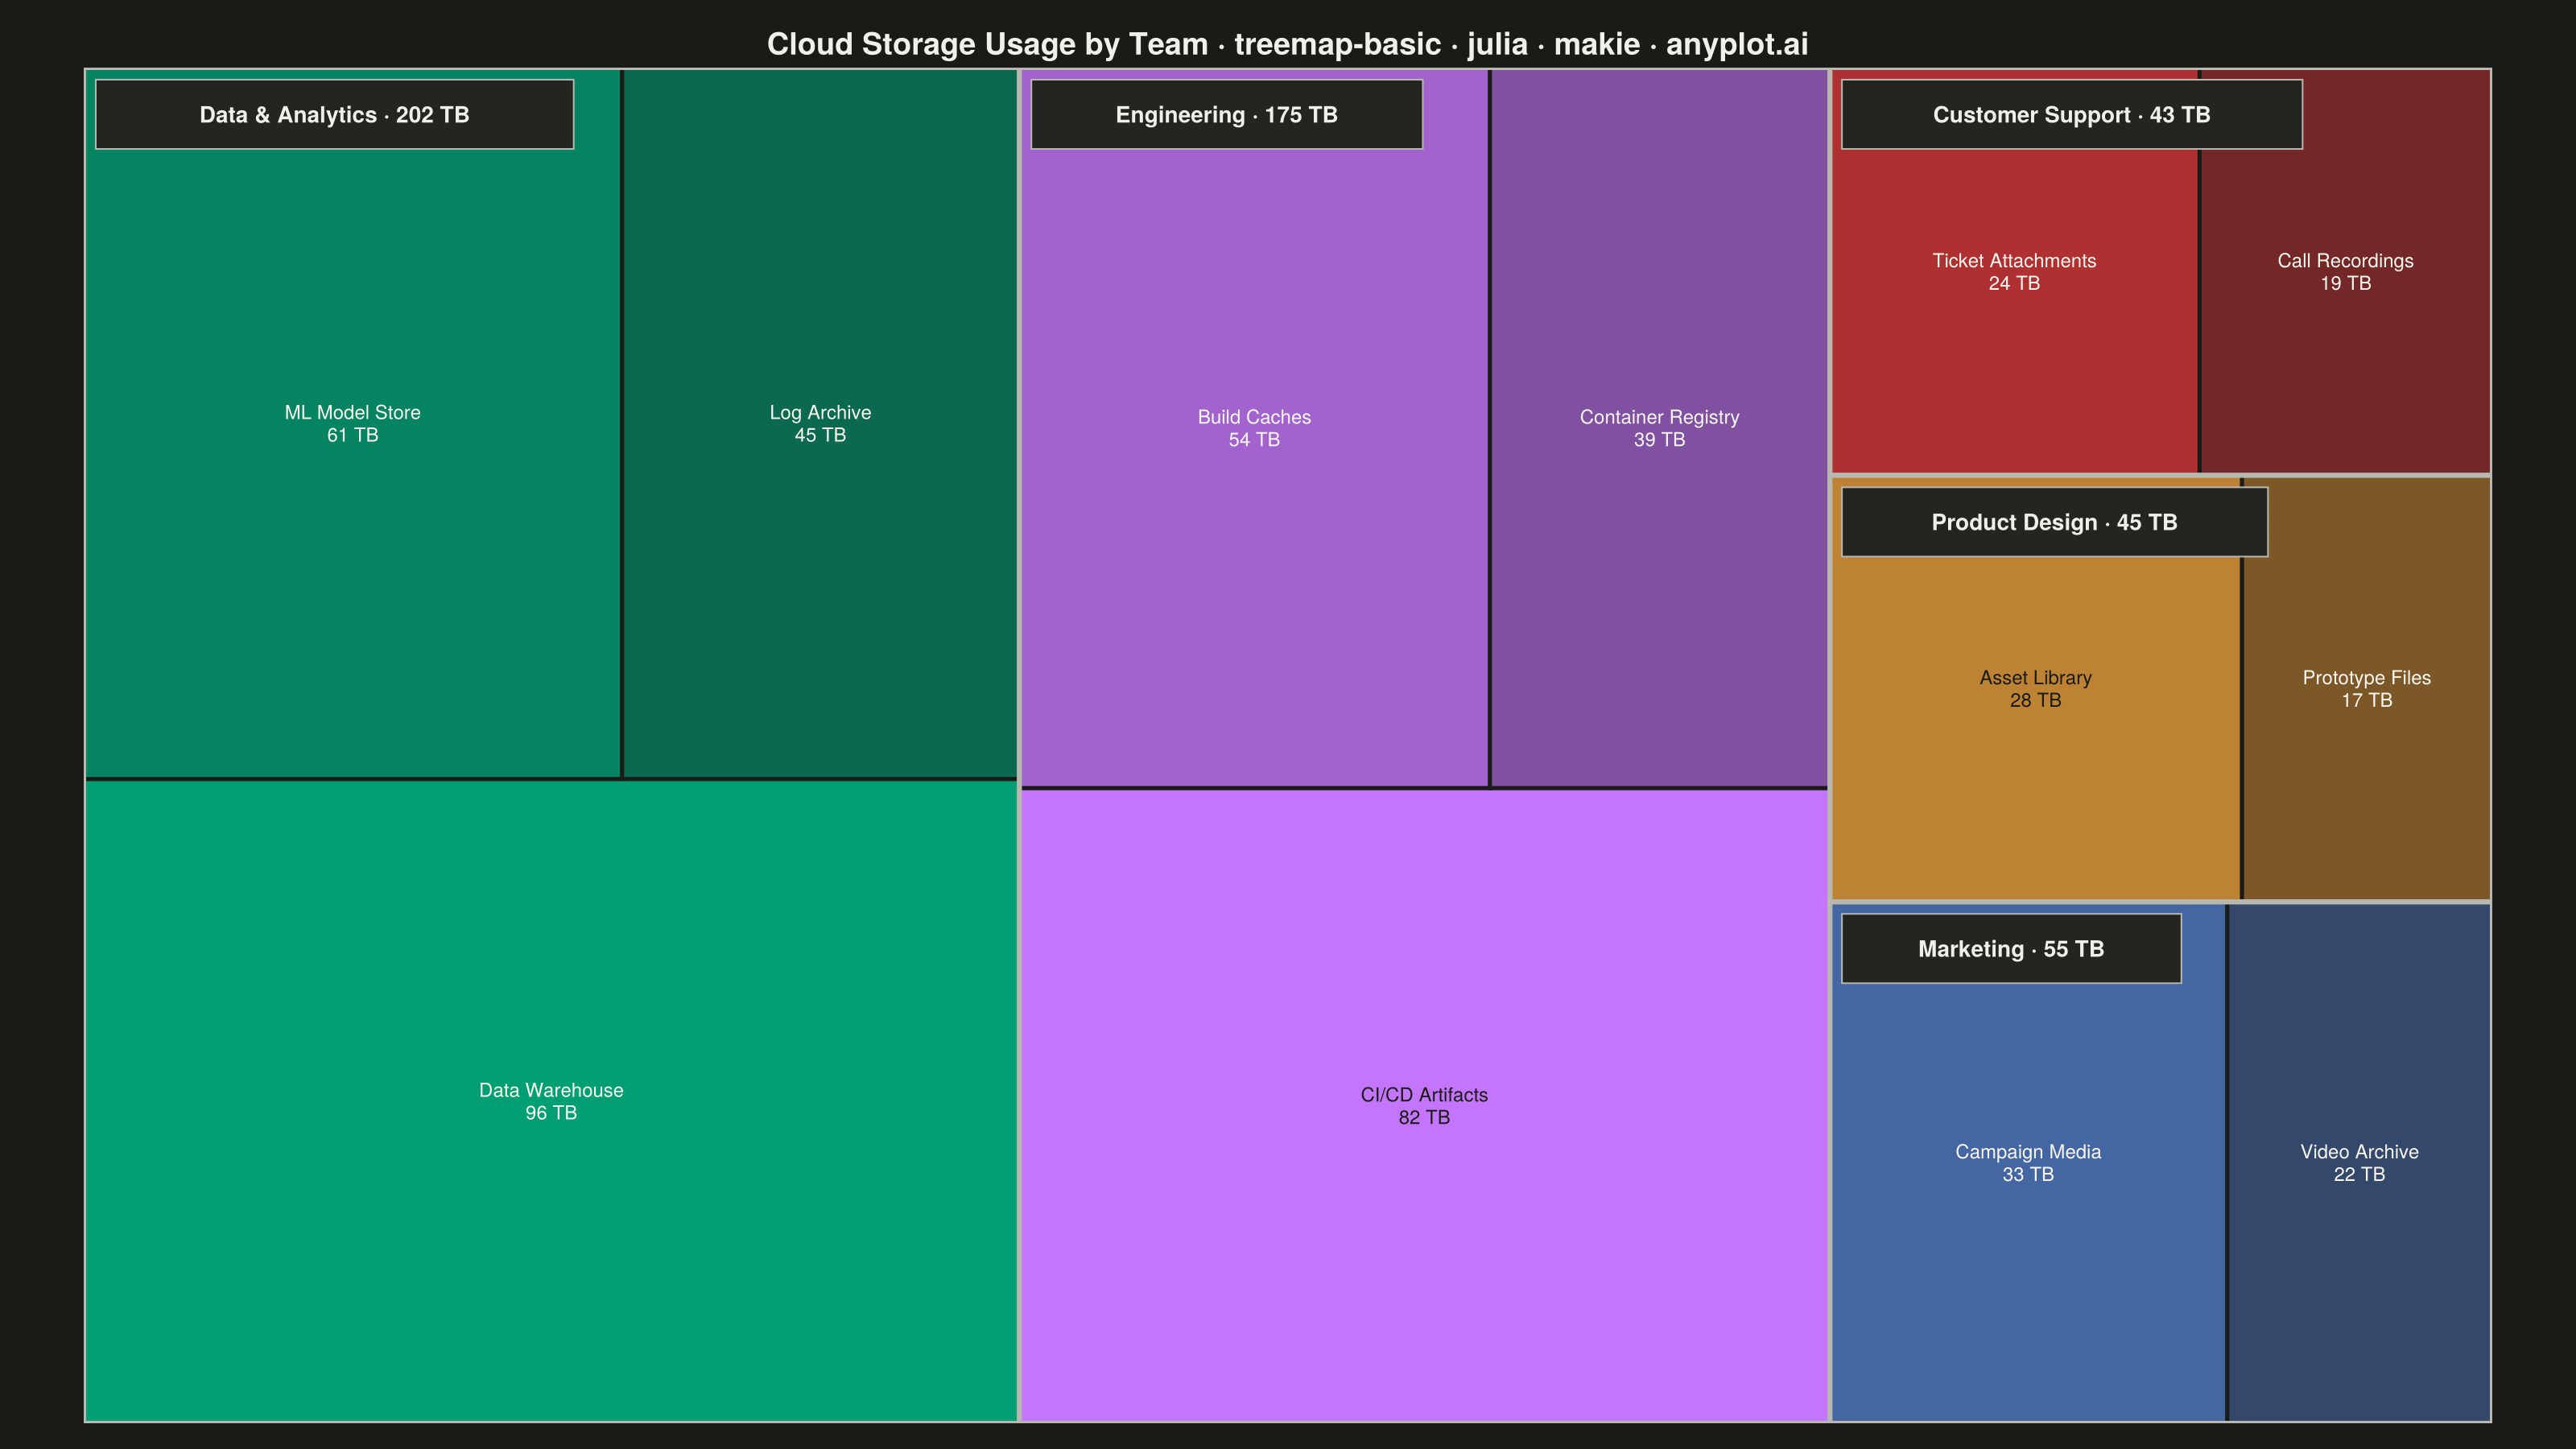
A treemap displaying hierarchical data as nested rectangles, where each rectangle's area is proportional to its value. This visualization excels at showing part-to-whole relationships in hierarchical structures, making it easy to spot large and small items at a glance. Treemaps efficiently use screen space to display large amounts of hierarchical data in a compact form.
# anyplot.ai
# treemap-basic: Basic Treemap
# Library: makie 0.21.9 | Julia 1.11.9
# Quality: 88/100 | Created: 2026-08-04

using CairoMakie
using Colors
using Random

Random.seed!(42)

# Theme tokens -----------------------------------------------------------------
const THEME    = get(ENV, "ANYPLOT_THEME", "light")
const PAGE_BG  = THEME == "light" ? colorant"#FAF8F1" : colorant"#1A1A17"
const ELEV_BG  = THEME == "light" ? colorant"#FFFDF6" : colorant"#242420"
const INK      = THEME == "light" ? colorant"#1A1A17" : colorant"#F0EFE8"
const INK_SOFT = THEME == "light" ? colorant"#4A4A44" : colorant"#B8B7B0"

const IMPRINT_PALETTE = [
    colorant"#009E73", colorant"#C475FD", colorant"#4467A3",
    colorant"#BD8233", colorant"#AE3030", colorant"#2ABCCD",
    colorant"#954477", colorant"#99B314",
]

# Squarified treemap layout (Bruls, Huizing & van Wijk, 2000). These are
# data-layout helpers only -- the plot itself stays top-level, top-down below.
function row_worst_ratio(row, side)
    s  = sum(row)
    mx = maximum(row)
    mn = minimum(row)
    max((side^2 * mx) / s^2, s^2 / (side^2 * mn))
end

function row_rects(row, x, y, w, h)
    s = sum(row)
    out = NTuple{4,Float64}[]
    if w >= h
        # Wide container: carve a vertical column (width = s/h, full height)
        # and stack items top-to-bottom inside it.
        col_w = s / h
        cy = y
        for v in row
            rh = v / col_w
            push!(out, (x, cy, col_w, rh))
            cy += rh
        end
    else
        # Tall container: carve a horizontal band (height = s/w, full width)
        # and lay items left-to-right inside it.
        row_h = s / w
        cx = x
        for v in row
            rw = v / row_h
            push!(out, (cx, y, rw, row_h))
            cx += rw
        end
    end
    out
end

function squarify(values, x, y, w, h)
    remaining = Float64.(values)
    rects = NTuple{4,Float64}[]
    row = Float64[]
    cx, cy, cw, ch = x, y, w, h
    while !isempty(remaining)
        side  = min(cw, ch)
        trial = vcat(row, remaining[1])
        if isempty(row) || row_worst_ratio(trial, side) <= row_worst_ratio(row, side)
            push!(row, popfirst!(remaining))
        else
            append!(rects, row_rects(row, cx, cy, cw, ch))
            s = sum(row)
            if cw >= ch
                col_w = s / ch
                cx += col_w
                cw -= col_w
            else
                row_h = s / cw
                cy += row_h
                ch -= row_h
            end
            row = Float64[]
        end
    end
    if !isempty(row)
        append!(rects, row_rects(row, cx, cy, cw, ch))
    end
    rects
end

# Label ink chosen per-tile by relative luminance of the fill -- keeps text
# legible whether the tile sits at full category saturation or a light tint.
function contrast_ink(c)
    0.2126 * red(c) + 0.7152 * green(c) + 0.0722 * blue(c) > 0.5 ?
        colorant"#1A1A17" : colorant"#FAF8F1"
end

# Intra-category rank tint via perceptually uniform LCHab lightness lift
# toward a fixed ceiling (never the theme background), so a given rank
# renders the identical color in both light and dark PNGs -- only the
# surrounding chrome is allowed to flip.
function tint_lightness(base::RGB, frac::Float64)
    lch      = convert(LCHab, base)
    target_l = min(lch.l + 32.0, 92.0)
    l        = lch.l + frac * (target_l - lch.l)
    convert(RGB, LCHab(l, lch.c, lch.h))
end

# Data ---------------------------------------------------------------------
# Cloud object-storage usage (TB) by owning team and application.
categories = [
    ("Engineering", [
        ("CI/CD Artifacts", 82.0), ("Build Caches", 54.0), ("Container Registry", 39.0),
    ]),
    ("Data & Analytics", [
        ("Data Warehouse", 96.0), ("ML Model Store", 61.0), ("Log Archive", 45.0),
    ]),
    ("Product Design", [
        ("Asset Library", 28.0), ("Prototype Files", 17.0),
    ]),
    ("Marketing", [
        ("Campaign Media", 33.0), ("Video Archive", 22.0),
    ]),
    ("Customer Support", [
        ("Ticket Attachments", 43.0),
    ]),
]

cat_totals = [sum(v for (_, v) in subs) for (_, subs) in categories]
order      = sortperm(cat_totals; rev = true)
categories = categories[order]
cat_totals = cat_totals[order]

# Layout ---------------------------------------------------------------------
const TM_W = 16.0
const TM_H = 9.0
area  = TM_W * TM_H
scale = area / sum(cat_totals)

top_rects = squarify(cat_totals .* scale, 0.0, 0.0, TM_W, TM_H)

# Sub-rectangles reuse the same global `scale`, so each category's children
# tile its parent rectangle exactly (their values sum to the parent's total).
leaf_rects  = NTuple{4,Float64}[]
leaf_colors = RGB[]
leaf_names  = String[]
leaf_values = Float64[]
cat_boxes   = NTuple{4,Float64}[]
cat_names   = String[]

for (i, (name, subs)) in enumerate(categories)
    cx, cy, cw, ch = top_rects[i]
    push!(cat_boxes, (cx, cy, cw, ch))
    push!(cat_names, name)

    base       = IMPRINT_PALETTE[i]
    sub_order  = sortperm(last.(subs); rev = true)
    sub_names  = first.(subs)[sub_order]
    sub_values = last.(subs)[sub_order]
    subrects   = squarify(sub_values .* scale, cx, cy, cw, ch)

    for (j, (sx, sy, sw, sh)) in enumerate(subrects)
        tint = length(subs) > 1 ? (j - 1) / (length(subs) - 1) : 0.0
        push!(leaf_rects, (sx, sy, sw, sh))
        push!(leaf_colors, tint_lightness(base, tint))
        push!(leaf_names, sub_names[j])
        push!(leaf_values, sub_values[j])
    end
end

# Title scaled to fit when prefixed with a descriptive subtitle.
title_text    = "Cloud Storage Usage by Team · treemap-basic · julia · makie · anyplot.ai"
title_default = 20
title_size = length(title_text) > 67 ?
    max(round(Int, title_default * 67 / length(title_text)), 13) :
    title_default

# Plot -----------------------------------------------------------------------
fig = Figure(resolution = (1600, 900), backgroundcolor = PAGE_BG)

ax = Axis(
    fig[1, 1];
    title           = title_text,
    titlesize       = title_size,
    titlecolor      = INK,
    backgroundcolor = PAGE_BG,
    aspect          = DataAspect(),
)
hidedecorations!(ax)
hidespines!(ax)

# Leaf tiles: fill color encodes the category (hue) and rank within it
# (lightness), with a page-bg hairline separating adjacent tiles.
leaf_polys = [Rect2f(x, y, w, h) for (x, y, w, h) in leaf_rects]
poly!(ax, leaf_polys; color = leaf_colors, strokecolor = PAGE_BG, strokewidth = 2.5)

# Category-group outline reads as the parent boundary above the tile hairlines.
for (x, y, w, h) in cat_boxes
    poly!(ax, Rect2f(x, y, w, h);
        color       = (:white, 0.0),
        strokecolor = INK_SOFT,
        strokewidth = 3.0,
    )
end

# Category label chips: a fixed elevated-bg backing keeps the header legible
# regardless of which tile tint sits underneath, only drawn where the parent
# rectangle is large enough to hold it.
for (i, (x, y, w, h)) in enumerate(cat_boxes)
    label = "$(cat_names[i]) · $(round(Int, cat_totals[i])) TB"
    chip_w = min(w - 0.16, length(label) * 0.115 + 0.3)
    if w >= 1.6 && h >= 0.9 && chip_w > 0.6
        chip_h = 0.46
        chip_x = x + 0.08
        chip_y = y + h - 0.08 - chip_h
        poly!(ax, Rect2f(chip_x, chip_y, chip_w, chip_h);
            color       = ELEV_BG,
            strokecolor = INK_SOFT,
            strokewidth = 1.0,
        )
        text!(ax, chip_x + chip_w / 2, chip_y + chip_h / 2;
            text     = label,
            align    = (:center, :center),
            color    = INK,
            fontsize = 14,
            font     = :bold,
        )
    end
end

# Subcategory labels: name + value, only when the tile is large enough to
# hold two lines of text without overflow (spec: smaller tiles omit labels).
for (i, (x, y, w, h)) in enumerate(leaf_rects)
    name  = leaf_names[i]
    label = "$(name)\n$(round(Int, leaf_values[i])) TB"
    if w >= max(0.9, length(name) * 0.075) && h >= 0.55
        text!(ax, x + w / 2, y + h / 2;
            text     = label,
            align    = (:center, :center),
            color    = contrast_ink(leaf_colors[i]),
            fontsize = 12,
            justification = :center,
        )
    end
end

xlims!(ax, 0, TM_W)
ylims!(ax, 0, TM_H)

save("plot-$(THEME).png", fig; px_per_unit = 2)
Runnable source as JSON, for any HTTP client: https://api.anyplot.ai/specs/treemap-basic/makie/code. Any spec id and library id listed in llms-full.txt fit the same URL shape; every URL below is complete and callable.
{
  "spec_id": "treemap-basic",
  "language": "julia",
  "library": "makie",
  "page": "https://anyplot.ai/treemap-basic/julia/makie",
  "hub": "https://anyplot.ai/treemap-basic",
  "code_json": "https://api.anyplot.ai/specs/treemap-basic/makie/code",
  "spec_json": "https://api.anyplot.ai/specs/treemap-basic",
  "render_light_png": "https://storage.googleapis.com/anyplot-images/plots/treemap-basic/julia/makie/plot-light.png",
  "render_dark_png": "https://storage.googleapis.com/anyplot-images/plots/treemap-basic/julia/makie/plot-dark.png",
  "quality_score": 88.0,
  "license": "MIT",
  "guide": "https://anyplot.ai/llms.txt"
}
Part of Basic Treemap on anyplot.ai.