The same plot in 13 other libraries — JavaScript: D3.js, Apache ECharts, Highcharts; Python: Altair, Bokeh, lets-plot, Matplotlib, Plotly, plotnine, Pygal, Seaborn; R: ggplot2; Julia: Makie.jl. Compare all 14 side by side: Basic Treemap in Python, R, Julia and JavaScript.
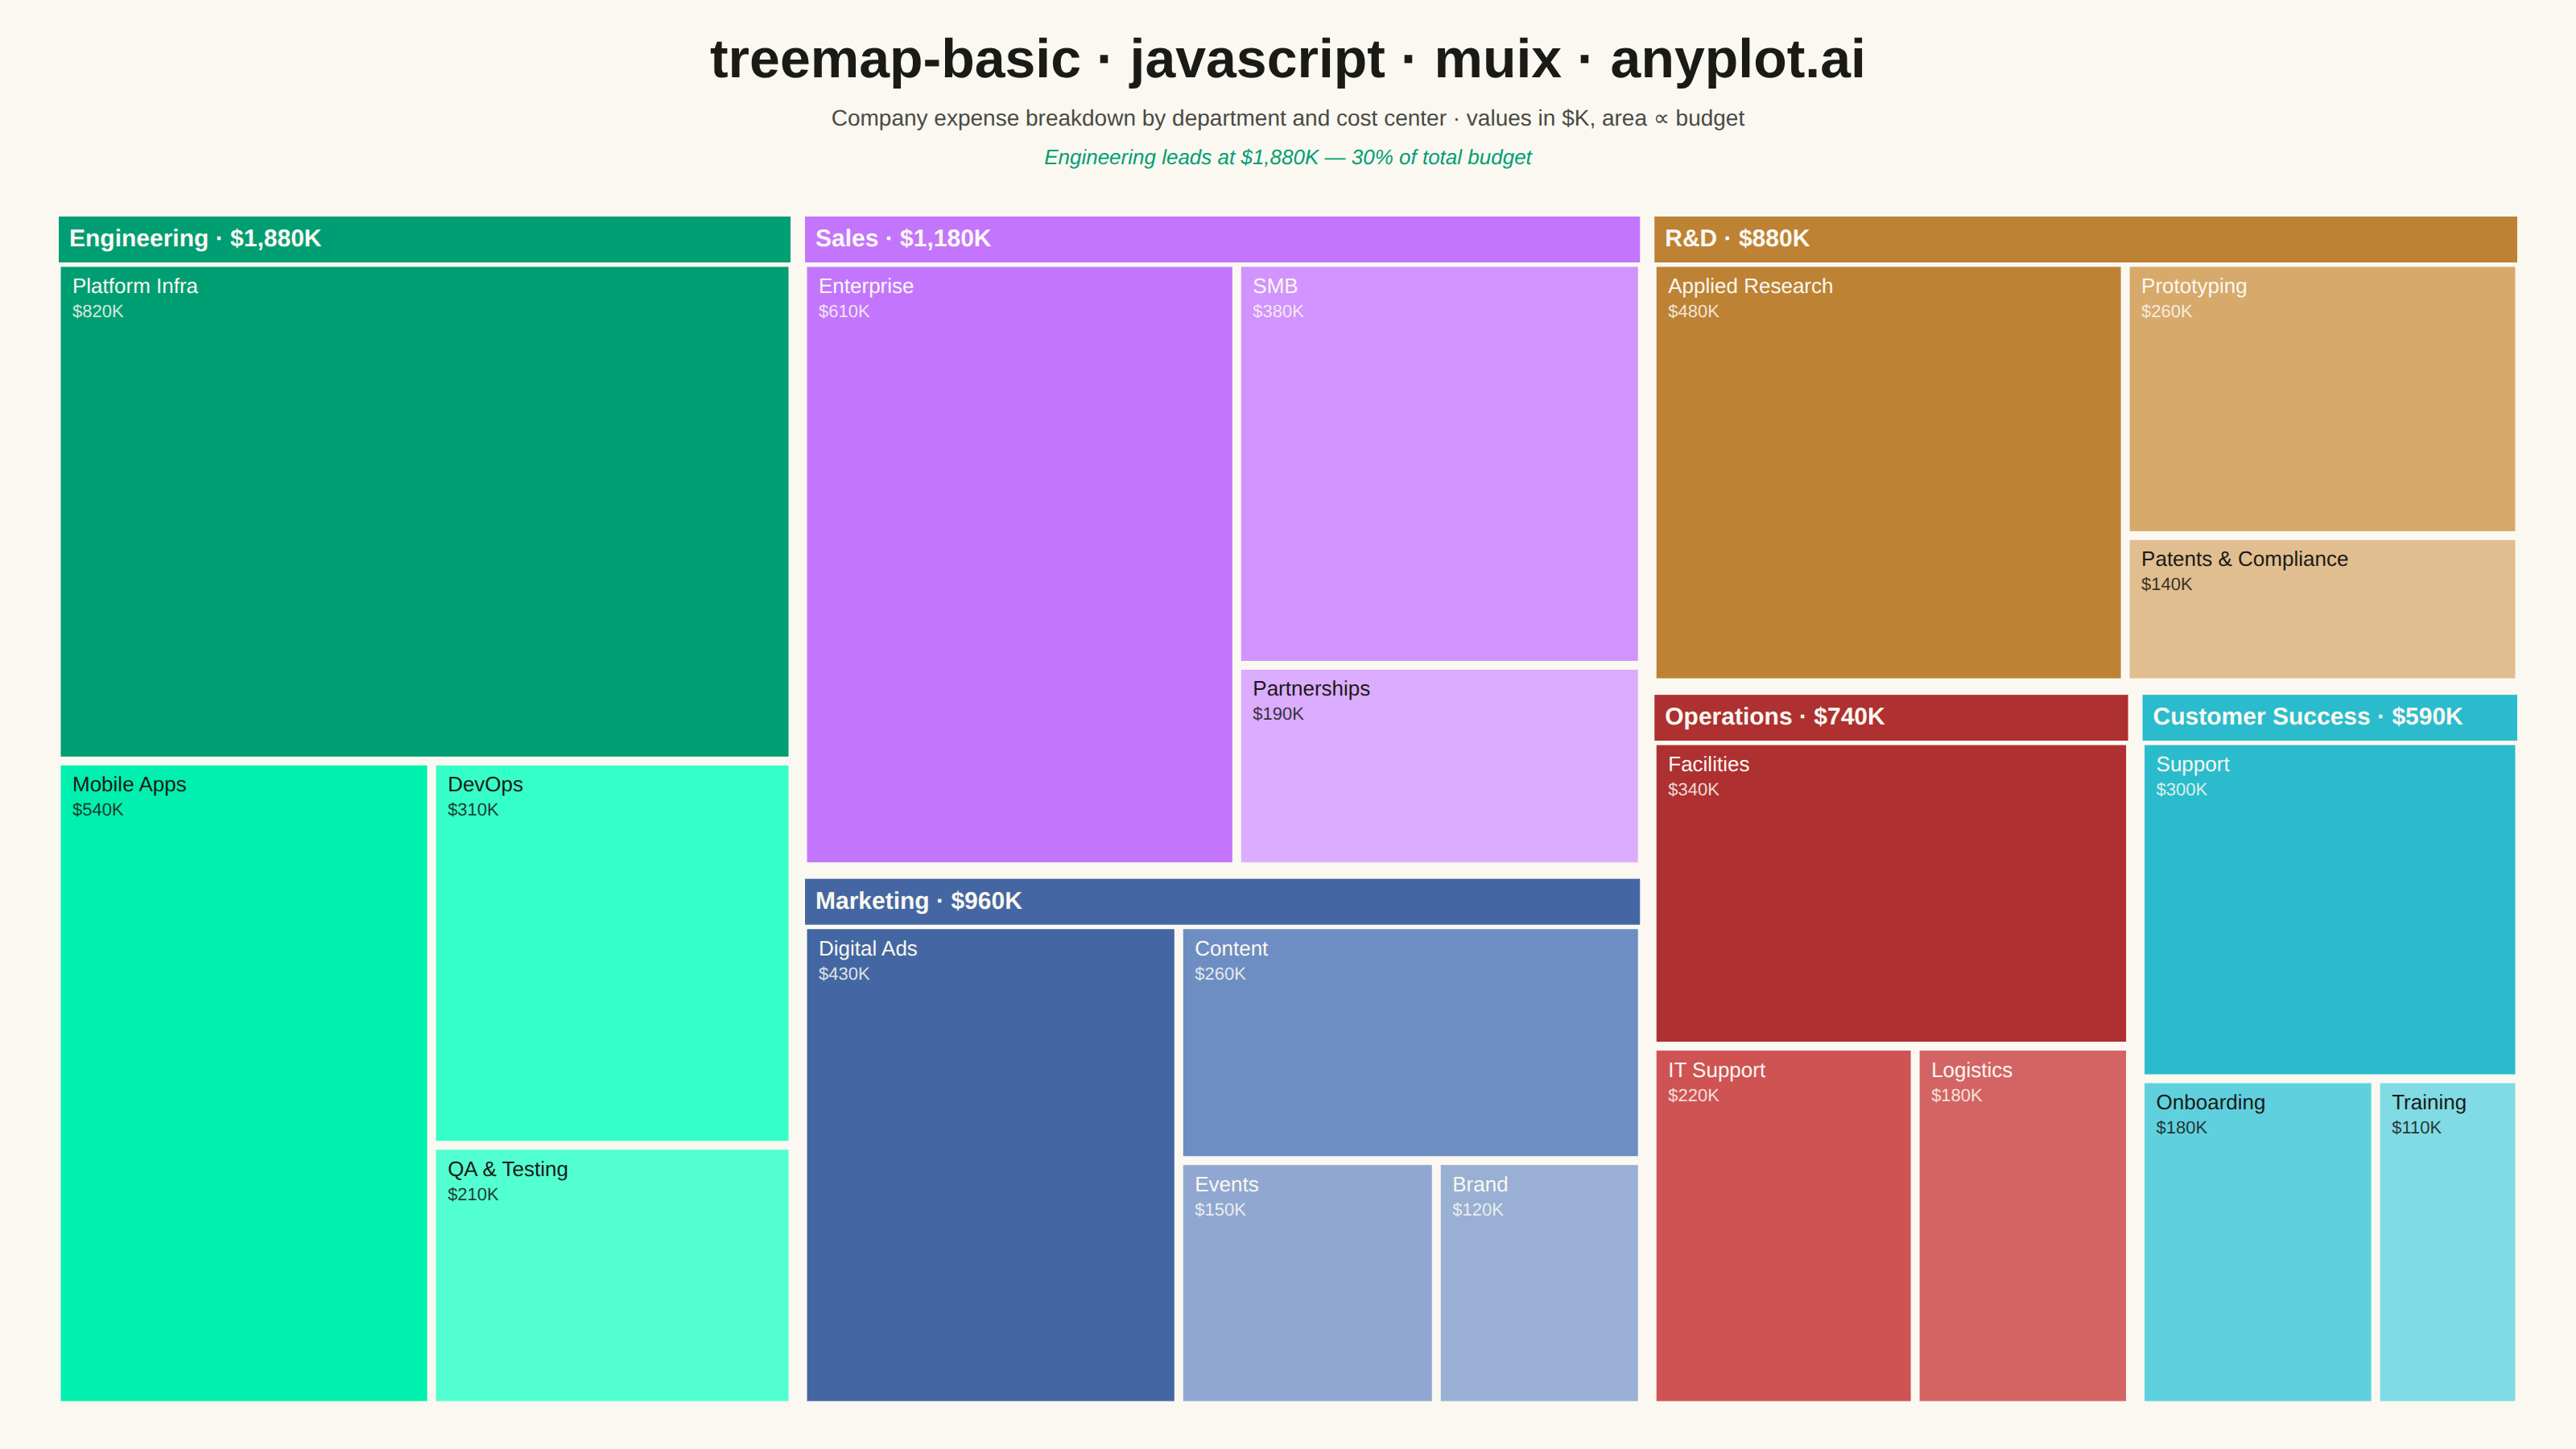
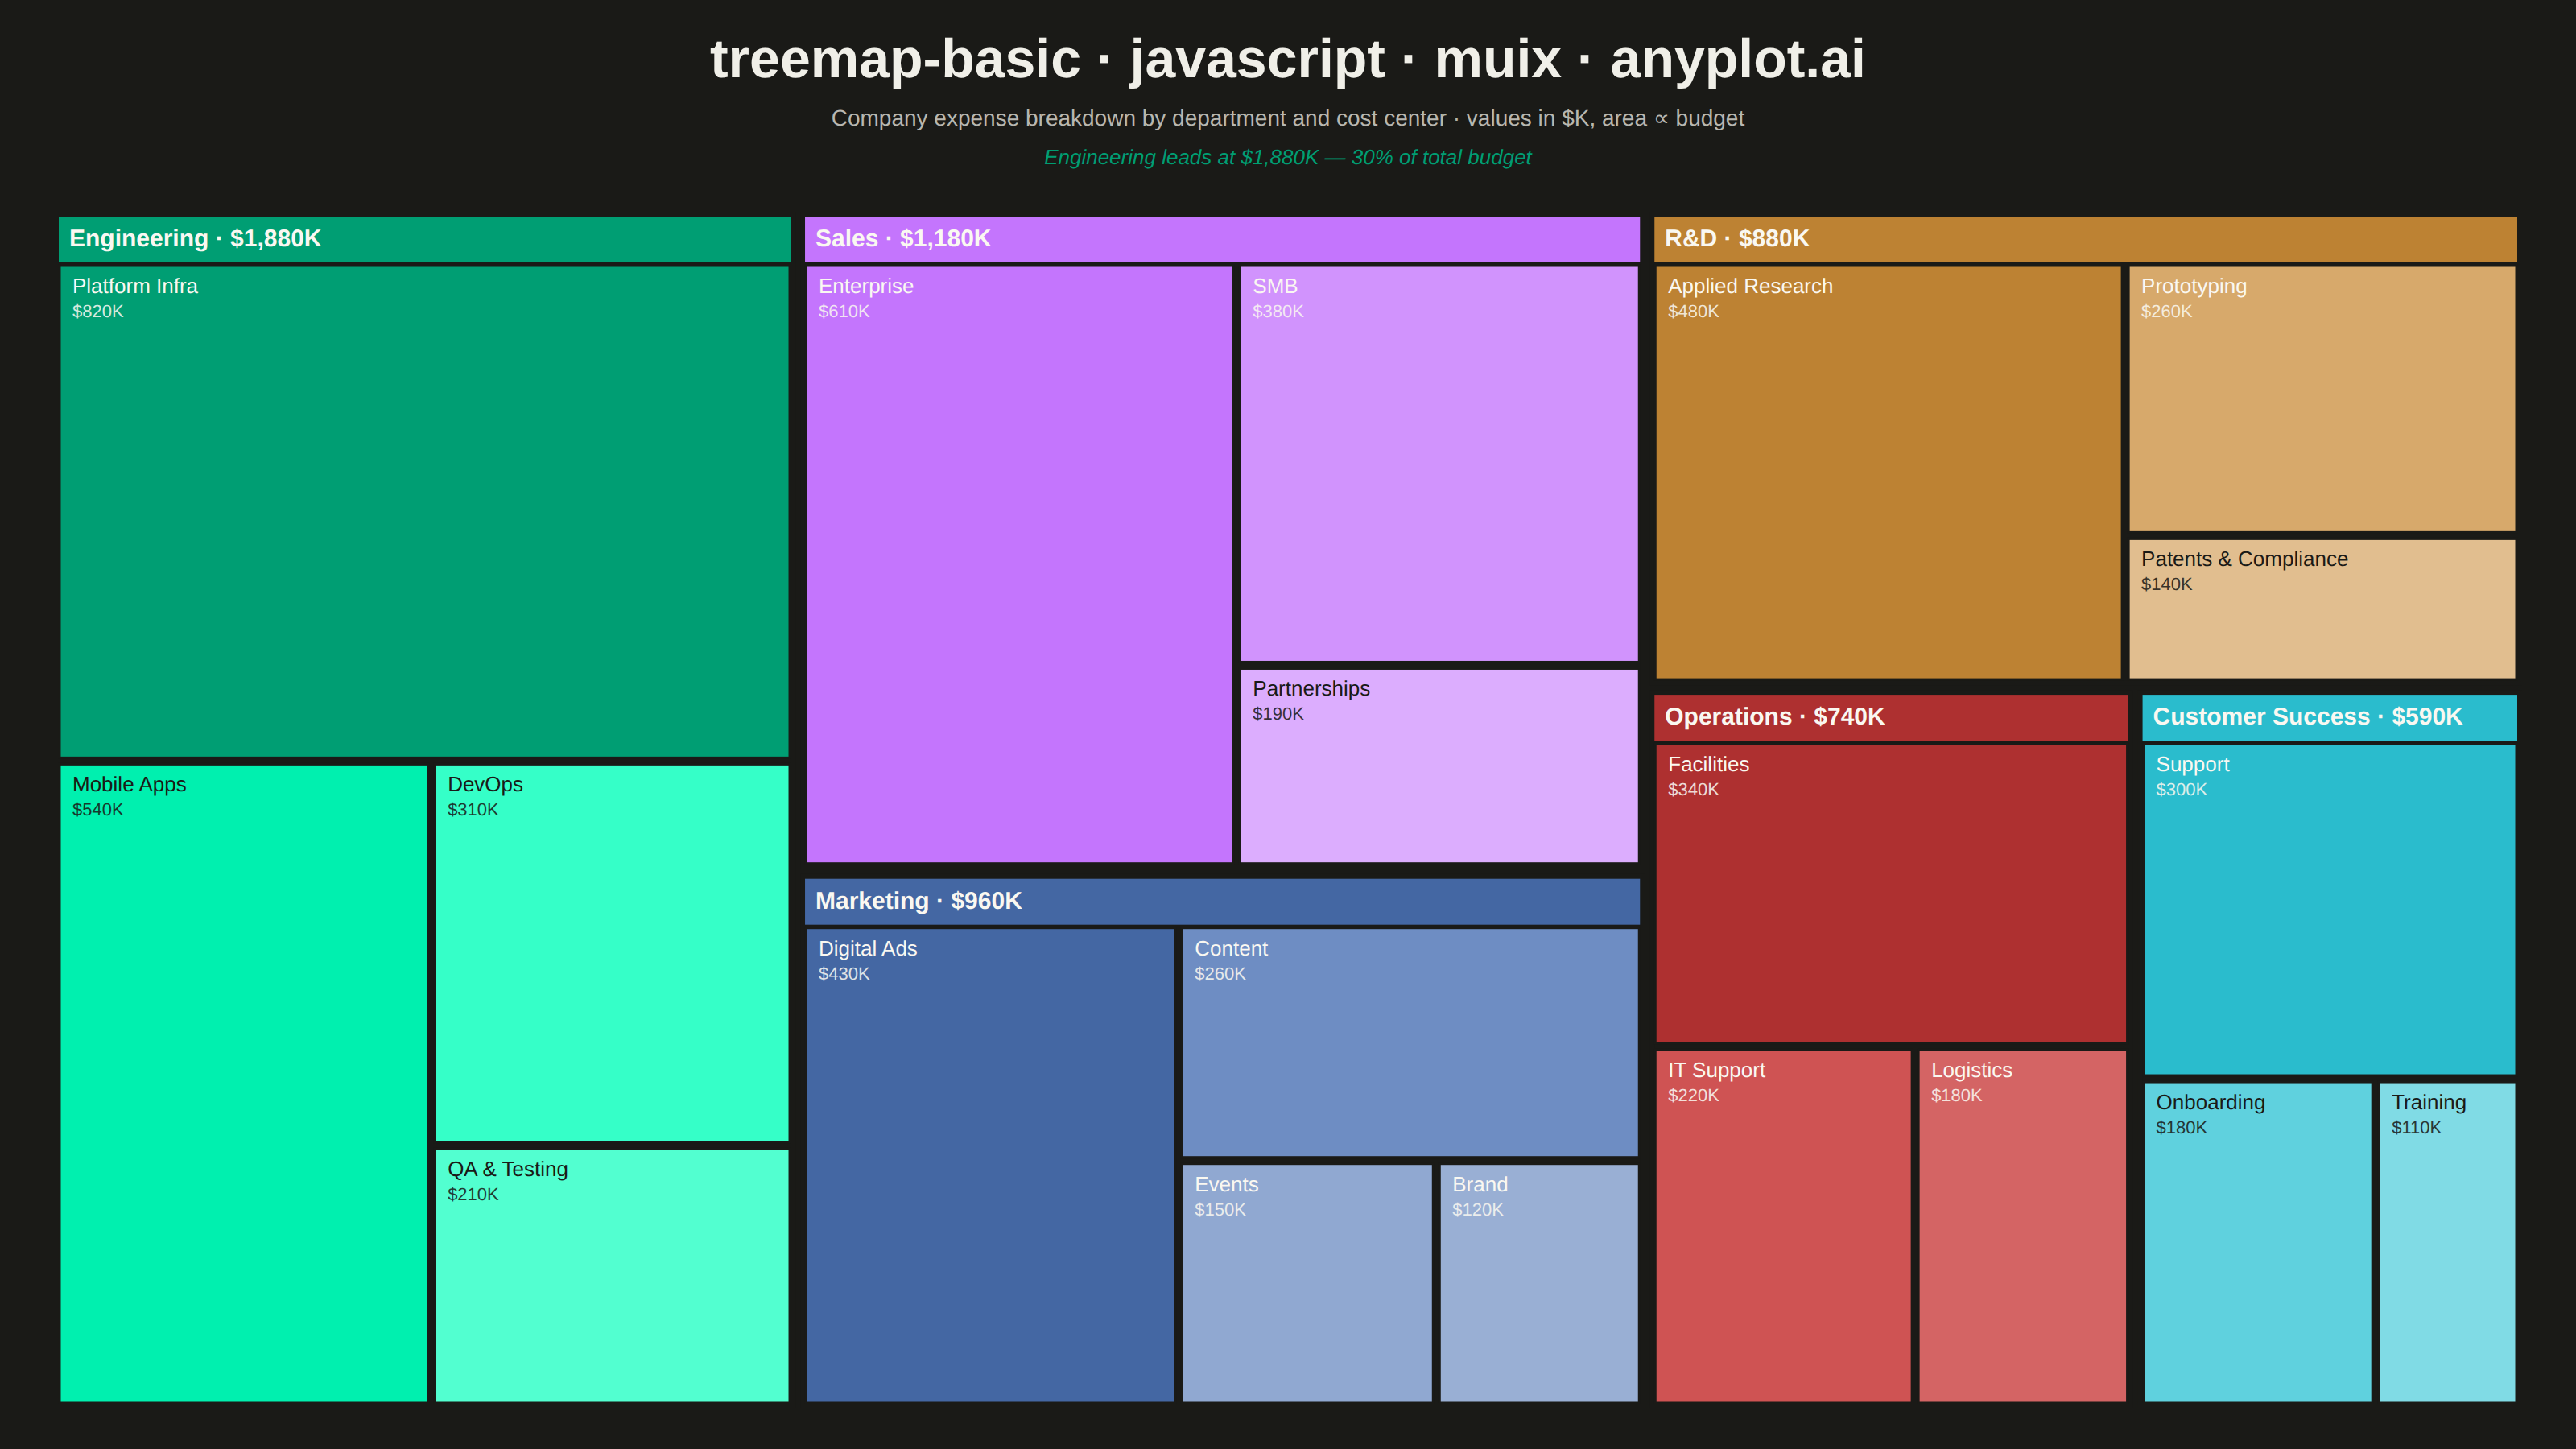
A treemap displaying hierarchical data as nested rectangles, where each rectangle's area is proportional to its value. This visualization excels at showing part-to-whole relationships in hierarchical structures, making it easy to spot large and small items at a glance. Treemaps efficiently use screen space to display large amounts of hierarchical data in a compact form.
// anyplot.ai
// treemap-basic: Basic Treemap
// Library: muix 7.29.1 | JavaScript 22.23.2
// Quality: 93/100 | Created: 2026-08-24
import { ChartContainer } from "@mui/x-charts/ChartContainer";
import { useDrawingArea } from "@mui/x-charts/hooks";

const t = window.ANYPLOT_TOKENS;

const title = "treemap-basic · javascript · muix · anyplot.ai";
const titleFontSize = Math.max(18, Math.min(34, Math.round(34 * Math.min(1, 67 / title.length))));

// --- Data: a company expense breakdown by department (category) and cost
// center / project (subcategory), in $ thousands -- one of the spec's listed
// applications. 6 departments, 20 cost centers (26 rectangles total). -------
const DEPARTMENTS = [
  {
    name: "Engineering",
    items: [
      { name: "Platform Infra", value: 820 },
      { name: "Mobile Apps", value: 540 },
      { name: "DevOps", value: 310 },
      { name: "QA & Testing", value: 210 },
    ],
  },
  {
    name: "Sales",
    items: [
      { name: "Enterprise", value: 610 },
      { name: "SMB", value: 380 },
      { name: "Partnerships", value: 190 },
    ],
  },
  {
    name: "Marketing",
    items: [
      { name: "Digital Ads", value: 430 },
      { name: "Content", value: 260 },
      { name: "Events", value: 150 },
      { name: "Brand", value: 120 },
    ],
  },
  {
    name: "R&D",
    items: [
      { name: "Applied Research", value: 480 },
      { name: "Prototyping", value: 260 },
      { name: "Patents & Compliance", value: 140 },
    ],
  },
  {
    name: "Operations",
    items: [
      { name: "Facilities", value: 340 },
      { name: "IT Support", value: 220 },
      { name: "Logistics", value: 180 },
    ],
  },
  {
    name: "Customer Success",
    items: [
      { name: "Support", value: 300 },
      { name: "Onboarding", value: 180 },
      { name: "Training", value: 110 },
    ],
  },
];
const departments = DEPARTMENTS.map((d) => ({
  ...d,
  value: d.items.reduce((sum, i) => sum + i.value, 0),
}));
const grandTotal = departments.reduce((sum, d) => sum + d.value, 0);

// --- Squarified treemap layout (Bruls, Huizing & van Wijk, 1999) -----------
// Lays out `items` (each with a numeric `.value`) inside `container`
// ({x, y, w, h}), returning each item with added `.x/.y/.w/.h`, minimizing
// aspect ratio so rectangles stay close to square rather than thin slivers.
function worstRatio(row, length) {
  if (row.length === 0) return Infinity;
  const sum = row.reduce((a, r) => a + r.area, 0);
  const rmax = Math.max(...row.map((r) => r.area));
  const rmin = Math.min(...row.map((r) => r.area));
  return Math.max((length * length * rmax) / (sum * sum), (sum * sum) / (length * length * rmin));
}

function layoutRow(row, rect) {
  const sum = row.reduce((a, r) => a + r.area, 0);
  const { x, y, w, h } = rect;
  const placed = [];
  if (w >= h) {
    const stripW = sum / h;
    let cy = y;
    row.forEach((item) => {
      const itemH = item.area / stripW;
      placed.push({ ...item, x, y: cy, w: stripW, h: itemH });
      cy += itemH;
    });
    return { placed, rest: { x: x + stripW, y, w: w - stripW, h } };
  }
  const stripH = sum / w;
  let cx = x;
  row.forEach((item) => {
    const itemW = item.area / stripH;
    placed.push({ ...item, x: cx, y, w: itemW, h: stripH });
    cx += itemW;
  });
  return { placed, rest: { x, y: y + stripH, w, h: h - stripH } };
}

function squarify(items, container) {
  const total = items.reduce((s, i) => s + i.value, 0);
  const area = Math.max(container.w, 0) * Math.max(container.h, 0);
  const sorted = items.map((i) => ({ ...i, area: total > 0 ? (i.value / total) * area : 0 })).sort((a, b) => b.area - a.area);

  const results = [];
  let rect = container;
  let row = [];
  let remaining = sorted;
  while (remaining.length > 0) {
    const candidate = remaining[0];
    const shortSide = Math.min(rect.w, rect.h);
    const nextRow = row.concat(candidate);
    if (row.length === 0 || worstRatio(nextRow, shortSide) <= worstRatio(row, shortSide)) {
      row = nextRow;
      remaining = remaining.slice(1);
    } else {
      const { placed, rest } = layoutRow(row, rect);
      results.push(...placed);
      rect = rest;
      row = [];
    }
  }
  if (row.length > 0) results.push(...layoutRow(row, rect).placed);
  return results;
}

function inset(r, px) {
  const w = Math.max(0, r.w - 2 * px);
  const h = Math.max(0, r.h - 2 * px);
  return { ...r, x: r.x + px, y: r.y + px, w, h };
}

// --- Color: distinct Imprint hue per department; cost centers within a
// department get progressively lighter tints of that hue (largest = base
// hue, smallest = lightest), so shading intensity communicates both the
// category identity and the nesting depth, per the spec's Notes. -----------
function hexToRgb(hex) {
  const n = parseInt(hex.slice(1), 16);
  return [(n >> 16) & 255, (n >> 8) & 255, n & 255];
}
function rgbToHsl(r, g, b) {
  r /= 255;
  g /= 255;
  b /= 255;
  const max = Math.max(r, g, b);
  const min = Math.min(r, g, b);
  const l = (max + min) / 2;
  if (max === min) return [0, 0, l];
  const d = max - min;
  const s = l > 0.5 ? d / (2 - max - min) : d / (max + min);
  let h;
  if (max === r) h = (g - b) / d + (g < b ? 6 : 0);
  else if (max === g) h = (b - r) / d + 2;
  else h = (r - g) / d + 4;
  return [h / 6, s, l];
}
function hueToRgb(p, q, tIn) {
  let tt = tIn;
  if (tt < 0) tt += 1;
  if (tt > 1) tt -= 1;
  if (tt < 1 / 6) return p + (q - p) * 6 * tt;
  if (tt < 1 / 2) return q;
  if (tt < 2 / 3) return p + (q - p) * (2 / 3 - tt) * 6;
  return p;
}
function hslToRgb(h, s, l) {
  if (s === 0) {
    const v = Math.round(l * 255);
    return [v, v, v];
  }
  const q = l < 0.5 ? l * (1 + s) : l + s - l * s;
  const p = 2 * l - q;
  return [Math.round(hueToRgb(p, q, h + 1 / 3) * 255), Math.round(hueToRgb(p, q, h) * 255), Math.round(hueToRgb(p, q, h - 1 / 3) * 255)];
}
function tintRgb(hex, factor) {
  const [r, g, b] = hexToRgb(hex);
  const [h, s, l] = rgbToHsl(r, g, b);
  return hslToRgb(h, s, l + (0.94 - l) * factor);
}
function relLuminanceRgb([r, g, b]) {
  const srgb = [r, g, b].map((v) => v / 255).map((v) => (v <= 0.03928 ? v / 12.92 : Math.pow((v + 0.055) / 1.055, 2.4)));
  return 0.2126 * srgb[0] + 0.7152 * srgb[1] + 0.0722 * srgb[2];
}
function textColorForRgb(rgb) {
  return relLuminanceRgb(rgb) > 0.45 ? "#1A1A17" : "#FAF8F1";
}
function textColorFor(hex) {
  return textColorForRgb(hexToRgb(hex));
}

// Keyed by department name (not array position) so color assignment stays
// correct even if DEPARTMENTS is reordered or rebalanced -- squarify() sorts
// its output by value, so indexing colors by position would silently
// misassign hues once input order no longer matches value order.
const DEPT_COLOR_BY_NAME = new Map(DEPARTMENTS.map((d, i) => [d.name, t.palette[i % t.palette.length]]));

// --- Layout: departments squarified over the chart area, then each
// department's cost centers squarified again inside a header-inset rect --
const MARGIN = { top: 130, right: 32, bottom: 24, left: 32 };
const GUTTER = 3;
const HEADER_H = 30;
const LABEL_FONT_SIZE = 15;
const CHAR_WIDTH_RATIO = 0.56;

function fmtK(v) {
  return `$${v.toLocaleString()}K`;
}
function fitsLabel(w, h, text, fontSize) {
  return w - 12 >= text.length * fontSize * CHAR_WIDTH_RATIO && h >= fontSize + 6;
}

function TreemapRect({ x, y, w, h, fill, stroke, strokeWidth, label, sublabel, fontSize, textFill, tooltip }) {
  const showLabel = label && fitsLabel(w, h, label, fontSize);
  const showSub = showLabel && sublabel && h >= fontSize * 2 + 10;
  return (
    <g>
      <rect x={x} y={y} width={w} height={h} fill={fill} stroke={stroke} strokeWidth={strokeWidth}>
        <title>{tooltip}</title>
      </rect>
      {showLabel && (
        <text x={x + 8} y={y + fontSize + 4} fontSize={fontSize} fontWeight={500} fill={textFill} pointerEvents="none">
          {label}
        </text>
      )}
      {showSub && (
        <text x={x + 8} y={y + fontSize * 2 + 6} fontSize={fontSize - 2} fill={textFill} opacity={0.85} pointerEvents="none">
          {sublabel}
        </text>
      )}
    </g>
  );
}

function Treemap() {
  // The drawing area comes from MUI X's own DrawingProvider (via
  // ChartContainer's `margin` prop) rather than a hand-rolled offset -- the
  // same layout primitive MUI X's own axis/legend components rely on.
  const { left, top, width, height } = useDrawingArea();
  const chartArea = { x: left, y: top, w: width, h: height };
  const deptRects = squarify(departments, chartArea).map((d) => ({ ...d, color: DEPT_COLOR_BY_NAME.get(d.name) }));

  return (
    <g>
      {deptRects.map((dept) => {
        const outer = inset(dept, GUTTER);
        const pct = ((dept.value / grandTotal) * 100).toFixed(1);
        const canShowHeader = outer.h >= HEADER_H + 40 && outer.w >= 70;
        const headerText = textColorFor(dept.color);

        if (!canShowHeader) {
          // Too small for a nested breakdown -- fill flat with the base hue.
          return (
            <TreemapRect
              key={dept.name}
              x={outer.x}
              y={outer.y}
              w={outer.w}
              h={outer.h}
              fill={dept.color}
              stroke={t.pageBg}
              strokeWidth={1.5}
              label={dept.name}
              fontSize={LABEL_FONT_SIZE - 1}
              textFill={headerText}
              tooltip={`${dept.name}: ${fmtK(dept.value)} (${pct}%)`}
            />
          );
        }

        const innerArea = { x: outer.x, y: outer.y + HEADER_H, w: outer.w, h: outer.h - HEADER_H };
        const itemRects = squarify(dept.items, innerArea);
        const maxItemArea = Math.max(...itemRects.map((x) => x.area));

        return (
          <g key={dept.name}>
            <rect x={outer.x} y={outer.y} width={outer.w} height={HEADER_H} fill={dept.color}>
              <title>{`${dept.name}: ${fmtK(dept.value)} (${pct}% of total)`}</title>
            </rect>
            <text x={outer.x + 8} y={outer.y + HEADER_H / 2 + 5} fontSize={LABEL_FONT_SIZE} fontWeight={700} fill={headerText}>
              {dept.name} · {fmtK(dept.value)}
            </text>
            <rect x={outer.x} y={outer.y} width={outer.w} height={outer.h} fill="none" stroke={t.pageBg} strokeWidth={GUTTER} />
            {itemRects.map((item) => {
              const r = inset(item, 2);
              // Largest cost center keeps the department's base hue; smaller
              // ones tint progressively lighter, so shade intensity echoes
              // relative size within the department (nesting-depth cue).
              const tintFactor = itemRects.length <= 1 ? 0 : (1 - item.area / maxItemArea) * 0.75;
              const rgb = tintRgb(dept.color, tintFactor);
              const fill = `rgb(${rgb[0]}, ${rgb[1]}, ${rgb[2]})`;
              const itemPct = ((item.value / dept.value) * 100).toFixed(0);
              return (
                <TreemapRect
                  key={item.name}
                  x={r.x}
                  y={r.y}
                  w={r.w}
                  h={r.h}
                  fill={fill}
                  stroke={t.pageBg}
                  strokeWidth={1.5}
                  label={item.name}
                  sublabel={fmtK(item.value)}
                  fontSize={LABEL_FONT_SIZE - 2}
                  textFill={textColorForRgb(rgb)}
                  tooltip={`${dept.name} / ${item.name}: ${fmtK(item.value)} (${itemPct}% of ${dept.name})`}
                />
              );
            })}
          </g>
        );
      })}
    </g>
  );
}

const topDept = departments.reduce((a, b) => (b.value > a.value ? b : a));
const topDeptPct = ((topDept.value / grandTotal) * 100).toFixed(0);
const insight = `${topDept.name} leads at ${fmtK(topDept.value)} — ${topDeptPct}% of total budget`;

// --- Chart (default-exported component -- the harness mounts it) ----------
// ChartContainer supplies the <ChartsSurface> SVG root and theme context; its
// `margin` prop drives the DrawingProvider that Treemap() reads back via
// useDrawingArea(), so the top-chrome/plot split is expressed through MUI X's
// own layout system rather than a parallel hand-rolled offset. The treemap
// body itself is laid out in absolute pixel space via squarify() above, so no
// axis/scale is needed -- xAxis/yAxis are omitted entirely.
export default function Chart() {
  const { width, height } = window.ANYPLOT_SIZE;

  return (
    <ChartContainer width={width} height={height} series={[]} margin={MARGIN} skipAnimation>
      <text x={width / 2} y={48} textAnchor="middle" fontSize={titleFontSize} fontWeight={600} fill={t.ink}>
        {title}
      </text>
      <text x={width / 2} y={78} textAnchor="middle" fontSize={14} fill={t.inkSoft}>
        Company expense breakdown by department and cost center · values in $K, area ∝ budget
      </text>
      <text x={width / 2} y={102} textAnchor="middle" fontSize={13} fontStyle="italic" fill={DEPT_COLOR_BY_NAME.get(topDept.name)}>
        {insight}
      </text>
      <Treemap />
    </ChartContainer>
  );
}
Runnable source as JSON, for any HTTP client: https://api.anyplot.ai/specs/treemap-basic/muix/code. Any spec id and library id listed in llms-full.txt fit the same URL shape; every URL below is complete and callable.
{
  "spec_id": "treemap-basic",
  "language": "javascript",
  "library": "muix",
  "page": "https://anyplot.ai/treemap-basic/javascript/muix",
  "hub": "https://anyplot.ai/treemap-basic",
  "code_json": "https://api.anyplot.ai/specs/treemap-basic/muix/code",
  "spec_json": "https://api.anyplot.ai/specs/treemap-basic",
  "render_light_png": "https://storage.googleapis.com/anyplot-images/plots/treemap-basic/javascript/muix/plot-light.png",
  "render_dark_png": "https://storage.googleapis.com/anyplot-images/plots/treemap-basic/javascript/muix/plot-dark.png",
  "interactive_light_html": "https://storage.googleapis.com/anyplot-images/plots/treemap-basic/javascript/muix/plot-light.html",
  "interactive_dark_html": "https://storage.googleapis.com/anyplot-images/plots/treemap-basic/javascript/muix/plot-dark.html",
  "quality_score": 93.0,
  "license": "MIT",
  "guide": "https://anyplot.ai/llms.txt"
}
Part of Basic Treemap on anyplot.ai.