Source code in 15 libraries — Python: Altair, Bokeh, lets-plot, Matplotlib, Plotly, plotnine, Pygal, Seaborn; R: ggplot2; Julia: Makie.jl; JavaScript: Chart.js, D3.js, Apache ECharts, Highcharts, MUI X Charts.
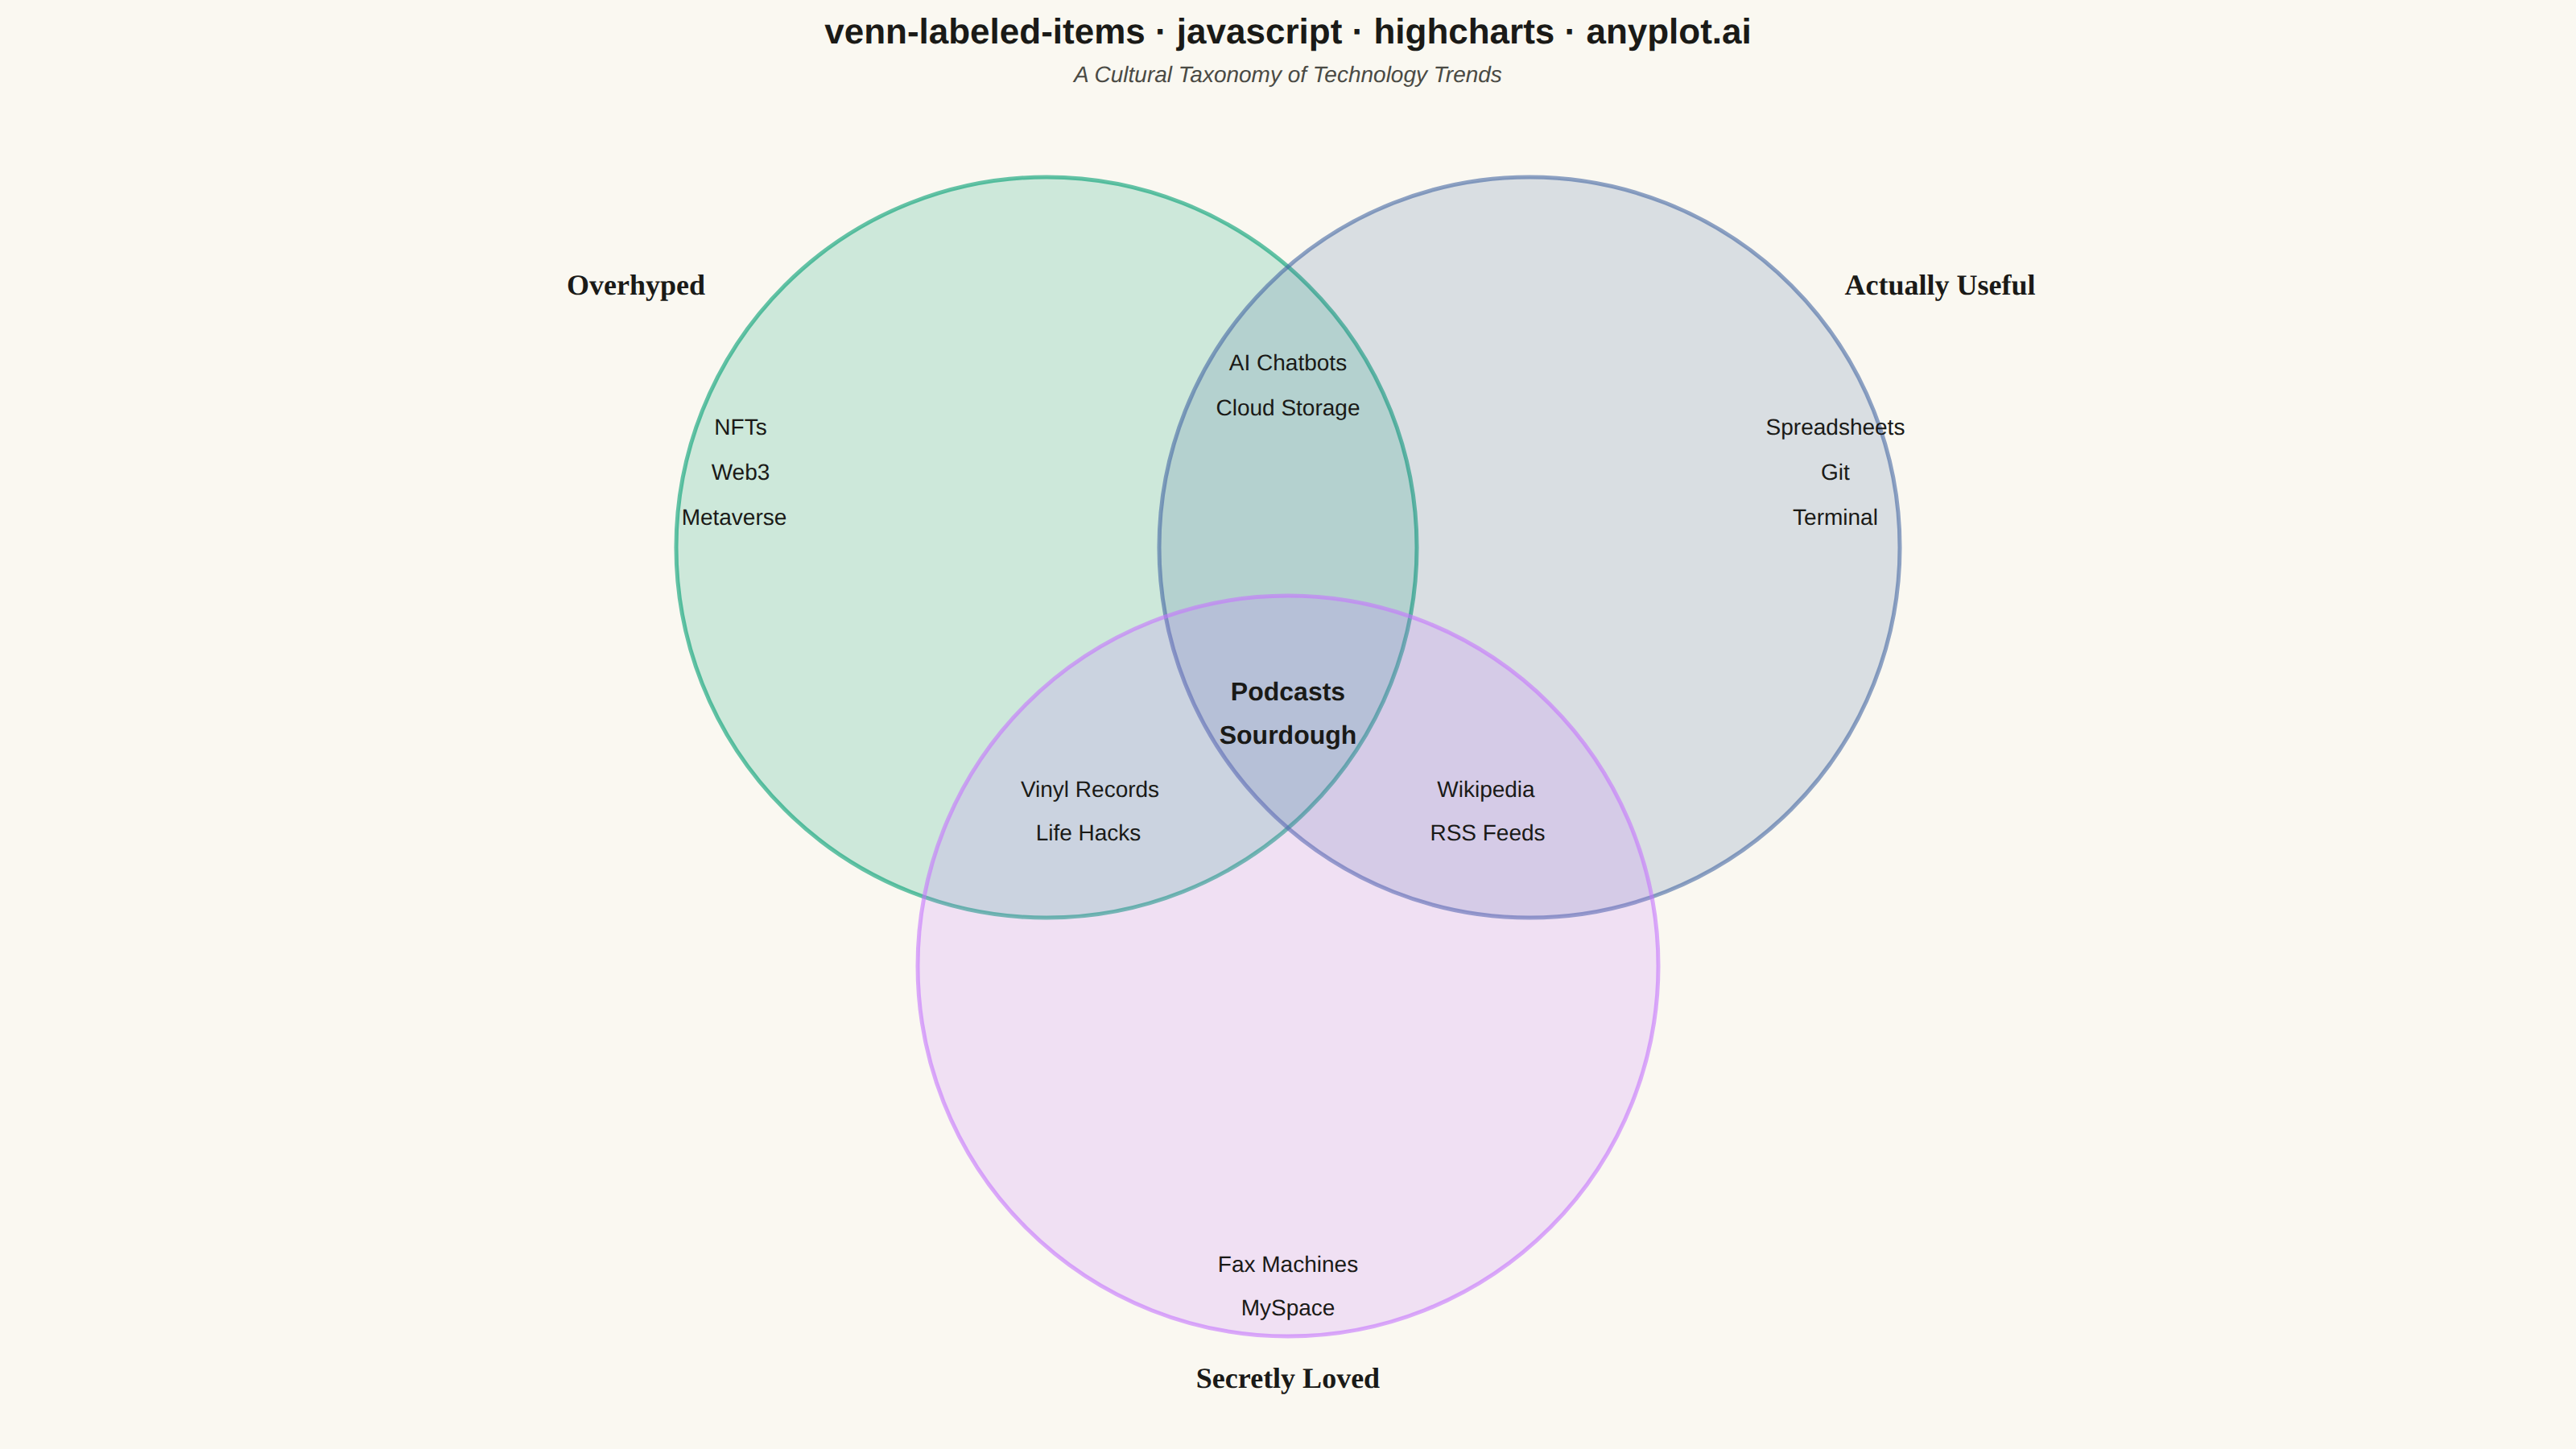
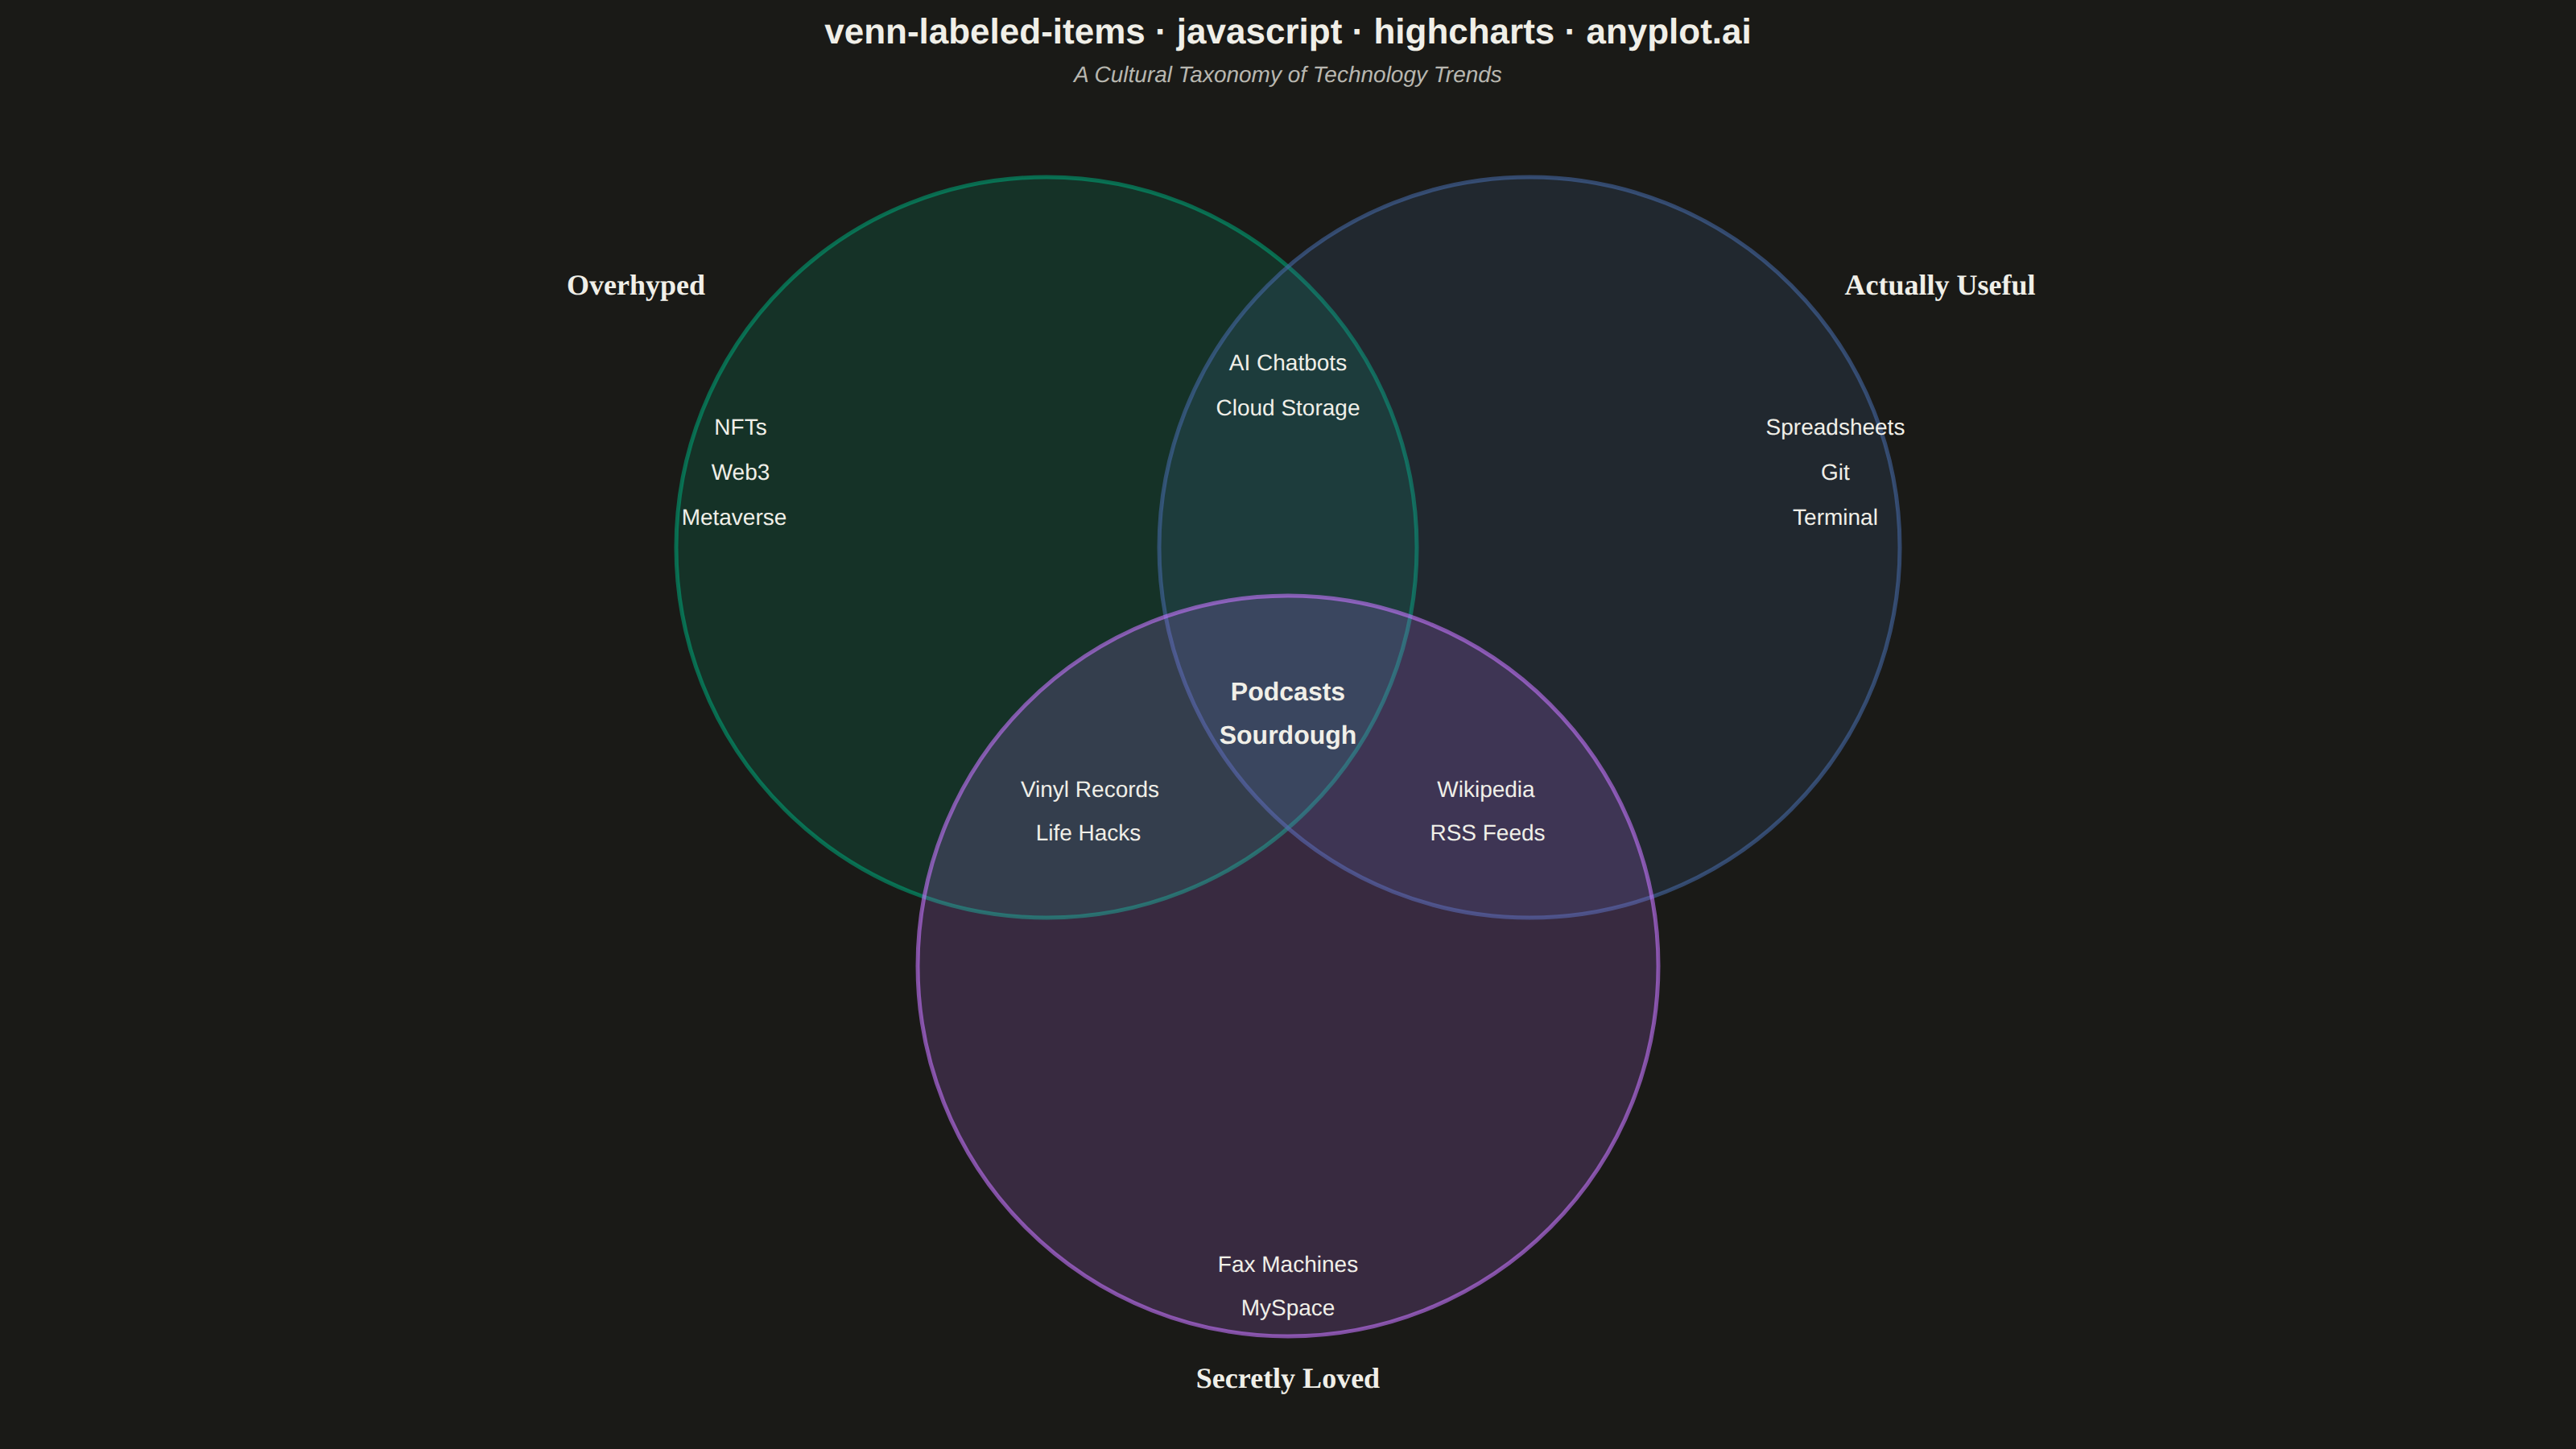
An editorial, WIRED "Chartgeist"-style three-circle Venn diagram where pop-culture items — products, people, trends, apps — are plotted as labeled points inside each zone rather than represented as numeric counts. Three overlapping circles define witty, opinionated categories (e.g., "Overhyped", "Actually Useful", "Secretly Loved"), and each item lives in exactly one of the seven interior regions (or outside all circles). Unlike a classic proportional Venn, the "data" here is categorical set-membership plus a human label, making the plot ideal for commentary, taxonomy, and discussion rather than quantitative analysis.
Preview render from the Highcharts implementation.