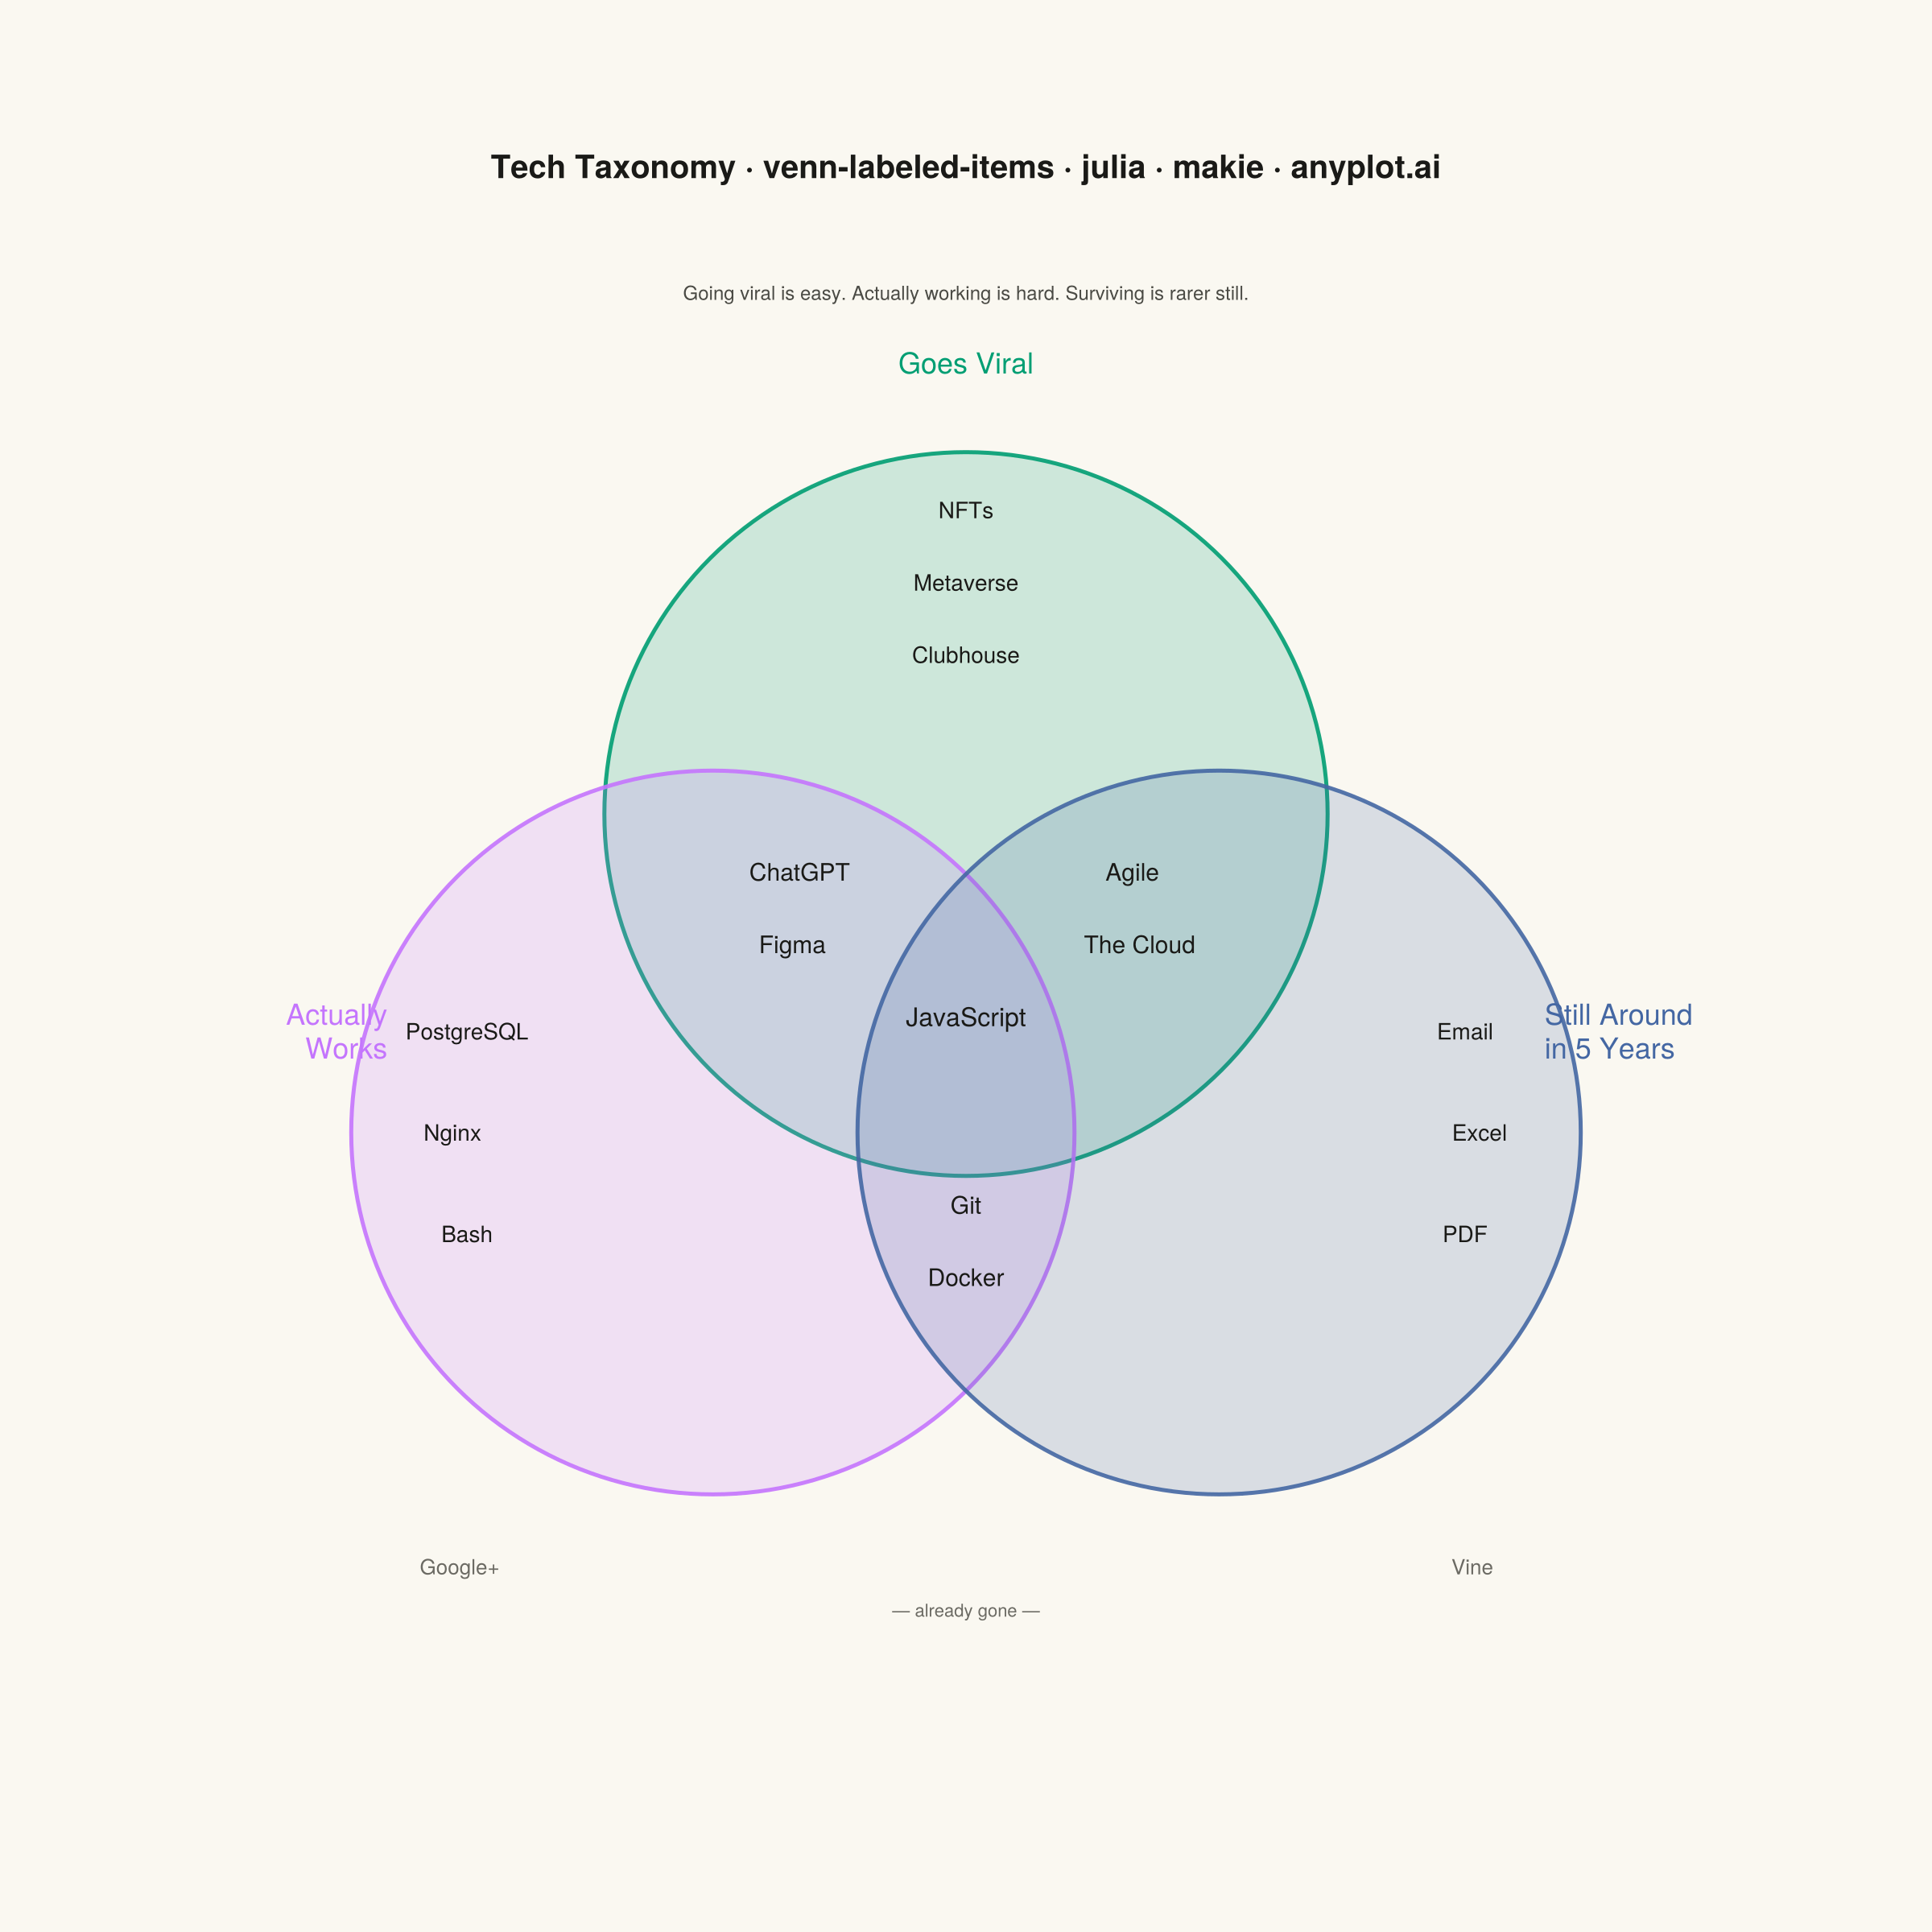
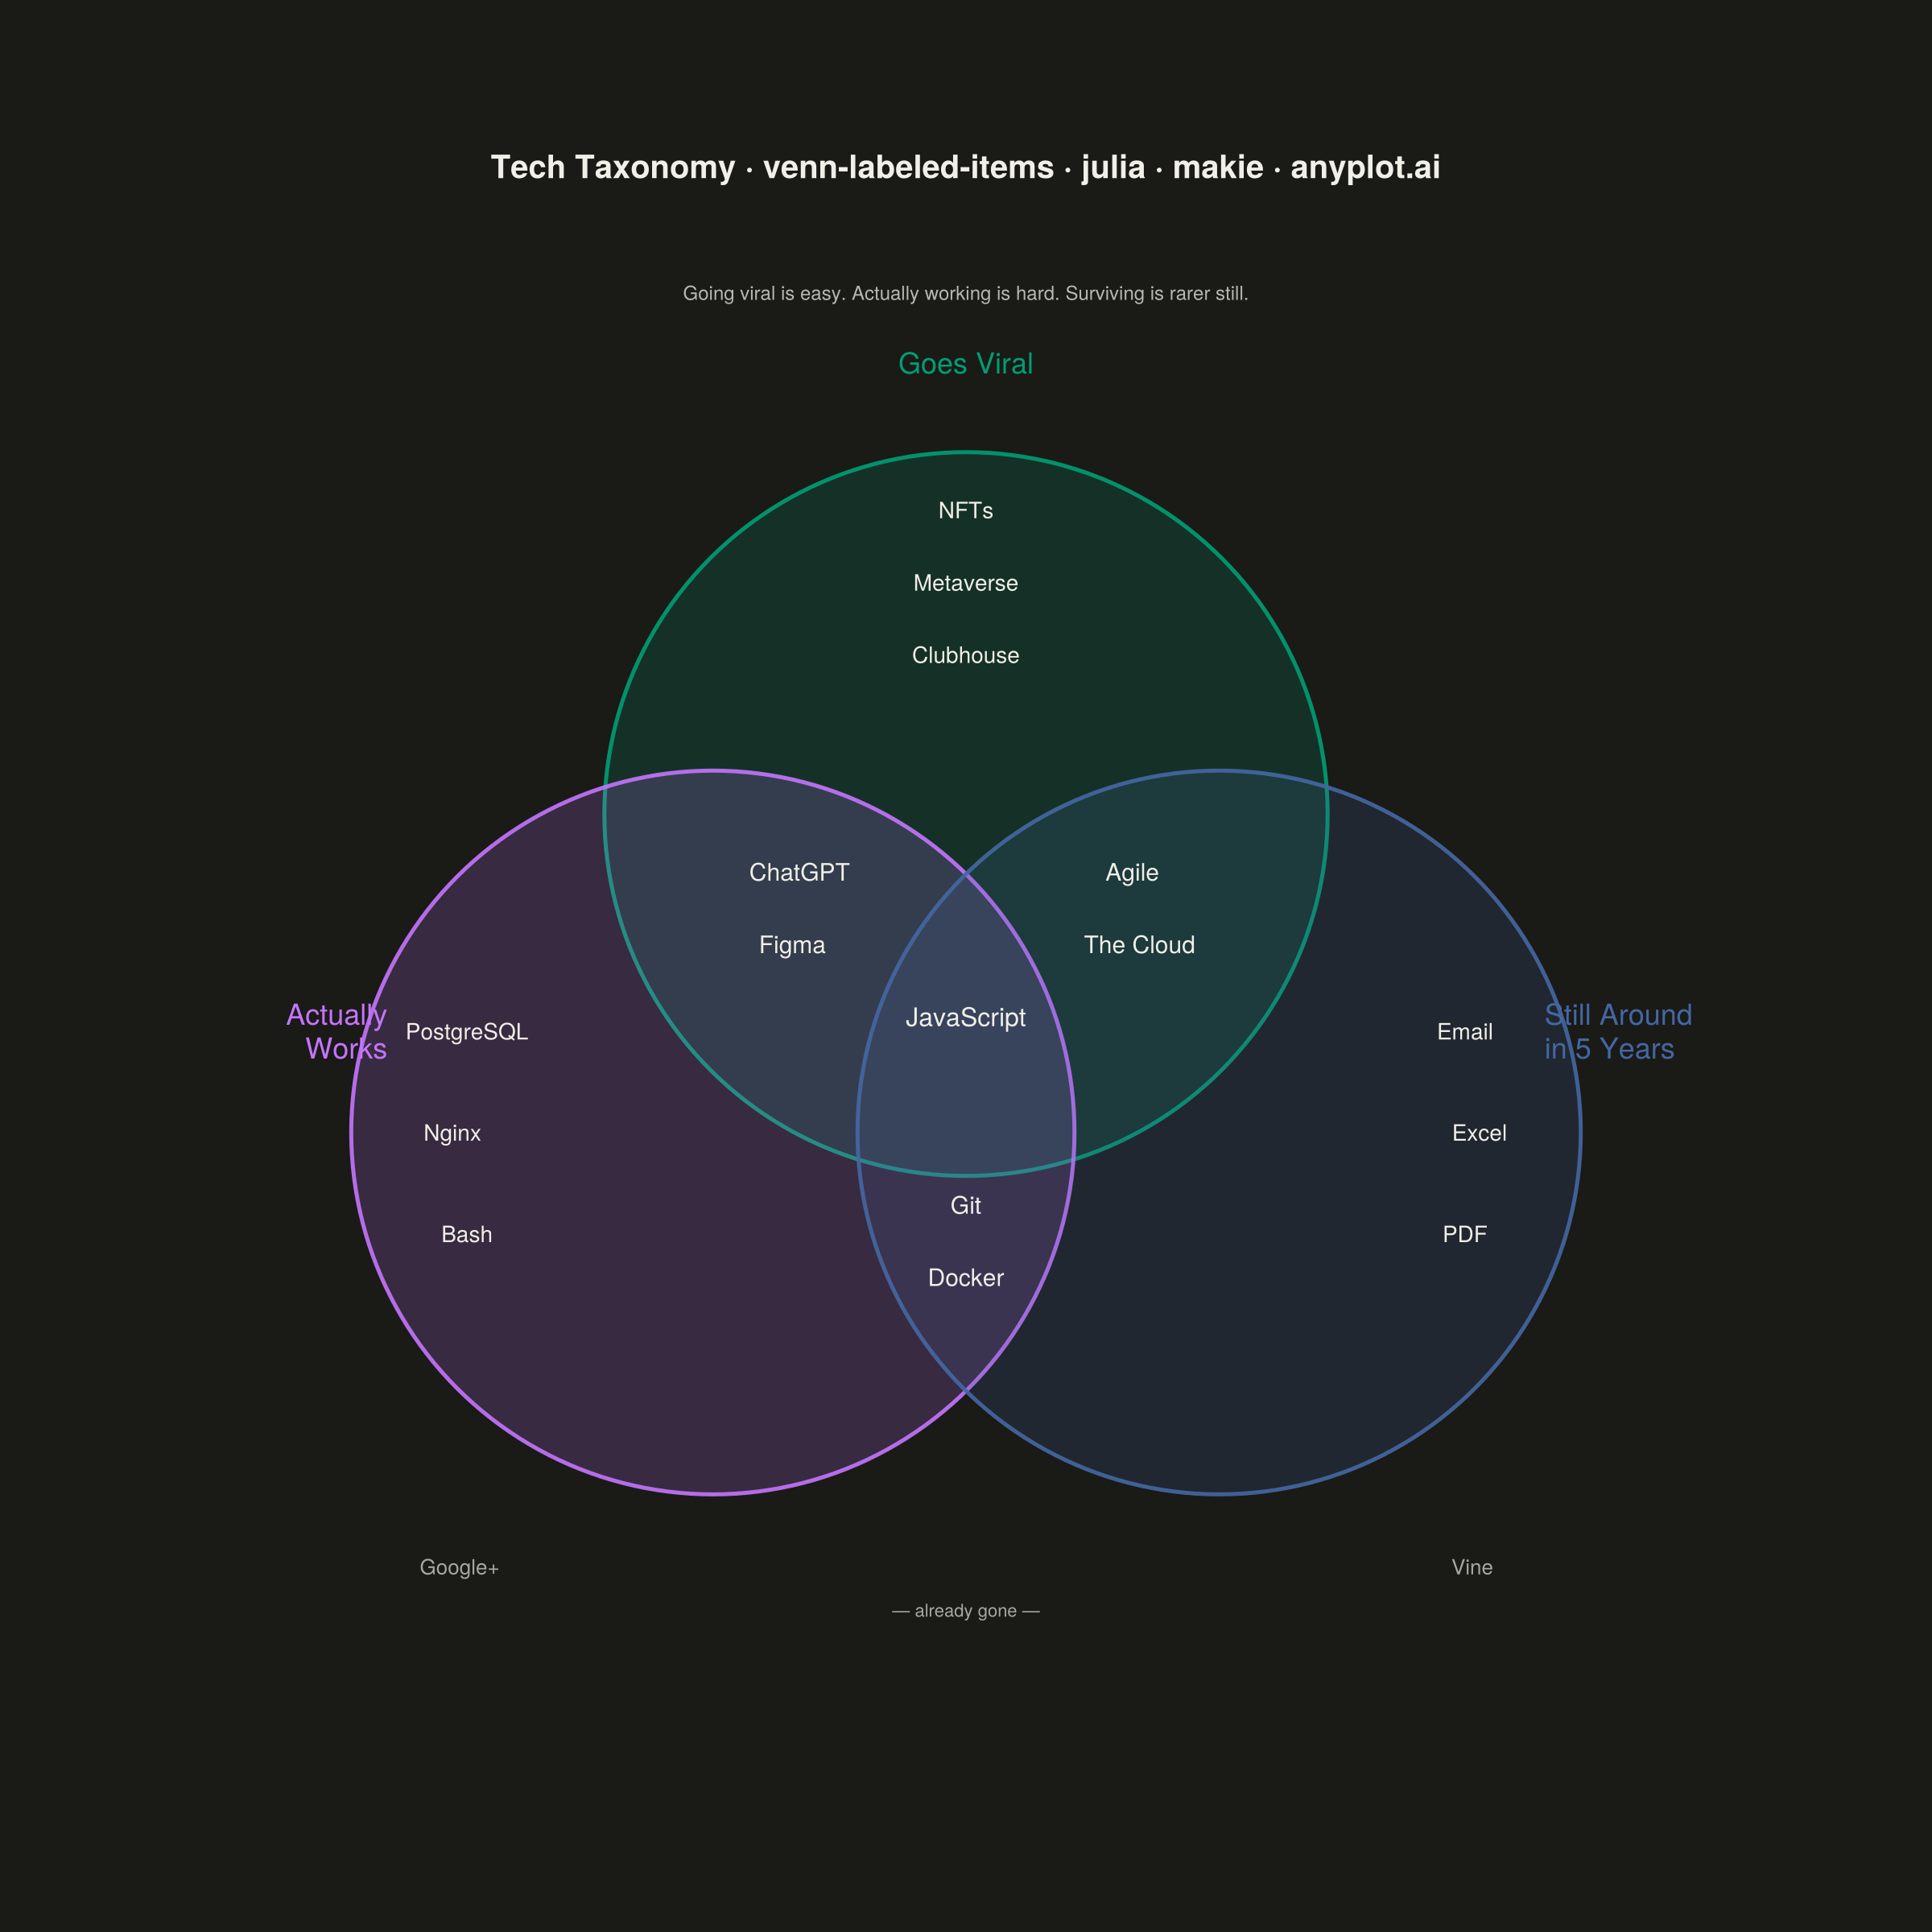
The same plot in 14 other libraries — Python: Altair, Bokeh, lets-plot, Matplotlib, Plotly, plotnine, Pygal, Seaborn; R: ggplot2; JavaScript: Chart.js, D3.js, Apache ECharts, Highcharts, MUI X Charts. Compare all 15 side by side: Chartgeist-Style Venn Diagram with Labeled Items in Python, R, Julia and JavaScript.
An editorial, WIRED "Chartgeist"-style three-circle Venn diagram where pop-culture items — products, people, trends, apps — are plotted as labeled points inside each zone rather than represented as numeric counts. Three overlapping circles define witty, opinionated categories (e.g., "Overhyped", "Actually Useful", "Secretly Loved"), and each item lives in exactly one of the seven interior regions (or outside all circles). Unlike a classic proportional Venn, the "data" here is categorical set-membership plus a human label, making the plot ideal for commentary, taxonomy, and discussion rather than quantitative analysis.
# anyplot.ai
# venn-labeled-items: Chartgeist-Style Venn Diagram with Labeled Items
# Library: makie 0.21.9 | Julia 1.11.9
# Quality: 85/100 | Created: 2026-06-25

using CairoMakie
using Colors
using Random

Random.seed!(42)

const THEME       = get(ENV, "ANYPLOT_THEME", "light")
const PAGE_BG     = THEME == "light" ? colorant"#FAF8F1" : colorant"#1A1A17"
const ELEVATED_BG = THEME == "light" ? colorant"#FFFDF6" : colorant"#242420"
const INK         = THEME == "light" ? colorant"#1A1A17" : colorant"#F0EFE8"
const INK_SOFT    = THEME == "light" ? colorant"#4A4A44" : colorant"#B8B7B0"
const INK_MUTED   = THEME == "light" ? colorant"#6B6A63" : colorant"#A8A79F"

const IMPRINT_PALETTE = [
    colorant"#009E73",  # 1 brand green
    colorant"#C475FD",  # 2 lavender
    colorant"#4467A3",  # 3 blue
    colorant"#BD8233",
    colorant"#AE3030",
    colorant"#2ABCCD",
    colorant"#954477",
    colorant"#99B314",
]

# Circle geometry (data-unit coordinates, range 0–1)
const r    = 0.25f0
const CX_A = 0.50f0;  const CY_A = 0.62f0   # top: "Goes Viral"
const CX_B = 0.325f0; const CY_B = 0.40f0   # bottom-left: "Actually Works"
const CX_C = 0.675f0; const CY_C = 0.40f0   # bottom-right: "Still Around in 5 Years"

function circle_poly(cx, cy, r; n=200)
    θ = range(0, 2π, length=n + 1)
    return Point2f.(cx .+ r .* cos.(θ), cy .+ r .* sin.(θ))
end

const col_A = IMPRINT_PALETTE[1]   # green — Goes Viral
const col_B = IMPRINT_PALETTE[2]   # lavender — Actually Works
const col_C = IMPRINT_PALETTE[3]   # blue — Still Around in 5 Years

# Items: (x, y, label, overlap) — overlap: 0=outside, 1=single-circle, 2=pair, 3=triple
const items = [
    (0.50f0,  0.83f0, "NFTs",         1),
    (0.50f0,  0.78f0, "Metaverse",    1),
    (0.50f0,  0.73f0, "Clubhouse",    1),
    (0.155f0, 0.47f0, "PostgreSQL",   1),
    (0.145f0, 0.40f0, "Nginx",        1),
    (0.155f0, 0.33f0, "Bash",         1),
    (0.845f0, 0.47f0, "Email",        1),
    (0.855f0, 0.40f0, "Excel",        1),
    (0.845f0, 0.33f0, "PDF",          1),
    (0.385f0, 0.58f0, "ChatGPT",      2),
    (0.38f0,  0.53f0, "Figma",        2),
    (0.615f0, 0.58f0, "Agile",        2),
    (0.62f0,  0.53f0, "The Cloud",    2),
    (0.50f0,  0.35f0, "Git",          2),
    (0.50f0,  0.30f0, "Docker",       2),
    (0.50f0,  0.48f0, "JavaScript",   3),
    (0.15f0,  0.10f0, "Google+",      0),
    (0.85f0,  0.10f0, "Vine",         0),
]

const title_str    = "Tech Taxonomy · venn-labeled-items · julia · makie · anyplot.ai"
const subtitle_str = "Going viral is easy. Actually working is hard. Surviving is rarer still."

fig = Figure(
    resolution      = (1200, 1200),
    fontsize        = 14,
    backgroundcolor = PAGE_BG,
)

ax = Axis(
    fig[1, 1];
    title           = title_str,
    titlesize       = 20,
    titlecolor      = INK,
    backgroundcolor = PAGE_BG,
    aspect          = DataAspect(),
)

xlims!(ax, -0.15f0, 1.15f0)
ylims!(ax, -0.05f0, 1.05f0)
hidexdecorations!(ax)
hideydecorations!(ax)
hidespines!(ax)

# Three Venn circles: semi-transparent fill + coloured outline
poly!(ax, circle_poly(CX_A, CY_A, r);
      color = (col_A, 0.18f0), strokecolor = (col_A, 0.90f0), strokewidth = 2.5f0)
poly!(ax, circle_poly(CX_B, CY_B, r);
      color = (col_B, 0.18f0), strokecolor = (col_B, 0.90f0), strokewidth = 2.5f0)
poly!(ax, circle_poly(CX_C, CY_C, r);
      color = (col_C, 0.18f0), strokecolor = (col_C, 0.90f0), strokewidth = 2.5f0)

# Category labels — outside each circle on its outer edge
text!(ax, CX_A, CY_A + r + 0.05f0;
      text = "Goes Viral", color = col_A,
      align = (:center, :bottom), fontsize = 18)
text!(ax, CX_B - r * 0.70f0 - 0.05f0, CY_B + 0.07f0;
      text = "Actually\nWorks", color = col_B,
      align = (:right, :center), fontsize = 18)
text!(ax, CX_C + r * 0.70f0 + 0.05f0, CY_C + 0.07f0;
      text = "Still Around\nin 5 Years", color = col_C,
      align = (:left, :center), fontsize = 18)

# Editorial subtitle — below the title, above the diagram
text!(ax, 0.50f0, 0.98f0;
      text = subtitle_str, color = INK_SOFT,
      align = (:center, :center), fontsize = 12)

# Item labels with visual hierarchy: larger font for items in more overlapping zones
for (x, y, label, overlap) in items
    fs    = overlap == 0 ? 13 : overlap == 1 ? 14 : overlap == 2 ? 15 : 16
    color = overlap == 0 ? INK_MUTED : INK
    text!(ax, x, y; text = label, color = color, align = (:center, :center), fontsize = fs)
end

# Separator for outside items
text!(ax, 0.50f0, 0.07f0;
      text = "— already gone —", color = INK_MUTED,
      align = (:center, :center), fontsize = 11)

save("plot-$(THEME).png", fig; px_per_unit = 2)
Runnable source as JSON, for any HTTP client: https://api.anyplot.ai/specs/venn-labeled-items/makie/code. Any spec id and library id listed in llms-full.txt fit the same URL shape; every URL below is complete and callable.
{
  "spec_id": "venn-labeled-items",
  "language": "julia",
  "library": "makie",
  "page": "https://anyplot.ai/venn-labeled-items/julia/makie",
  "hub": "https://anyplot.ai/venn-labeled-items",
  "code_json": "https://api.anyplot.ai/specs/venn-labeled-items/makie/code",
  "spec_json": "https://api.anyplot.ai/specs/venn-labeled-items",
  "render_light_png": "https://storage.googleapis.com/anyplot-images/plots/venn-labeled-items/julia/makie/plot-light.png",
  "render_dark_png": "https://storage.googleapis.com/anyplot-images/plots/venn-labeled-items/julia/makie/plot-dark.png",
  "quality_score": 85.0,
  "license": "MIT",
  "guide": "https://anyplot.ai/llms.txt"
}
Part of Chartgeist-Style Venn Diagram with Labeled Items on anyplot.ai.