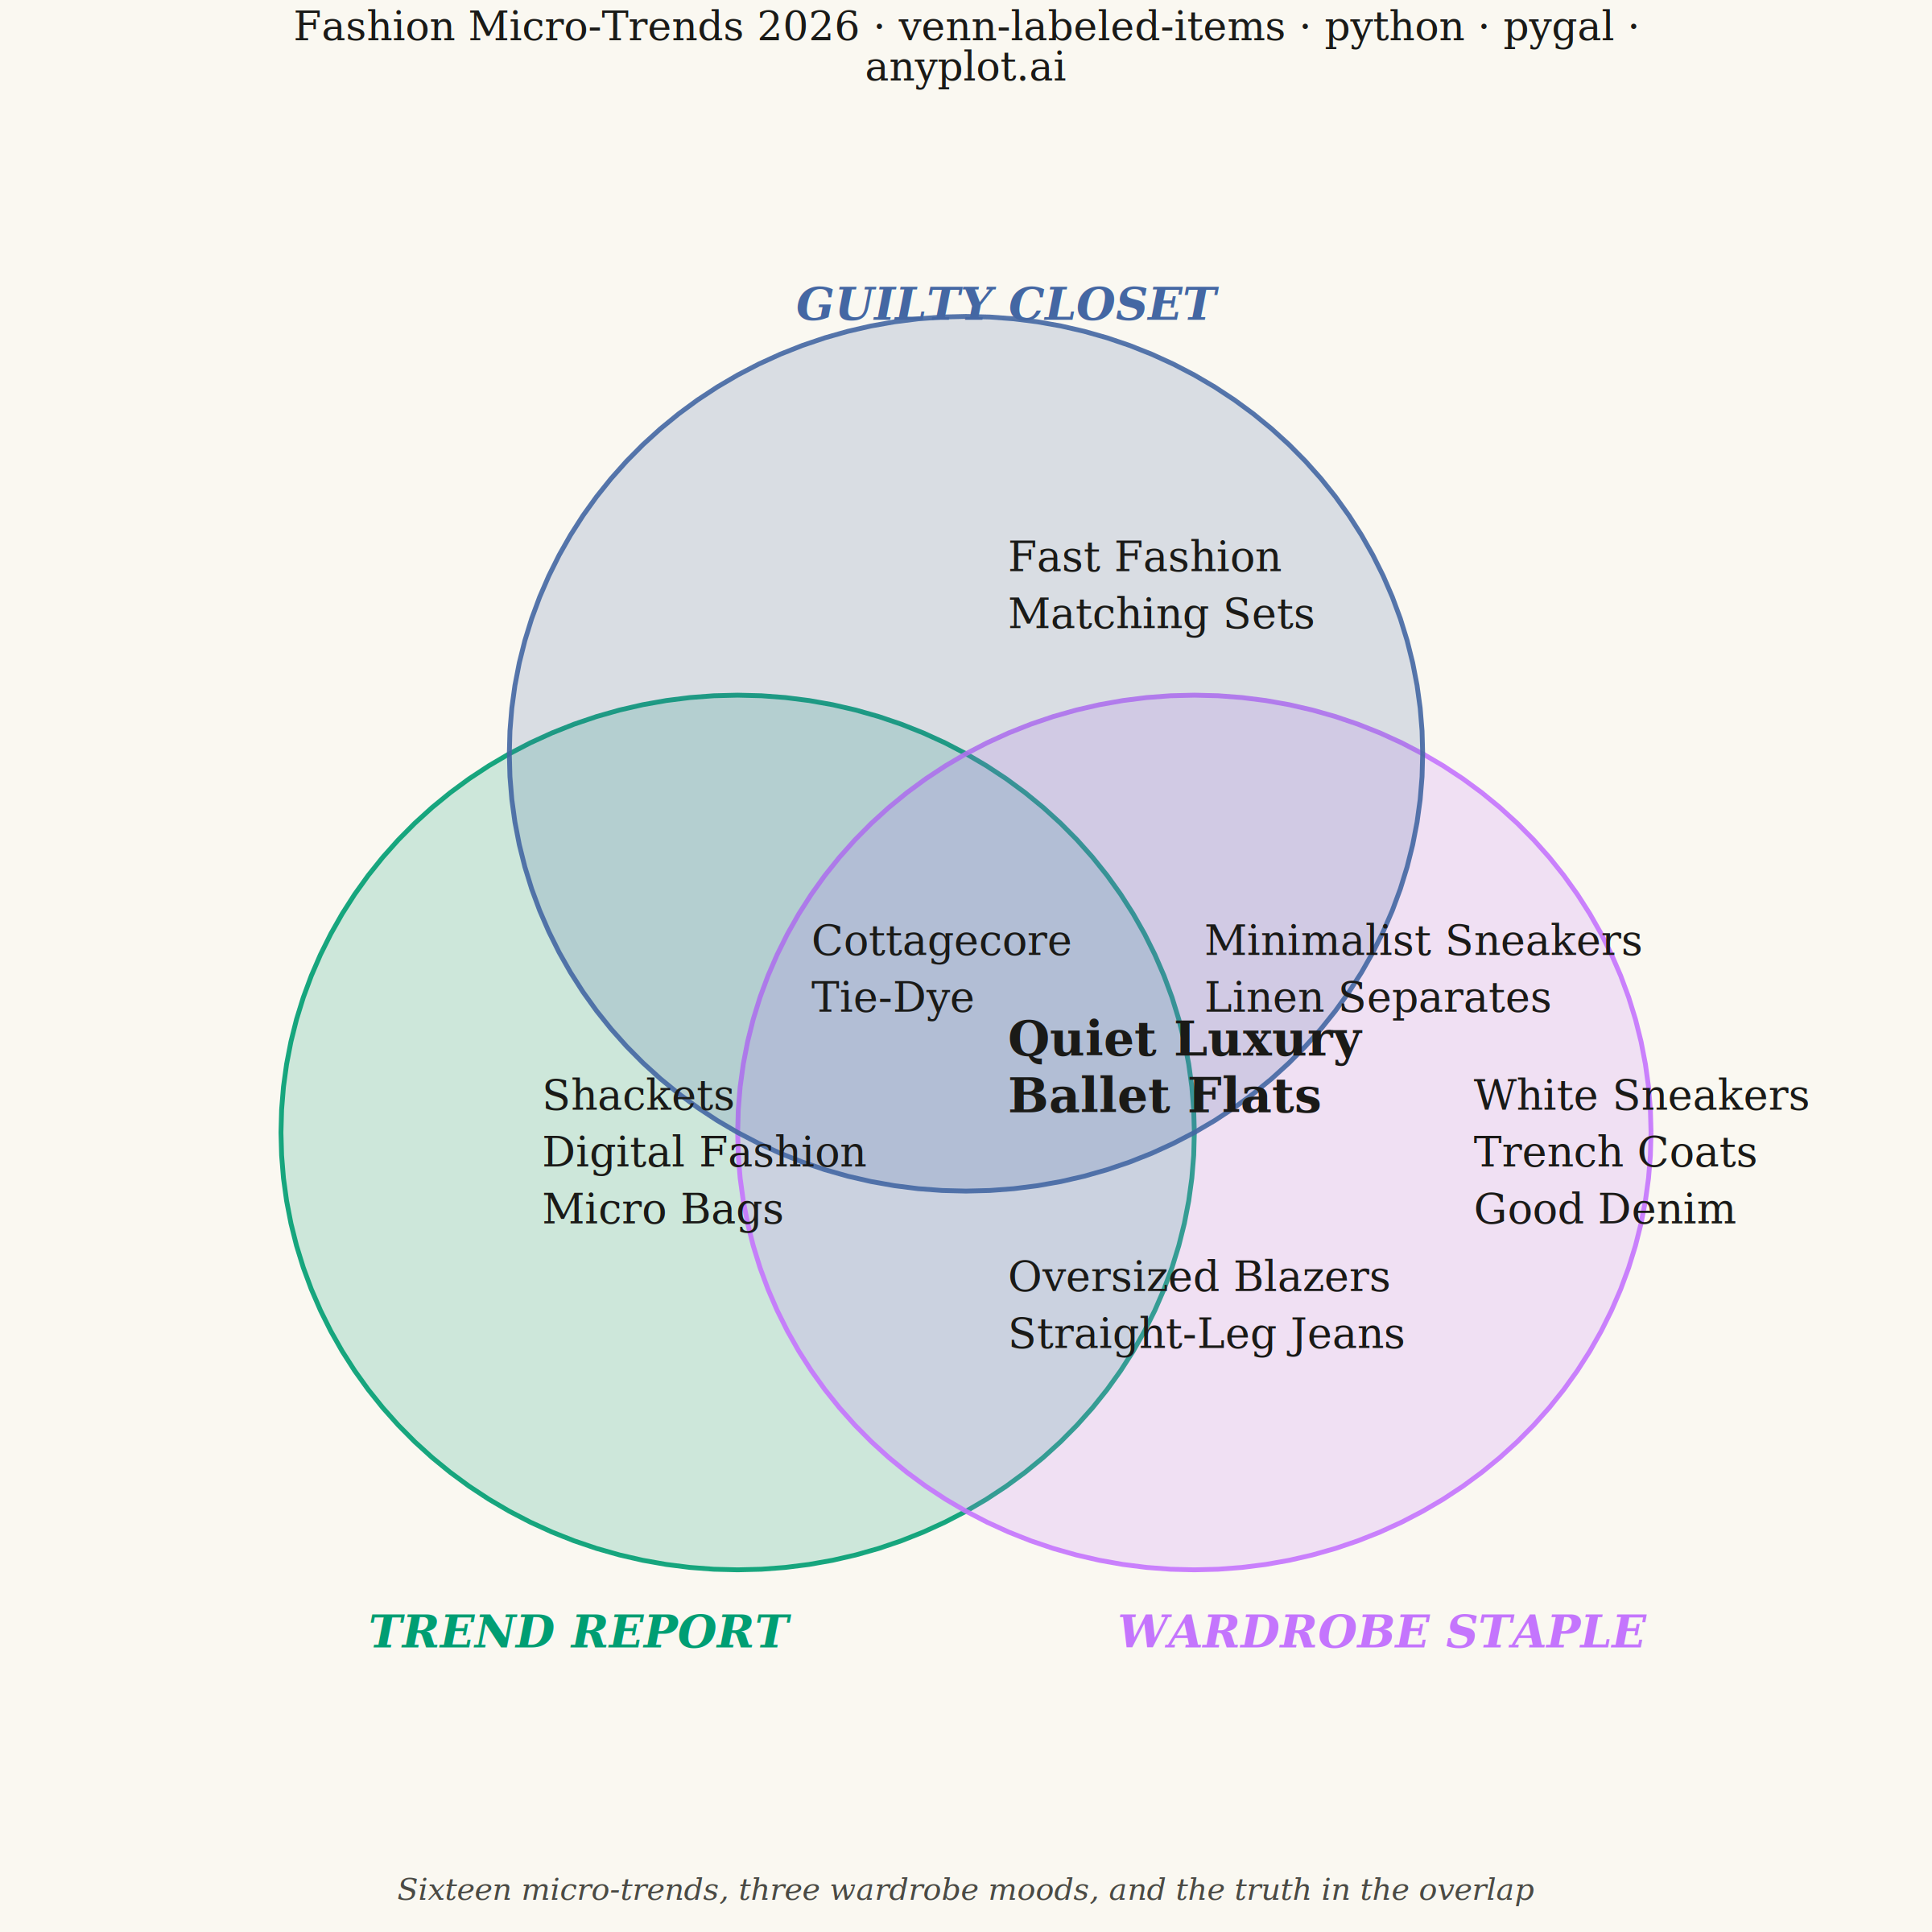
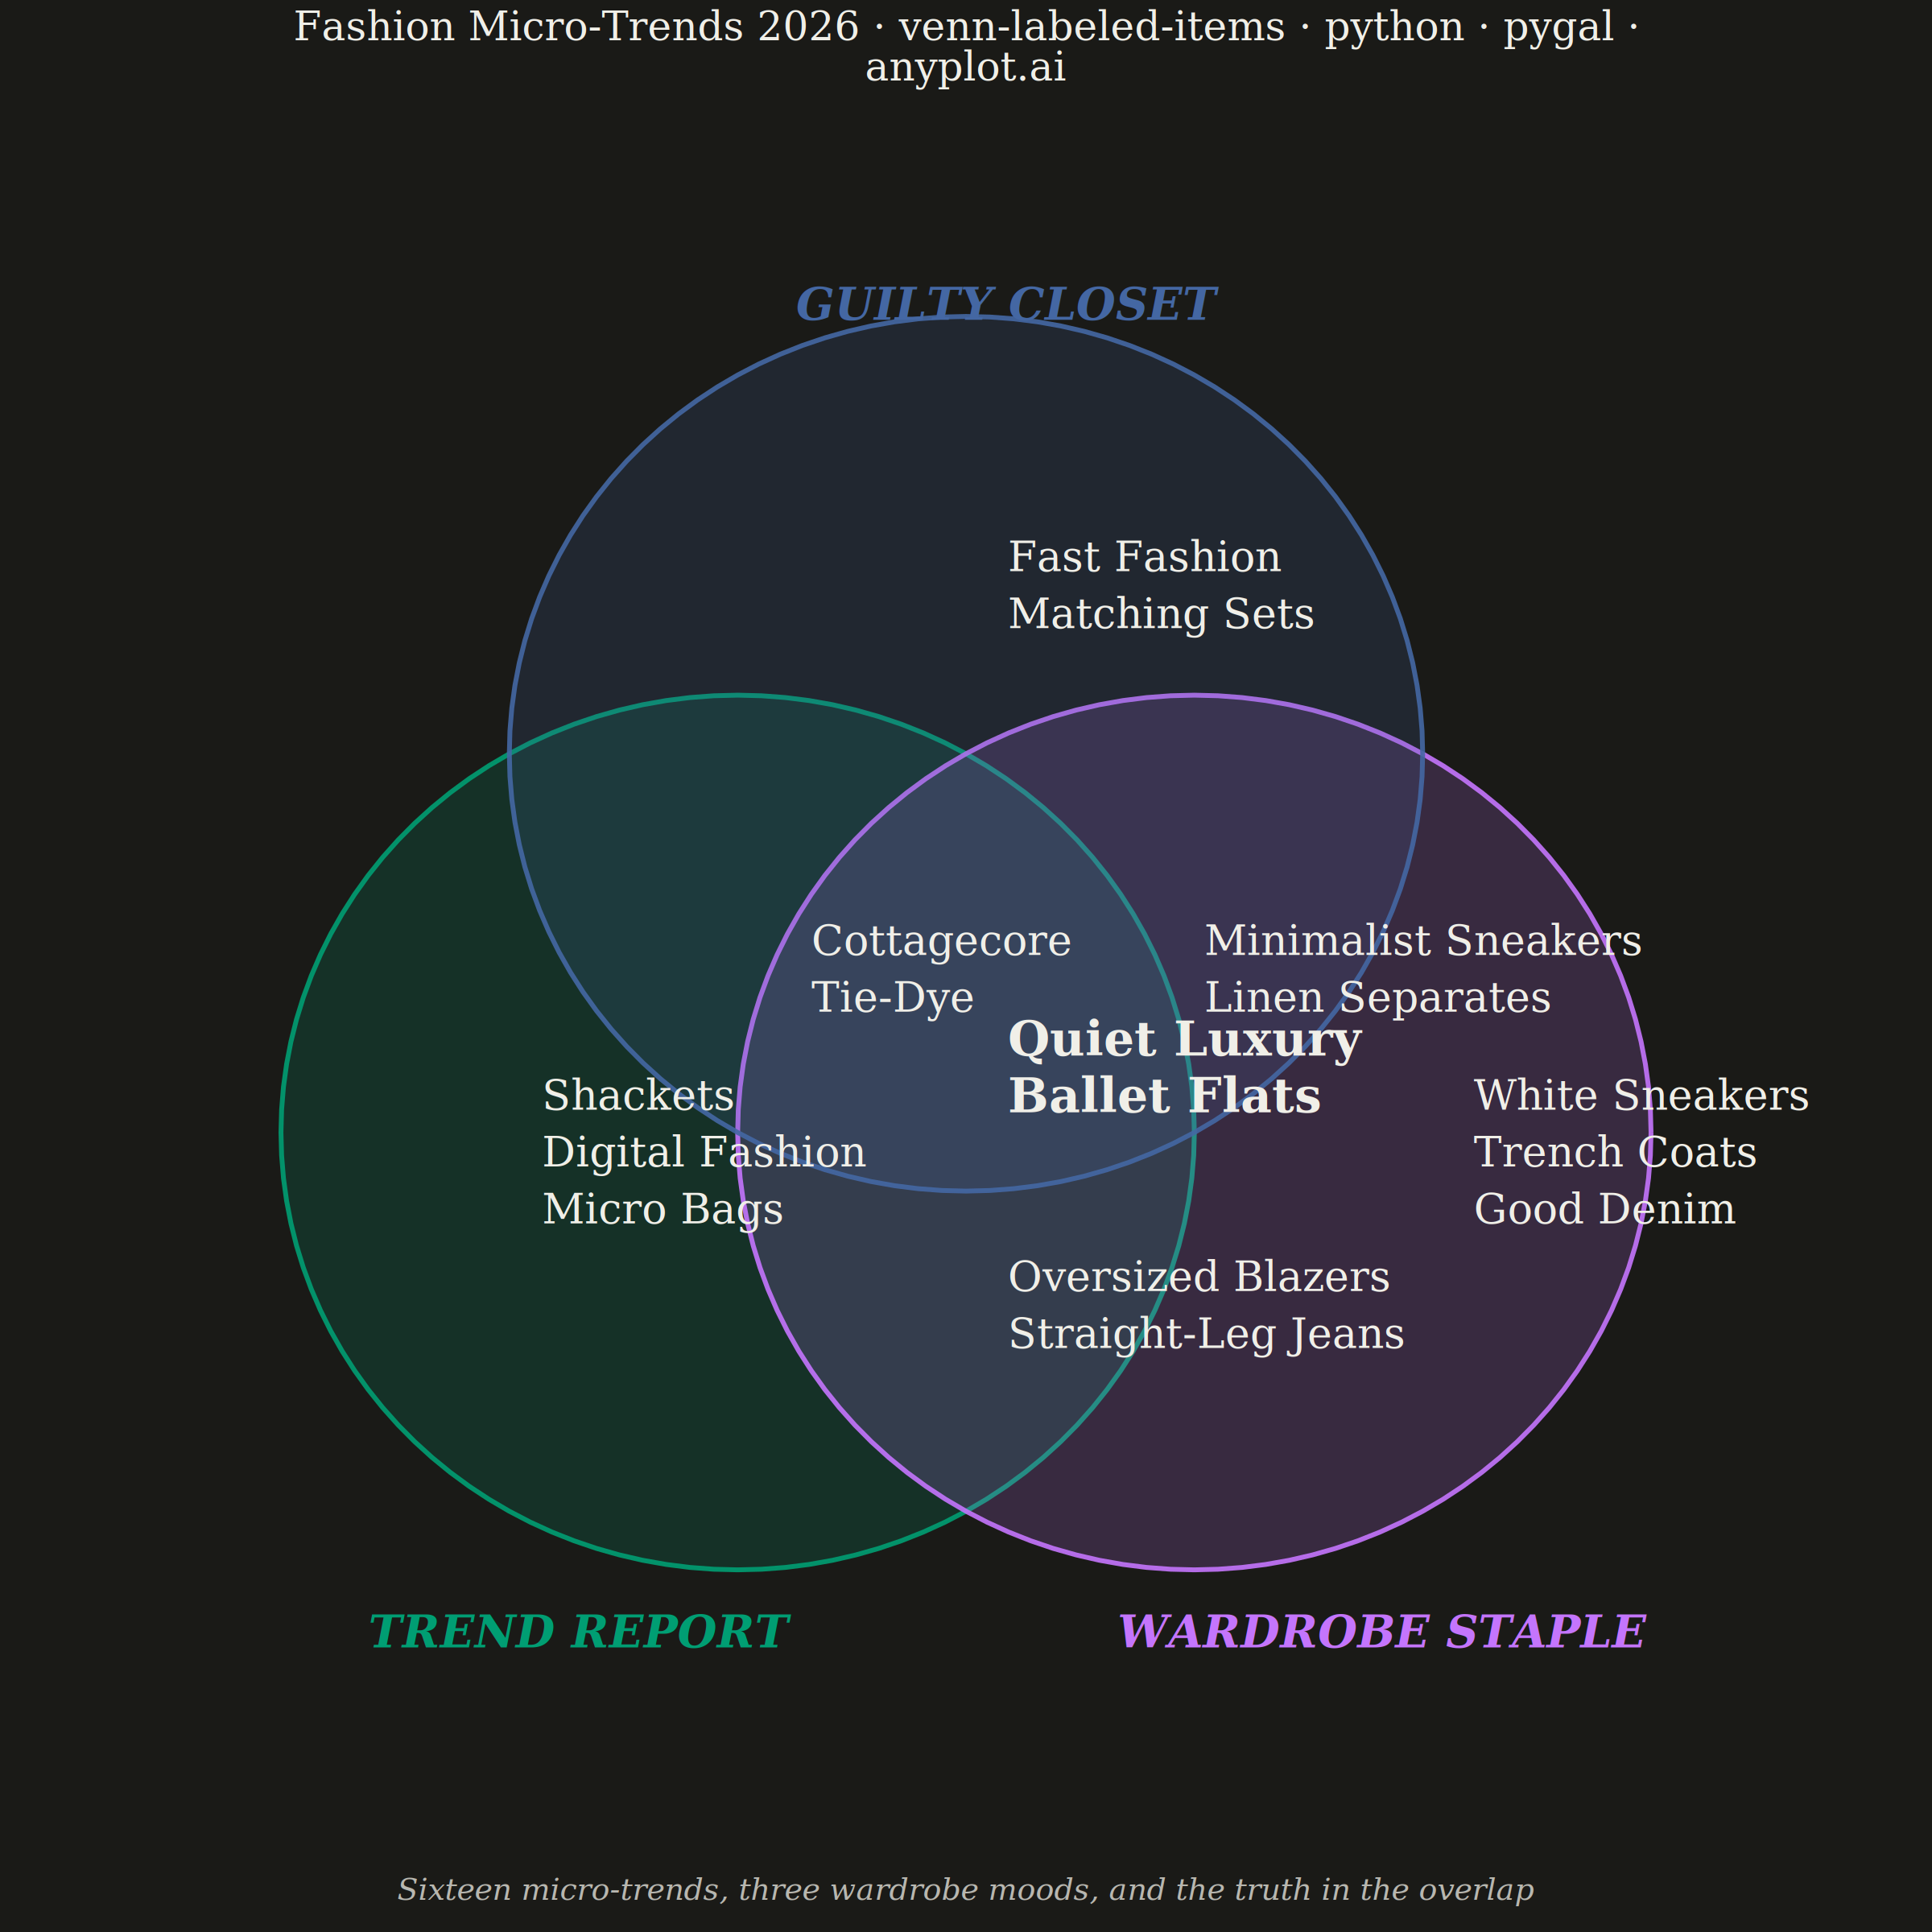
An editorial, WIRED "Chartgeist"-style three-circle Venn diagram where pop-culture items — products, people, trends, apps — are plotted as labeled points inside each zone rather than represented as numeric counts. Three overlapping circles define witty, opinionated categories (e.g., "Overhyped", "Actually Useful", "Secretly Loved"), and each item lives in exactly one of the seven interior regions (or outside all circles). Unlike a classic proportional Venn, the "data" here is categorical set-membership plus a human label, making the plot ideal for commentary, taxonomy, and discussion rather than quantitative analysis.
""" anyplot.ai
venn-labeled-items: Chartgeist-Style Venn Diagram with Labeled Items
Library: pygal 3.1.3 | Python 3.13.14
Quality: 84/100 | Updated: 2026-06-25
"""

import importlib
import math
import os
import re
import sys
from collections import defaultdict


# Drop the script directory from sys.path so the `pygal` package resolves, not this file
sys.path[:] = [p for p in sys.path if os.path.abspath(p or ".") != os.path.dirname(os.path.abspath(__file__))]
pygal = importlib.import_module("pygal")
Style = importlib.import_module("pygal.style").Style
cairosvg = importlib.import_module("cairosvg")


# Theme tokens
THEME = os.getenv("ANYPLOT_THEME", "light")
PAGE_BG = "#FAF8F1" if THEME == "light" else "#1A1A17"
INK = "#1A1A17" if THEME == "light" else "#F0EFE8"
INK_SOFT = "#4A4A44" if THEME == "light" else "#B8B7B0"
INK_MUTED = "#6B6A63" if THEME == "light" else "#A8A79F"

# Imprint palette — positions 1–3
COLOR_A = "#009E73"  # brand green
COLOR_B = "#C475FD"  # lavender
COLOR_C = "#4467A3"  # blue

# Symmetric three-circle Venn: equilateral triangle of centers (apex up)
RADIUS = 1.0
OFFSET = RADIUS / math.sqrt(3)
ax, ay = -OFFSET * math.sin(math.radians(60)), -OFFSET * math.cos(math.radians(60))
bx, by = OFFSET * math.sin(math.radians(60)), -OFFSET * math.cos(math.radians(60))
cx, cy = 0.0, OFFSET

circles = [
    {
        "name": "TREND REPORT",
        "color": COLOR_A,
        "center": (ax, ay),
        "label_xy": (ax - 0.90, ay - 1.05),
        "anchor": "start",
    },
    {
        "name": "WARDROBE STAPLE",
        "color": COLOR_B,
        "center": (bx, by),
        "label_xy": (bx + 0.90, by - 1.05),
        "anchor": "end",
    },
    {"name": "GUILTY CLOSET", "color": COLOR_C, "center": (cx, cy), "label_xy": (cx, cy + 1.12), "anchor": "middle"},
]

# Fashion micro-trends distributed across the seven interior zones
items_raw = [
    ("Shackets", "A"),
    ("Digital Fashion", "A"),
    ("Micro Bags", "A"),
    ("White Sneakers", "B"),
    ("Trench Coats", "B"),
    ("Good Denim", "B"),
    ("Fast Fashion", "C"),
    ("Matching Sets", "C"),
    ("Oversized Blazers", "AB"),
    ("Straight-Leg Jeans", "AB"),
    ("Cottagecore", "AC"),
    ("Tie-Dye", "AC"),
    ("Minimalist Sneakers", "BC"),
    ("Linen Separates", "BC"),
    ("Quiet Luxury", "ABC"),
    ("Ballet Flats", "ABC"),
]

# ABC zone items that receive bold emphasis (most editorially interesting intersection)
ABC_ITEMS = {"Quiet Luxury", "Ballet Flats"}

# Centroids of each Venn region in chart-data units
zone_centers = {
    "A": (ax - 0.52, ay + 0.05),
    "B": (bx + 0.52, by + 0.05),
    "C": (cx, cy + 0.48),
    "AB": (0.0, by - 0.30),
    "AC": (-0.43, 0.18),
    "BC": (0.43, 0.18),
    "ABC": (0.0, -0.05),
}

LINE_HEIGHT = 0.13
zone_to_items = defaultdict(list)
for label, zone in items_raw:
    zone_to_items[zone].append(label)

item_points = []
for zone, labels in zone_to_items.items():
    zx, zy = zone_centers[zone]
    n = len(labels)
    start_y = zy + (n - 1) * LINE_HEIGHT / 2
    for i, label in enumerate(labels):
        item_points.append({"value": (zx, start_y - i * LINE_HEIGHT), "label": label})


def circle_outline(center, r, n=120):
    cx0, cy0 = center
    return [(cx0 + r * math.cos(2 * math.pi * i / n), cy0 + r * math.sin(2 * math.pi * i / n)) for i in range(n + 1)]


custom_style = Style(
    background=PAGE_BG,
    plot_background=PAGE_BG,
    foreground=INK,
    foreground_strong=INK,
    foreground_subtle=INK_MUTED,
    colors=(COLOR_A, COLOR_B, COLOR_C, INK, INK, INK, INK),
    opacity="1",
    opacity_hover="1",
    stroke_width=5,
    stroke_opacity=".90",
    stroke_opacity_hover=".90",
    title_font_size=50,
    label_font_size=22,
    major_label_font_size=22,
    legend_font_size=22,
    value_font_size=52,
    value_label_font_size=52,
    title_font_family="serif",
    label_font_family="serif",
    major_label_font_family="serif",
    legend_font_family="serif",
    value_font_family="serif",
    value_label_font_family="serif",
    transition="0",
)

# Canvas: 2400×2400 (square) — canonical pygal square size; tighter range fills more canvas
chart = pygal.XY(
    width=2400,
    height=2400,
    style=custom_style,
    title="Fashion Micro-Trends 2026 · venn-labeled-items · python · pygal · anyplot.ai",
    show_legend=False,
    show_x_labels=False,
    show_y_labels=False,
    show_x_guides=False,
    show_y_guides=False,
    show_minor_x_labels=False,
    show_minor_y_labels=False,
    xrange=(-2.0, 2.0),
    range=(-2.0, 2.0),
    margin=20,
    spacing=0,
    show_dots=True,
    dots_size=0,
    print_labels=True,
    print_values=False,
    pretty_print=True,
)

# Three circle outlines (one series per circle) — fills added via SVG post-processing
for c in circles:
    chart.add("", circle_outline(c["center"], RADIUS), stroke=True, fill=False, show_dots=False)

# Item names — text-only placement at zone centroids
chart.add("Items", item_points, stroke=False, show_dots=True)

# Category names — restyled by post-processor below
for c in circles:
    chart.add("", [{"value": c["label_xy"], "label": c["name"]}], stroke=False, show_dots=True)

svg = chart.render().decode("utf-8")


# Post-process: pygal cannot natively fill a closed polyline, so we patch the SVG directly.
def fill_circle_path(svg_text, serie_idx, color, opacity):
    pattern = re.compile(
        r'(<g class="series serie-' + str(serie_idx) + r' color-\d+">\s*<path[^>]*?)class="line reactive nofill"'
    )
    return pattern.sub(
        r'\1class="line reactive" style="fill:' + color + ";fill-opacity:" + str(opacity) + r';stroke-width:6"',
        svg_text,
        count=1,
    )


for idx, c in enumerate(circles):
    svg = fill_circle_path(svg, idx, c["color"], 0.18)


def restyle_label(svg_text, label_text, color, anchor, font_size):
    """Apply bold italic colored style to a category name label element."""
    pattern = re.compile(
        r"<text(\s+x=\"[^\"]*\"\s+y=\"[^\"]*\")\s+class=\"label\">" + re.escape(label_text) + r"</text>"
    )
    repl = (
        r'<text\1 class="label" style="font-size:'
        + str(font_size)
        + ";font-style:italic;font-weight:bold;text-anchor:"
        + anchor
        + ";fill:"
        + color
        + '">'
        + label_text
        + "</text>"
    )
    return pattern.sub(repl, svg_text, count=1)


for c in circles:
    svg = restyle_label(svg, c["name"], c["color"], c["anchor"], 56)

# Pygal auto-assigns white text for dark series colors — rewrite so labels use INK instead
svg = re.sub(r"(\.text-overlay \.color-\d+ text \{\s*fill:\s*)[^;}\s]+", r"\1" + INK, svg)
# Bump item label size from pygal's hardcoded 36px to the target 52px
svg = re.sub(r"(\.text-overlay text\.label \{[^}]*font-size:\s*)\d+px", r"\g<1>52px", svg)


def emphasize_abc(svg_text, item_label):
    """Bold ABC triple-intersection items to visually distinguish the most interesting zone."""
    return re.sub(
        r"(<text)(\s+x=\"[^\"]*\"\s+y=\"[^\"]*\"\s+class=\"label\">)(" + re.escape(item_label) + r"</text>)",
        r'\1 style="font-weight:bold;font-size:60px"\2\3',
        svg_text,
    )


for item in ABC_ITEMS:
    svg = emphasize_abc(svg, item)

# Editorial subtitle injected at a fixed canvas position, theme-aware
subtitle = (
    '<g class="anyplot-subtitle"><text x="1200" y="2360" '
    'style="font-family:serif;font-style:italic;font-size:38px;fill:' + INK_SOFT + ';text-anchor:middle">'
    "Sixteen micro-trends, three wardrobe moods, and the truth in the overlap"
    "</text></g>"
)
svg = svg.replace("</svg>", subtitle + "</svg>")

# Save — interactive SVG embedded in HTML, plus rasterized PNG via cairosvg
with open(f"plot-{THEME}.svg", "w") as f:
    f.write(svg)

with open(f"plot-{THEME}.html", "w") as f:
    f.write("<!doctype html><html><body style='margin:0;background:" + PAGE_BG + "'>" + svg + "</body></html>")

cairosvg.svg2png(bytestring=svg.encode("utf-8"), write_to=f"plot-{THEME}.png", output_width=2400, output_height=2400)
Runnable source as JSON, for any HTTP client: https://api.anyplot.ai/specs/venn-labeled-items/pygal/code. Any spec id and library id listed in llms-full.txt fit the same URL shape; every URL below is complete and callable.
{
  "spec_id": "venn-labeled-items",
  "language": "python",
  "library": "pygal",
  "page": "https://anyplot.ai/venn-labeled-items/python/pygal",
  "hub": "https://anyplot.ai/venn-labeled-items",
  "code_json": "https://api.anyplot.ai/specs/venn-labeled-items/pygal/code",
  "spec_json": "https://api.anyplot.ai/specs/venn-labeled-items",
  "render_light_png": "https://storage.googleapis.com/anyplot-images/plots/venn-labeled-items/python/pygal/plot-light.png",
  "render_dark_png": "https://storage.googleapis.com/anyplot-images/plots/venn-labeled-items/python/pygal/plot-dark.png",
  "interactive_light_html": "https://storage.googleapis.com/anyplot-images/plots/venn-labeled-items/python/pygal/plot-light.html",
  "interactive_dark_html": "https://storage.googleapis.com/anyplot-images/plots/venn-labeled-items/python/pygal/plot-dark.html",
  "quality_score": 84.0,
  "license": "MIT",
  "guide": "https://anyplot.ai/llms.txt"
}
Part of Chartgeist-Style Venn Diagram with Labeled Items on anyplot.ai.