The same plot in 14 other libraries — JavaScript: Chart.js, D3.js, Apache ECharts, Highcharts; Python: Altair, Bokeh, lets-plot, Matplotlib, Plotly, plotnine, Pygal, Seaborn; R: ggplot2; Julia: Makie.jl. Compare all 15 side by side: Chartgeist-Style Venn Diagram with Labeled Items in Python, R, Julia and JavaScript.
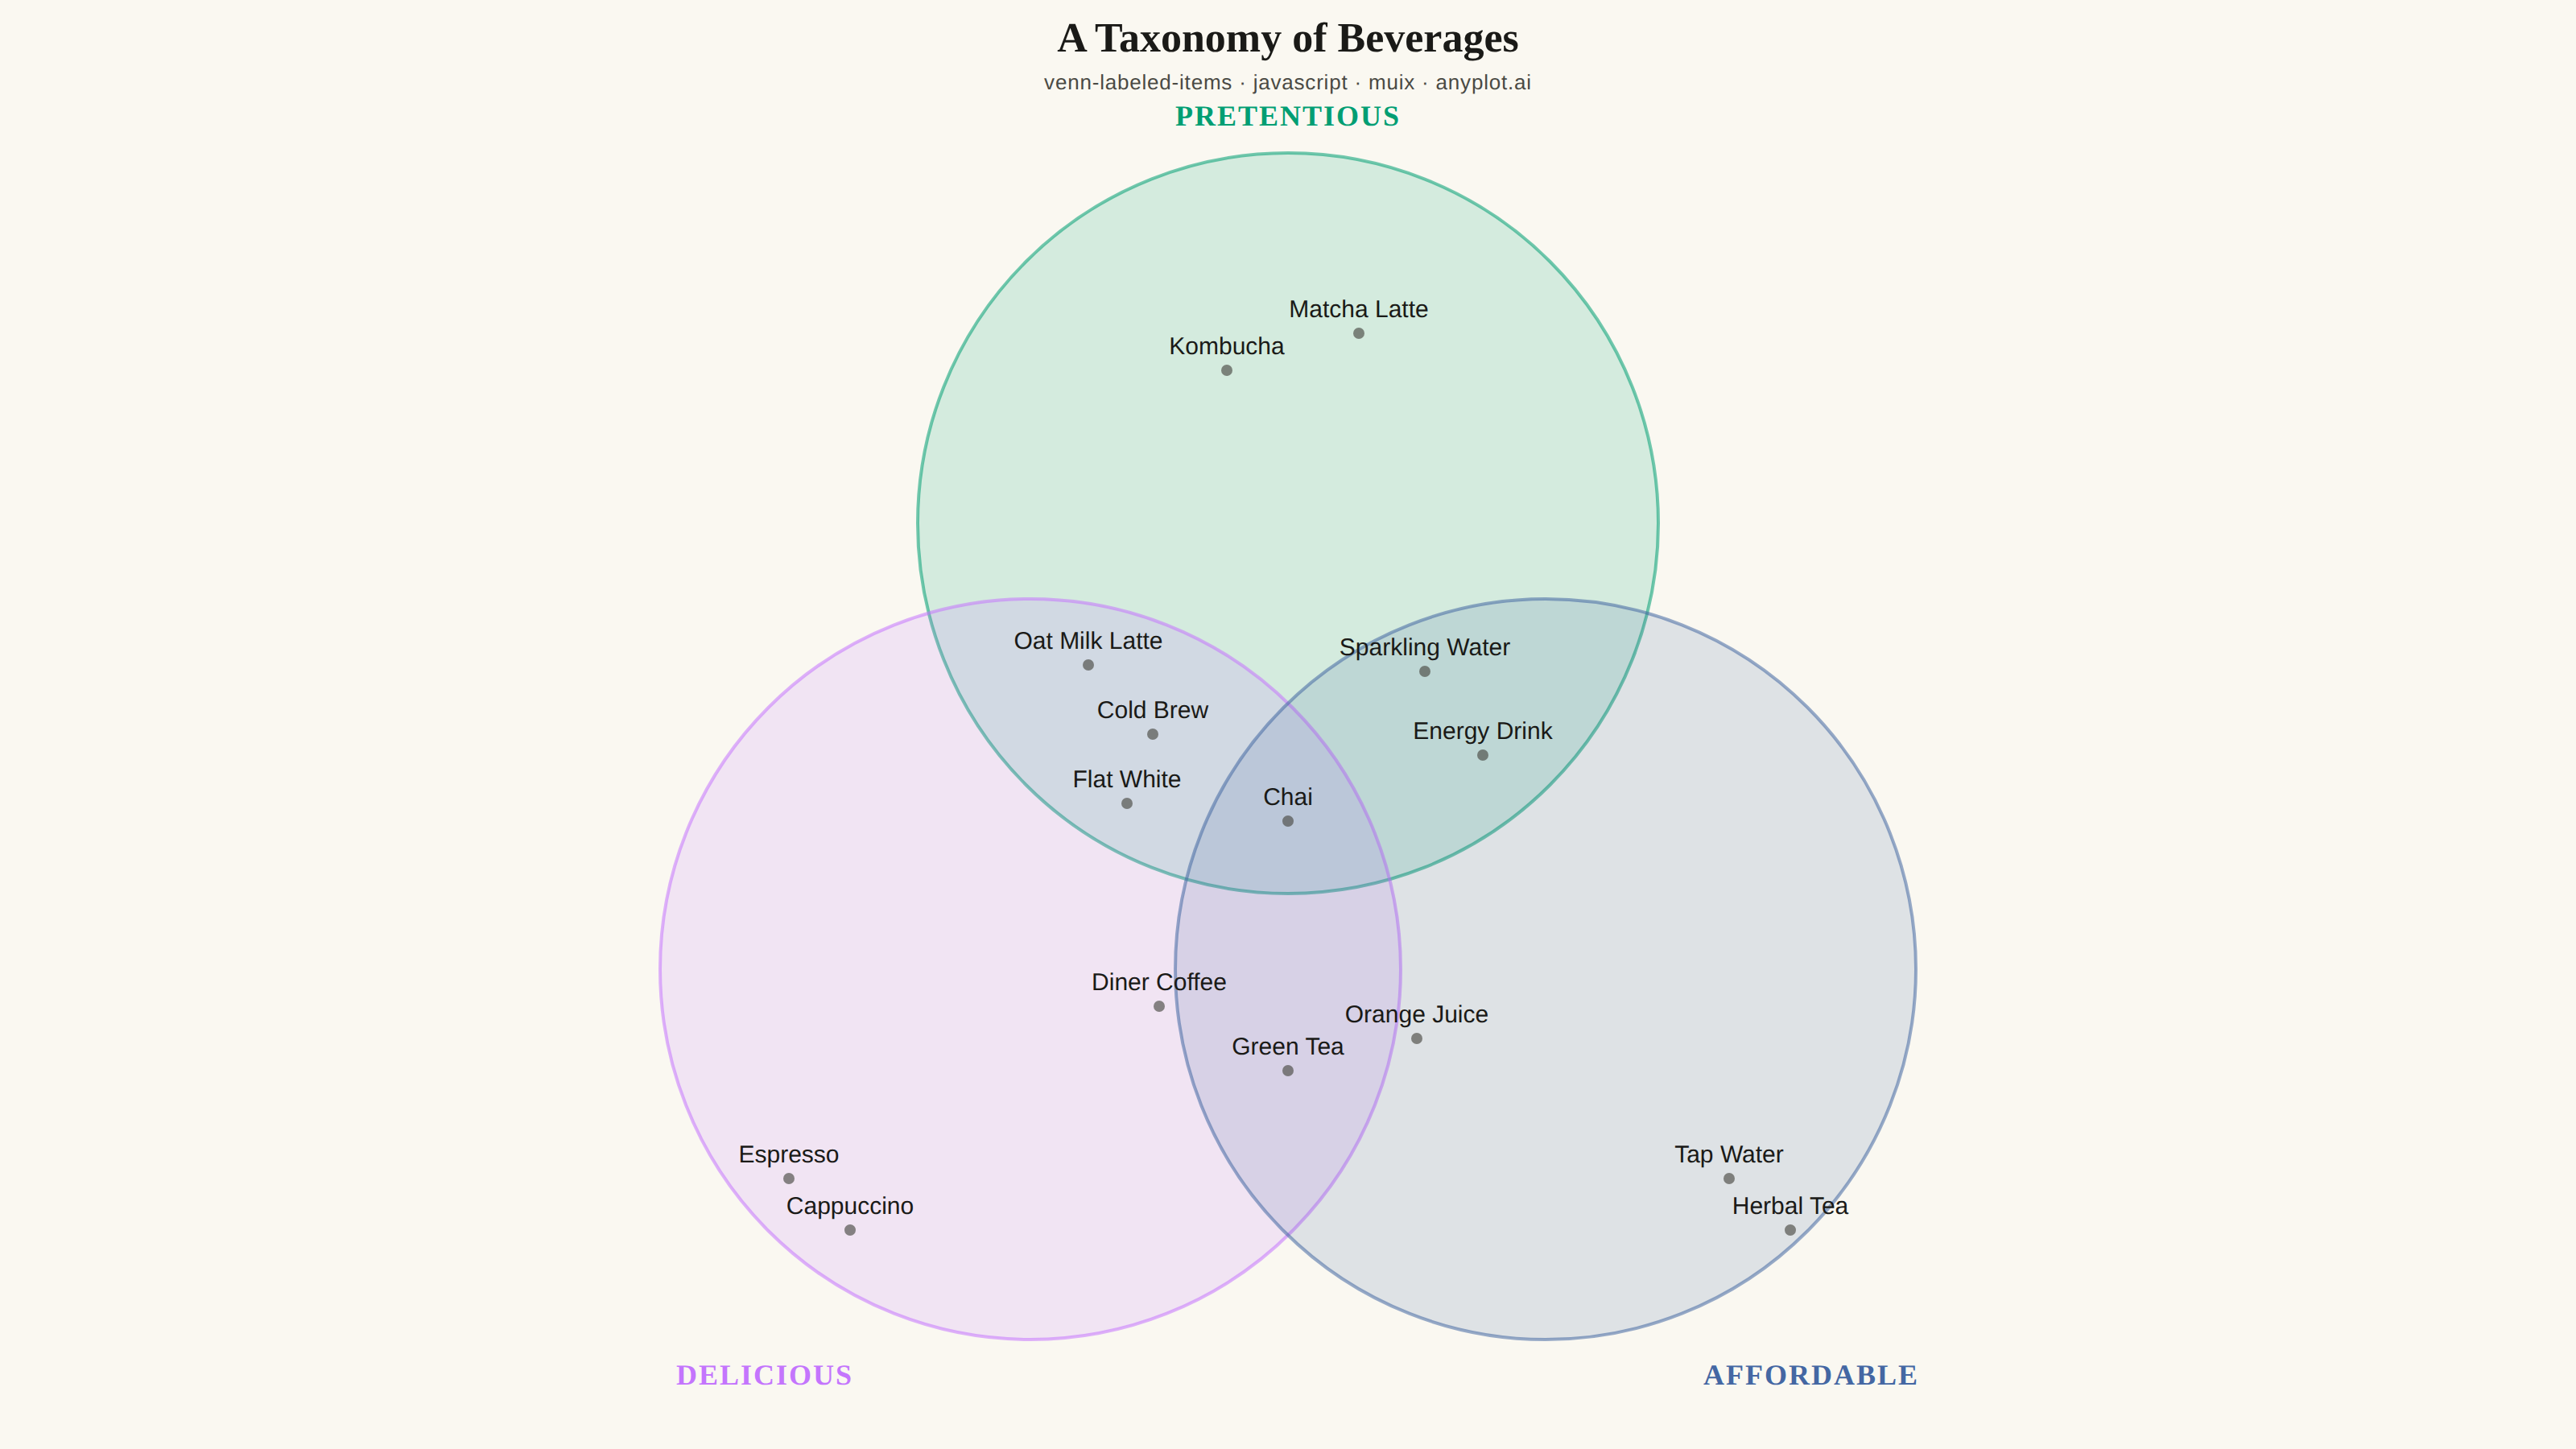
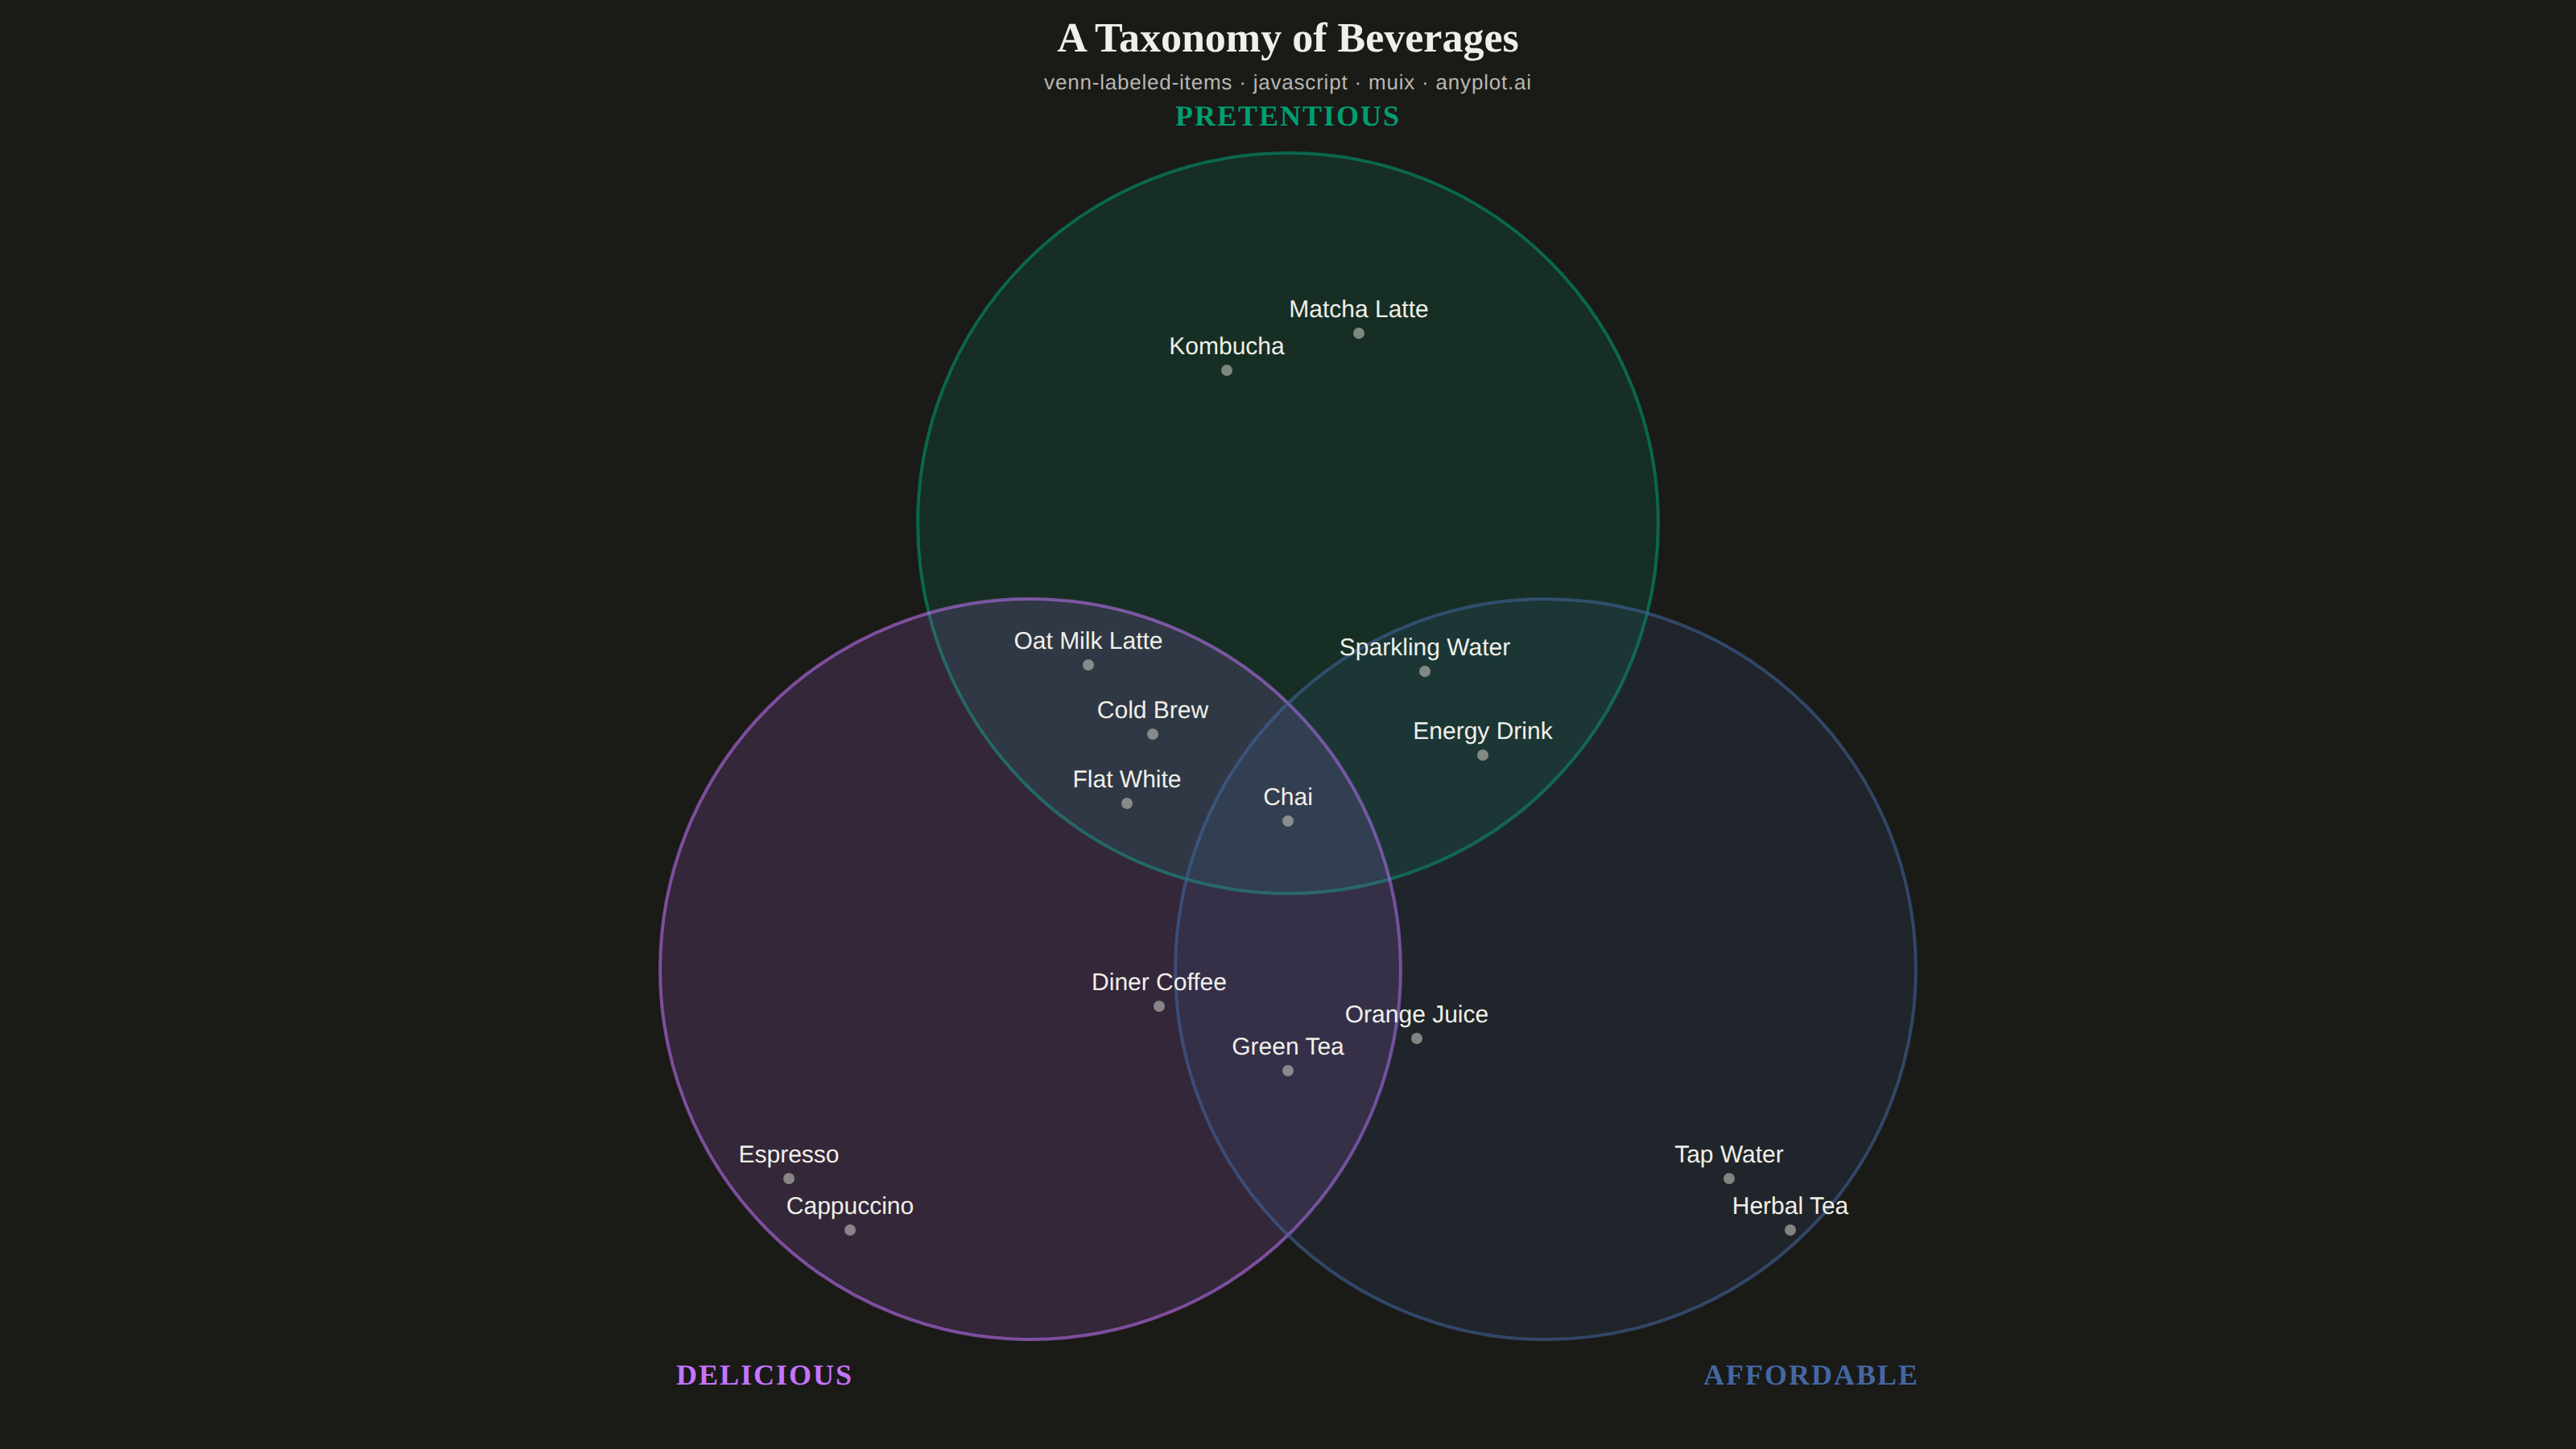
An editorial, WIRED "Chartgeist"-style three-circle Venn diagram where pop-culture items — products, people, trends, apps — are plotted as labeled points inside each zone rather than represented as numeric counts. Three overlapping circles define witty, opinionated categories (e.g., "Overhyped", "Actually Useful", "Secretly Loved"), and each item lives in exactly one of the seven interior regions (or outside all circles). Unlike a classic proportional Venn, the "data" here is categorical set-membership plus a human label, making the plot ideal for commentary, taxonomy, and discussion rather than quantitative analysis.
// anyplot.ai
// venn-labeled-items: Chartgeist-Style Venn Diagram with Labeled Items
// Library: muix 7.29.1 | JavaScript 22.22.3
// Quality: 84/100 | Created: 2026-06-25
//# anyplot-orientation: landscape
// anyplot.ai
// venn-labeled-items: Chartgeist-Style Venn Diagram with Labeled Items
// Library: MUI X Charts | React | Node 22
// License: @mui/x-charts — MIT (community). Pro/Premium are out of scope.
// Quality: pending | Created: 2026-06-25

import { ChartContainer } from "@mui/x-charts/ChartContainer";

const t = window.ANYPLOT_TOKENS;

// Venn circle radius and centres — equilateral triangle, d=320, r=230
// gives clear pairwise and triple overlaps with generous whitespace
const R = 230;

const CIRCLES = [
  { key: "A", name: "Pretentious", cx: 800, cy: 325, color: t.palette[0], lx: 800,  ly: 74  },
  { key: "B", name: "Delicious",   cx: 640, cy: 602, color: t.palette[1], lx: 475,  ly: 856 },
  { key: "C", name: "Affordable",  cx: 960, cy: 602, color: t.palette[2], lx: 1125, ly: 856 },
];

// Items — each placed at a coordinate that lies within its assigned zone only.
// Coordinates verified analytically against all three circle boundaries.
const ITEMS = [
  // A only
  { label: "Kombucha",        x: 762,  y: 230 },
  { label: "Matcha Latte",    x: 844,  y: 207 },
  // AB
  { label: "Oat Milk Latte",  x: 676,  y: 413 },
  { label: "Cold Brew",       x: 716,  y: 456 },
  { label: "Flat White",      x: 700,  y: 499 },
  // AC
  { label: "Sparkling Water", x: 885,  y: 417 },
  { label: "Energy Drink",    x: 921,  y: 469 },
  // B only
  { label: "Espresso",        x: 490,  y: 732 },
  { label: "Cappuccino",      x: 528,  y: 764 },
  // BC — spread x-coords to reduce crowding
  { label: "Diner Coffee",    x: 720,  y: 625 },
  { label: "Green Tea",       x: 800,  y: 665 },
  { label: "Orange Juice",    x: 880,  y: 645 },
  // C only
  { label: "Tap Water",       x: 1074, y: 732 },
  { label: "Herbal Tea",      x: 1112, y: 764 },
  // ABC
  { label: "Chai",            x: 800,  y: 510 },
];

export default function Chart() {
  const W = window.ANYPLOT_SIZE.width;
  const H = window.ANYPLOT_SIZE.height;

  return (
    <ChartContainer
      width={W}
      height={H}
      series={[]}
      margin={{ top: 0, bottom: 0, left: 0, right: 0 }}
      sx={{ background: t.pageBg, display: "block" }}
    >
      {/* Two-line editorial title */}
      <text
        x={W / 2}
        y={26}
        textAnchor="middle"
        dominantBaseline="middle"
        fontSize={26}
        fontWeight="700"
        fill={t.ink}
        fontFamily="Georgia, 'Times New Roman', serif"
      >
        A Taxonomy of Beverages
      </text>
      <text
        x={W / 2}
        y={52}
        textAnchor="middle"
        dominantBaseline="middle"
        fontSize={13}
        fill={t.inkSoft}
        fontFamily="Arial, Helvetica, sans-serif"
        style={{ letterSpacing: "0.4px" }}
      >
        venn-labeled-items · javascript · muix · anyplot.ai
      </text>

      {/* Venn circles — semi-transparent fills let overlap regions show through */}
      {CIRCLES.map(c => (
        <circle
          key={c.key}
          cx={c.cx}
          cy={c.cy}
          r={R}
          fill={c.color}
          fillOpacity={0.15}
          stroke={c.color}
          strokeOpacity={0.55}
          strokeWidth={2}
        />
      ))}

      {/* Category labels outside each circle, uppercase serif in circle colour */}
      {CIRCLES.map(c => (
        <text
          key={c.key + "-lbl"}
          x={c.lx}
          y={c.ly}
          textAnchor="middle"
          dominantBaseline="middle"
          fontSize={18}
          fontWeight="700"
          fill={c.color}
          fontFamily="Georgia, 'Times New Roman', serif"
          style={{ letterSpacing: "1px" }}
        >
          {c.name.toUpperCase()}
        </text>
      ))}

      {/* Item labels — bullet dot + text above it */}
      {ITEMS.map((item, i) => (
        <g key={i}>
          <circle
            cx={item.x}
            cy={item.y}
            r={3.5}
            fill={t.inkSoft}
            fillOpacity={0.65}
          />
          <text
            x={item.x}
            y={item.y - 10}
            textAnchor="middle"
            dominantBaseline="auto"
            fontSize={15}
            fill={t.ink}
            fontFamily="Arial, Helvetica, sans-serif"
          >
            {item.label}
          </text>
        </g>
      ))}
    </ChartContainer>
  );
}
Runnable source as JSON, for any HTTP client: https://api.anyplot.ai/specs/venn-labeled-items/muix/code. Any spec id and library id listed in llms-full.txt fit the same URL shape; every URL below is complete and callable.
{
  "spec_id": "venn-labeled-items",
  "language": "javascript",
  "library": "muix",
  "page": "https://anyplot.ai/venn-labeled-items/javascript/muix",
  "hub": "https://anyplot.ai/venn-labeled-items",
  "code_json": "https://api.anyplot.ai/specs/venn-labeled-items/muix/code",
  "spec_json": "https://api.anyplot.ai/specs/venn-labeled-items",
  "render_light_png": "https://storage.googleapis.com/anyplot-images/plots/venn-labeled-items/javascript/muix/plot-light.png",
  "render_dark_png": "https://storage.googleapis.com/anyplot-images/plots/venn-labeled-items/javascript/muix/plot-dark.png",
  "interactive_light_html": "https://storage.googleapis.com/anyplot-images/plots/venn-labeled-items/javascript/muix/plot-light.html",
  "interactive_dark_html": "https://storage.googleapis.com/anyplot-images/plots/venn-labeled-items/javascript/muix/plot-dark.html",
  "quality_score": 84.0,
  "license": "MIT",
  "guide": "https://anyplot.ai/llms.txt"
}
Part of Chartgeist-Style Venn Diagram with Labeled Items on anyplot.ai.