The same plot in 14 other libraries — JavaScript: Chart.js, Apache ECharts, Highcharts, MUI X Charts; Python: Altair, Bokeh, lets-plot, Matplotlib, Plotly, plotnine, Pygal, Seaborn; R: ggplot2; Julia: Makie.jl. Compare all 15 side by side: Chartgeist-Style Venn Diagram with Labeled Items in Python, R, Julia and JavaScript.
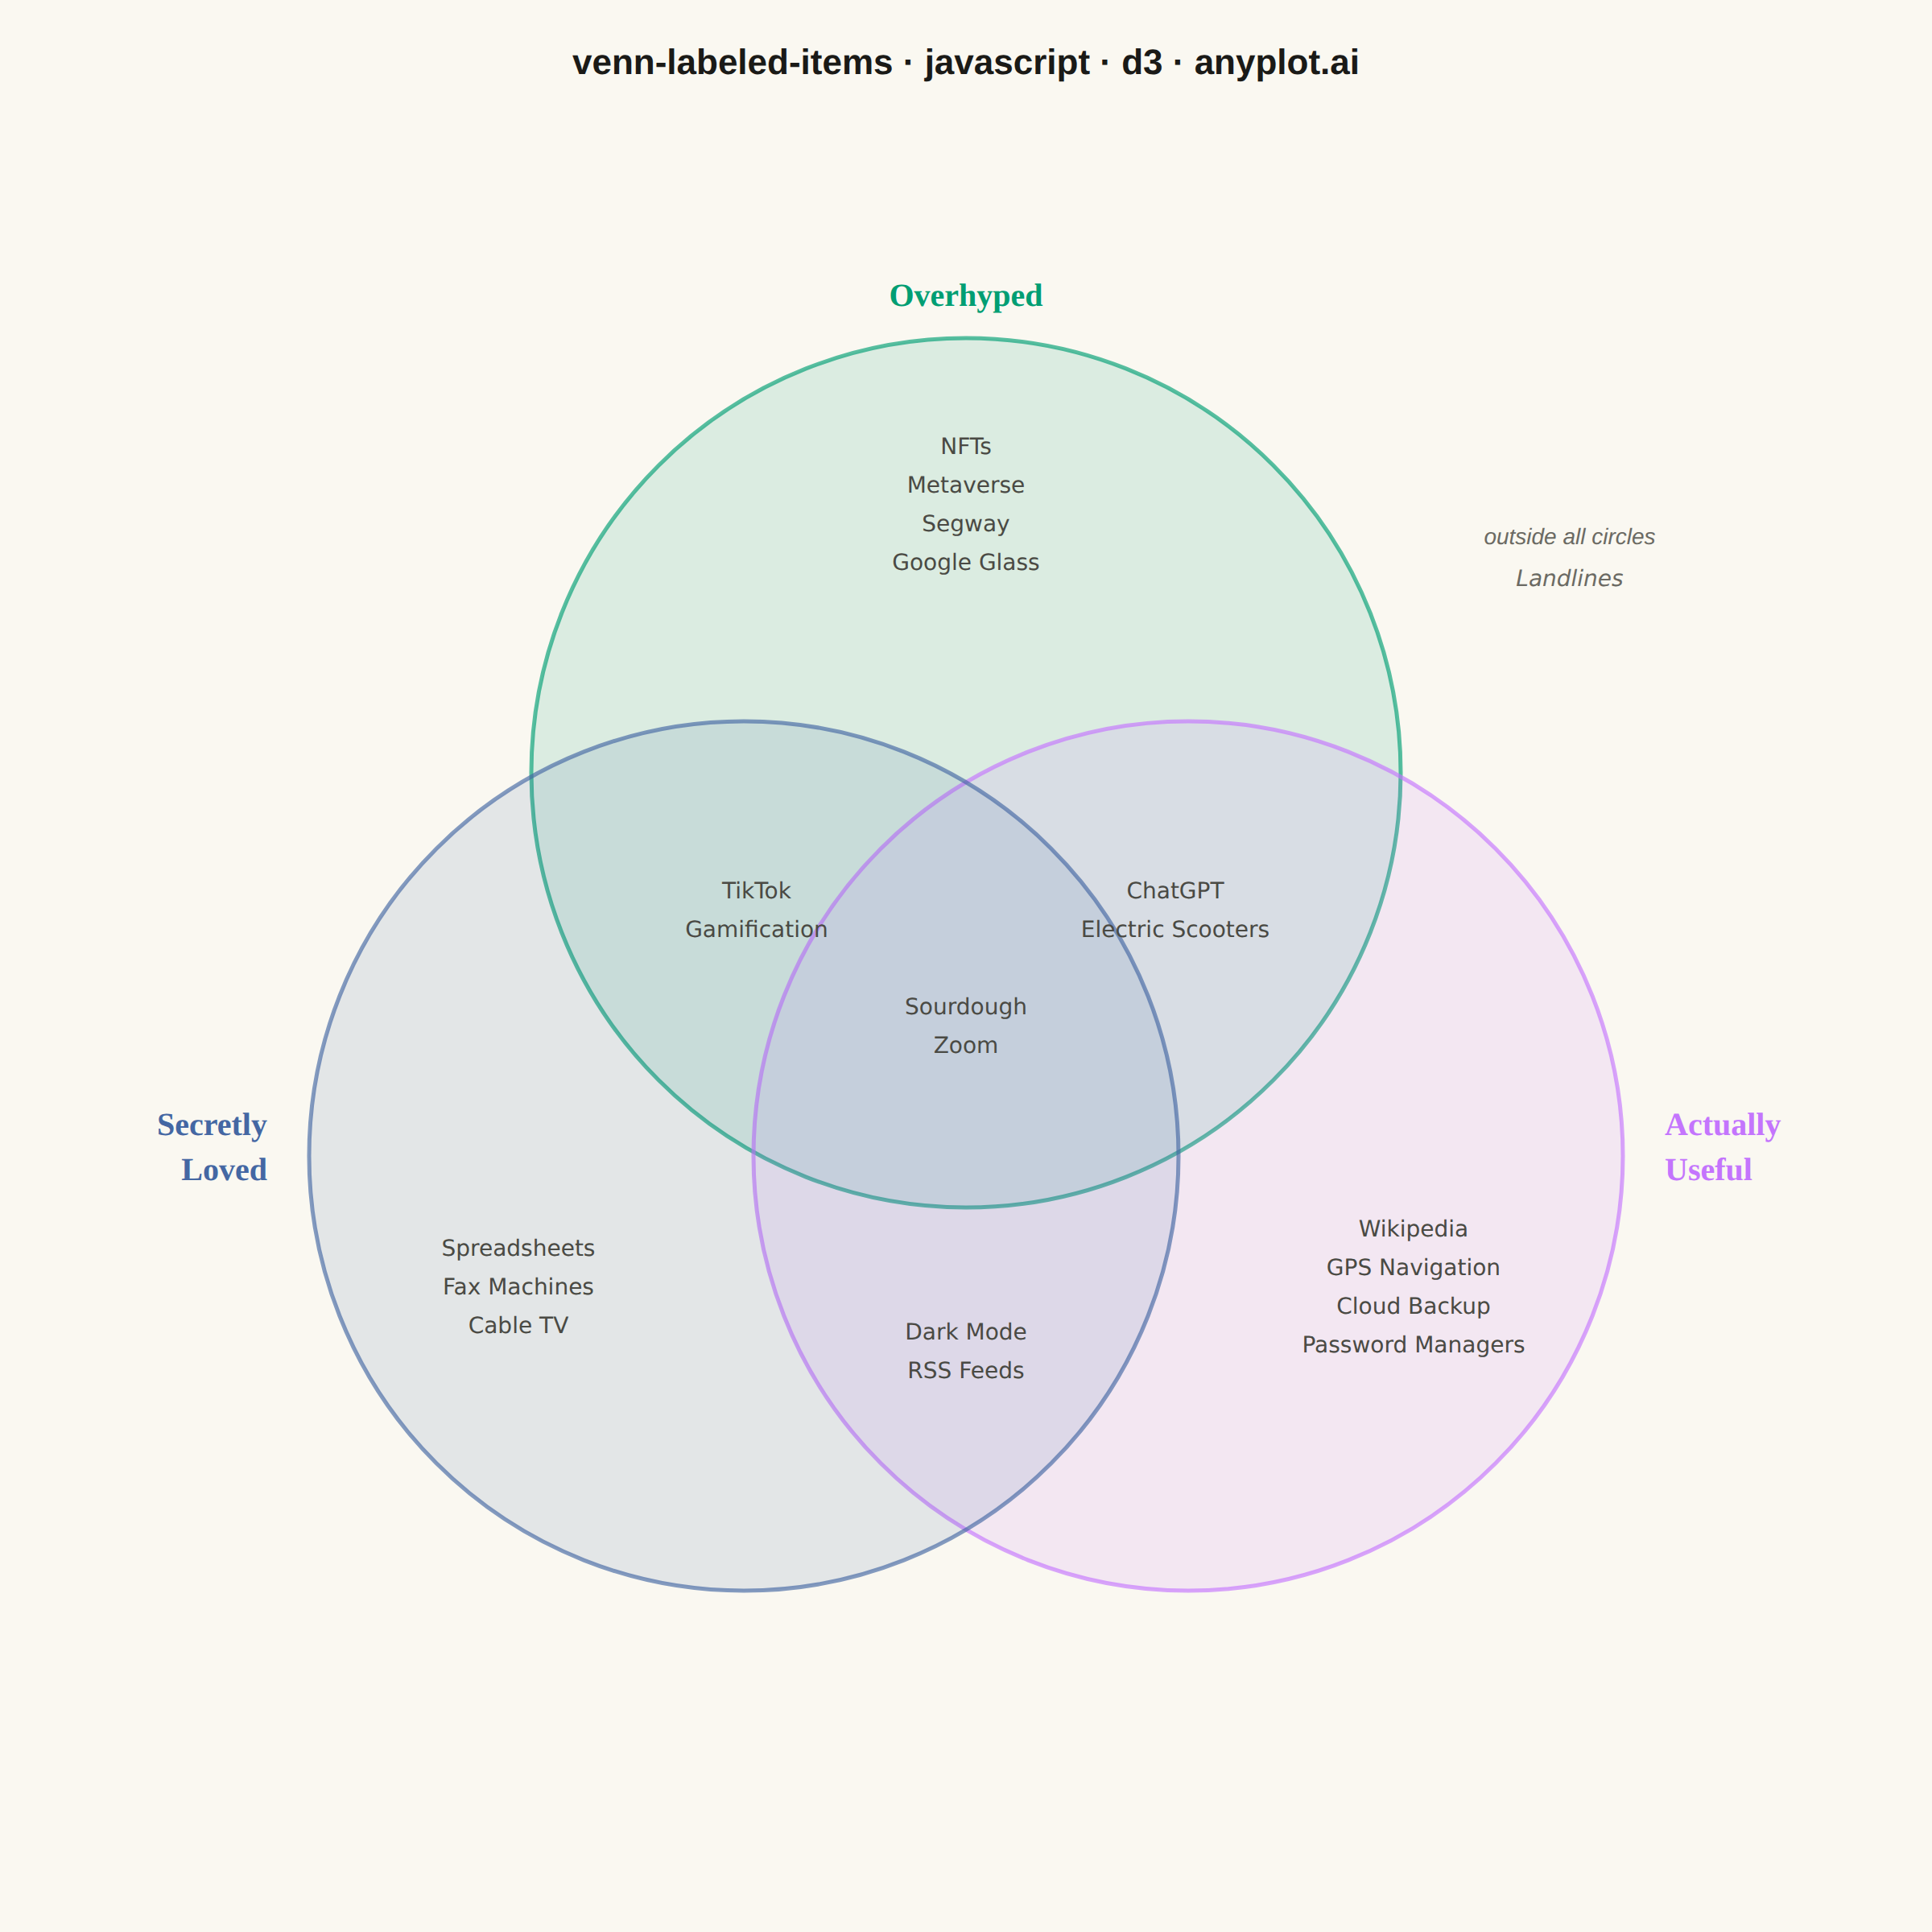
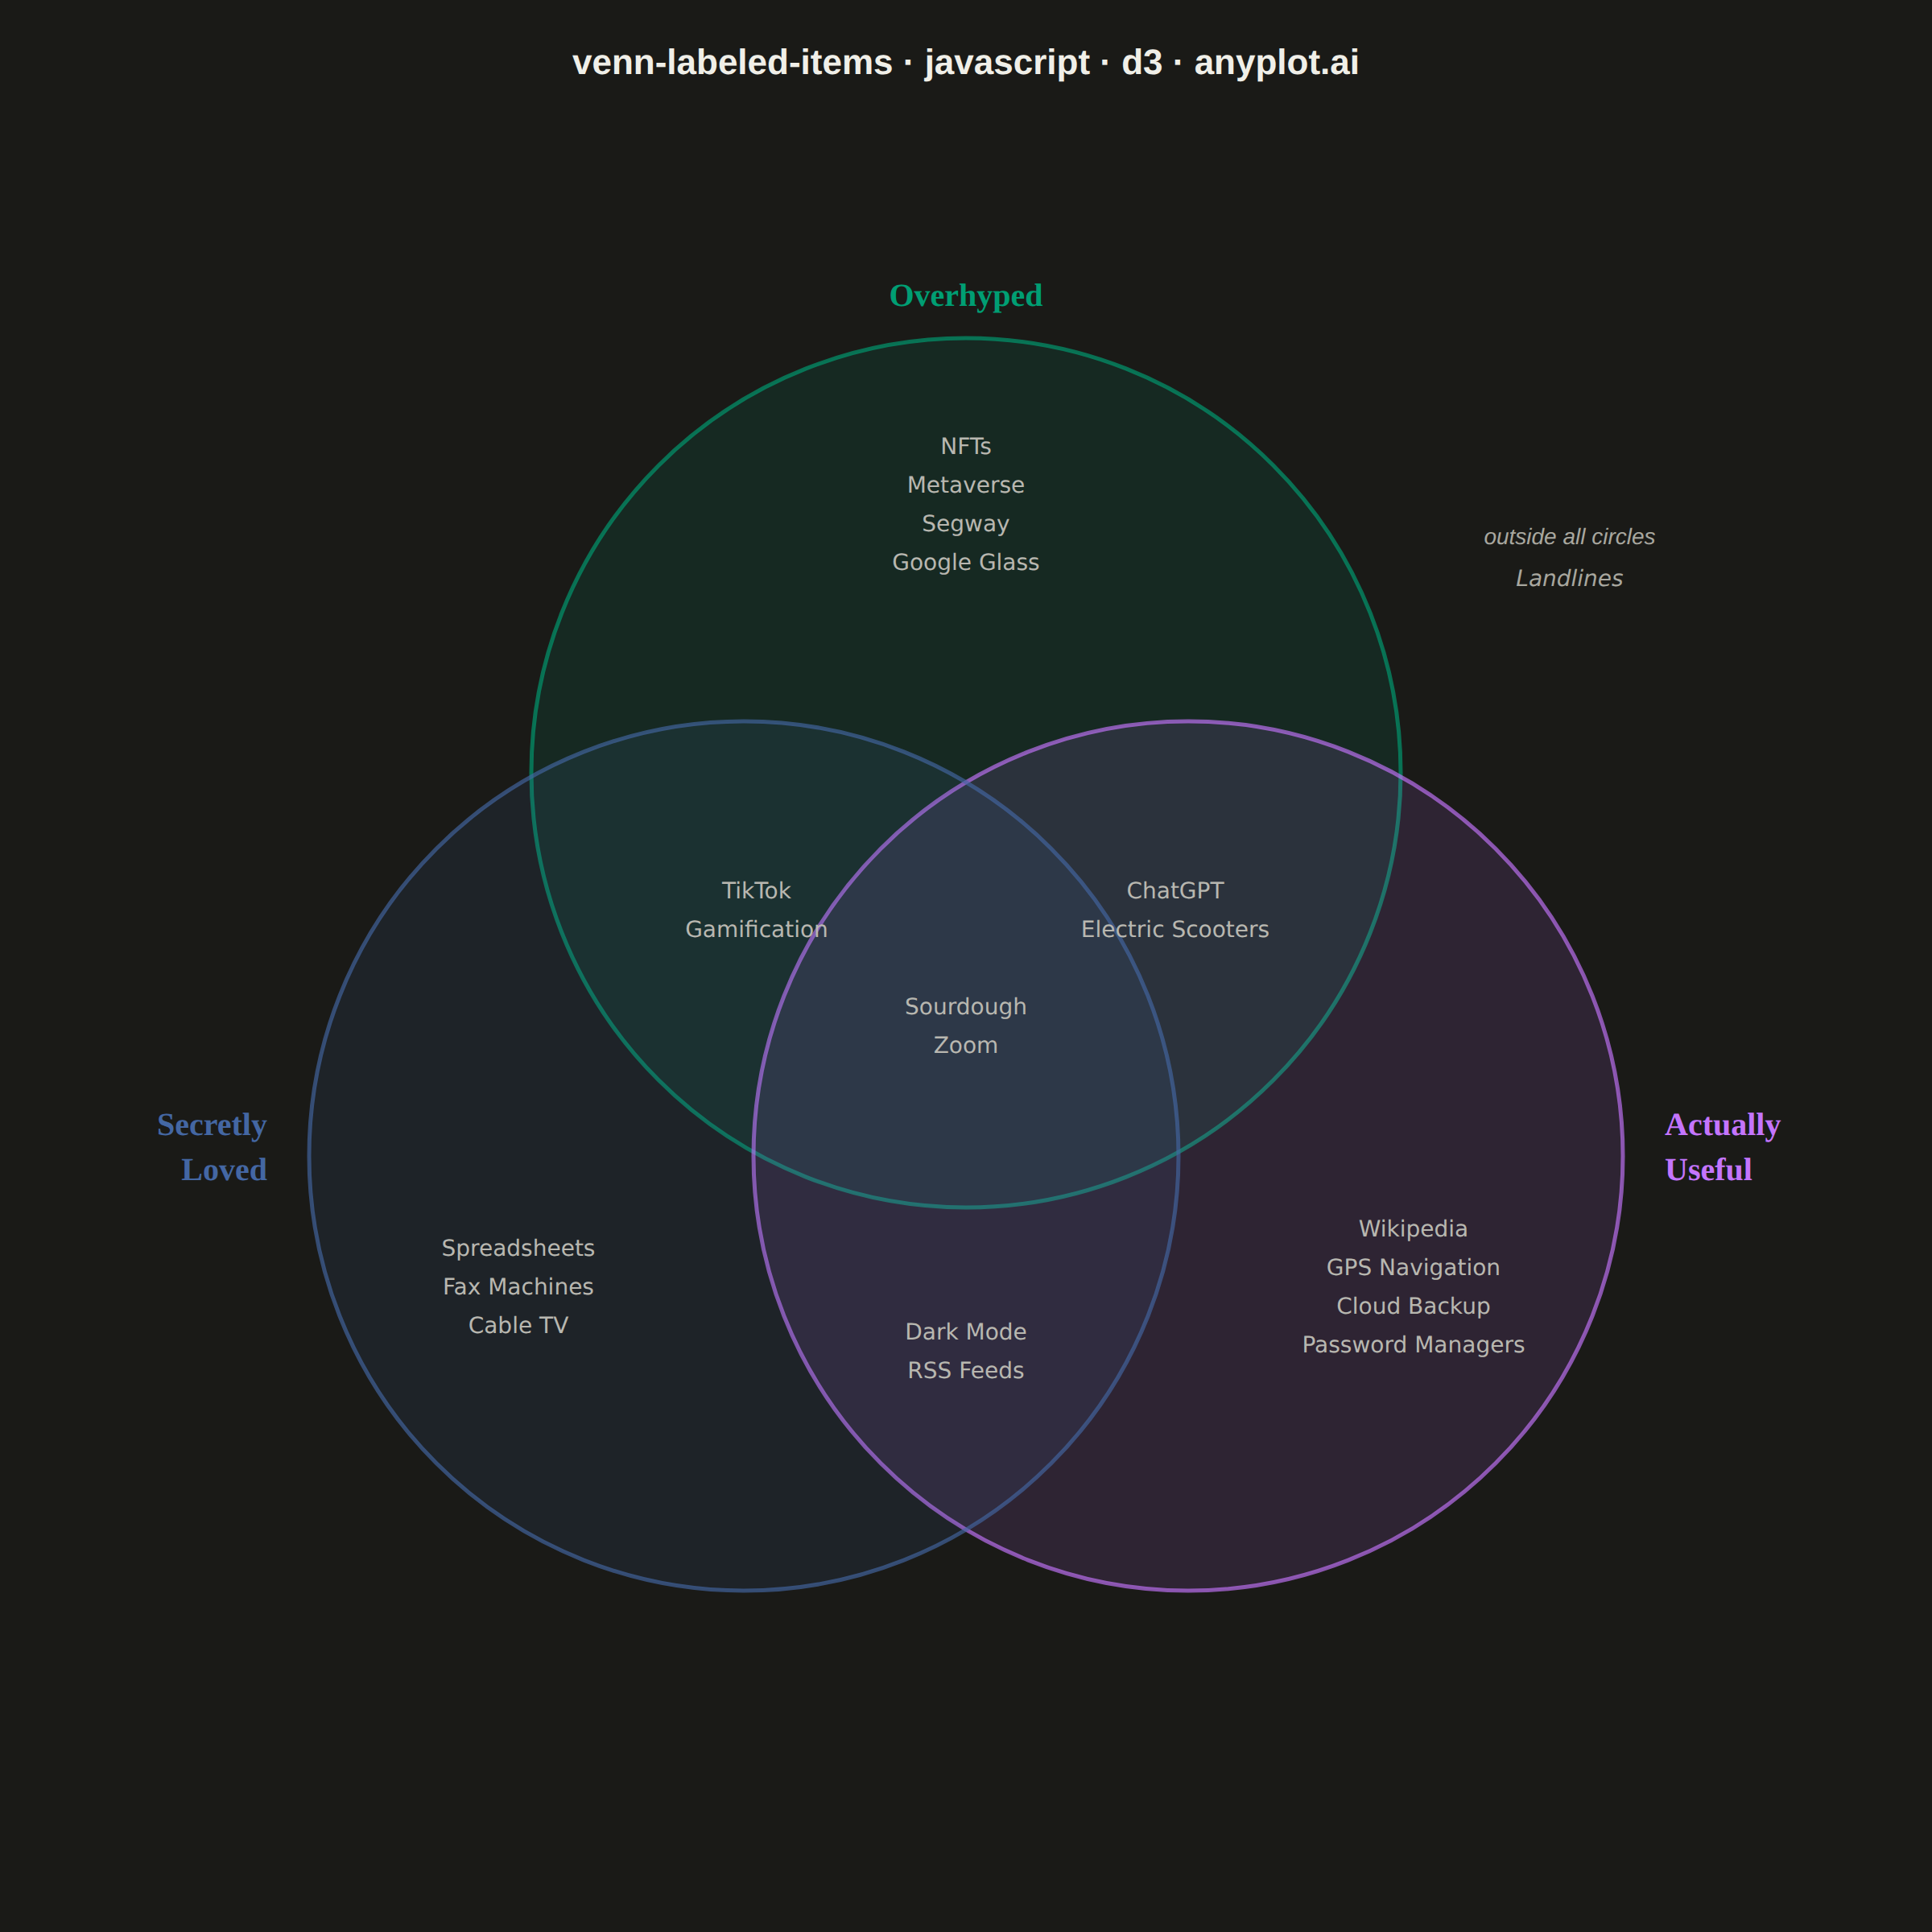
An editorial, WIRED "Chartgeist"-style three-circle Venn diagram where pop-culture items — products, people, trends, apps — are plotted as labeled points inside each zone rather than represented as numeric counts. Three overlapping circles define witty, opinionated categories (e.g., "Overhyped", "Actually Useful", "Secretly Loved"), and each item lives in exactly one of the seven interior regions (or outside all circles). Unlike a classic proportional Venn, the "data" here is categorical set-membership plus a human label, making the plot ideal for commentary, taxonomy, and discussion rather than quantitative analysis.
// anyplot.ai
// venn-labeled-items: Chartgeist-Style Venn Diagram with Labeled Items
// Library: d3 7.9.0 | JavaScript 22.23.0
// Quality: 87/100 | Created: 2026-06-25
//# anyplot-orientation: square

const t = window.ANYPLOT_TOKENS;
const { width, height } = window.ANYPLOT_SIZE;
const THEME = window.ANYPLOT_THEME || "light";
const inkMuted = THEME === "dark" ? "#A8A79F" : "#6B6A63";

// --- Data ---
const circleData = [
  { name: "Overhyped",       cx: 600, cy: 480, r: 270 },
  { name: "Actually Useful", cx: 738, cy: 718, r: 270 },
  { name: "Secretly Loved",  cx: 462, cy: 718, r: 270 },
];

// D3 ordinal scale maps category names to Imprint palette in canonical order
const colorScale = d3.scaleOrdinal()
  .domain(circleData.map(d => d.name))
  .range(t.palette.slice(0, 3));

// Centroid of each Venn zone for label placement
const ZONE_CENTROIDS = {
  A:       { x: 600, y: 314 },
  B:       { x: 878, y: 800 },
  C:       { x: 322, y: 800 },
  AB:      { x: 730, y: 566 },
  AC:      { x: 470, y: 566 },
  BC:      { x: 600, y: 840 },
  ABC:     { x: 600, y: 638 },
  outside: { x: 975, y: 360 },
};

const items = [
  { label: "NFTs",              zone: "A"       },
  { label: "Metaverse",         zone: "A"       },
  { label: "Segway",            zone: "A"       },
  { label: "Google Glass",      zone: "A"       },
  { label: "Wikipedia",         zone: "B"       },
  { label: "GPS Navigation",    zone: "B"       },
  { label: "Cloud Backup",      zone: "B"       },
  { label: "Password Managers", zone: "B"       },
  { label: "Spreadsheets",      zone: "C"       },
  { label: "Fax Machines",      zone: "C"       },
  { label: "Cable TV",          zone: "C"       },
  { label: "ChatGPT",           zone: "AB"      },
  { label: "Electric Scooters", zone: "AB"      },
  { label: "TikTok",            zone: "AC"      },
  { label: "Gamification",      zone: "AC"      },
  { label: "Dark Mode",         zone: "BC"      },
  { label: "RSS Feeds",         zone: "BC"      },
  { label: "Sourdough",         zone: "ABC"     },
  { label: "Zoom",              zone: "ABC"     },
  { label: "Landlines",         zone: "outside" },
];

// Use d3.group to partition items by zone, then compute vertical stacking positions
const SPACING = 24;
const itemsByZone = d3.group(items, d => d.zone);

itemsByZone.forEach((zoneItems, zone) => {
  const { x: zx, y: zy } = ZONE_CENTROIDS[zone];
  const totalH = (zoneItems.length - 1) * SPACING;
  zoneItems.forEach((item, i) => {
    item.x = zx;
    item.y = zy - totalH / 2 + i * SPACING;
  });
});

// --- SVG ---
const svg = d3.select("#container").append("svg")
  .attr("width", width)
  .attr("height", height);

// --- Circles (data join, semi-transparent fills, colored strokes) ---
svg.selectAll("circle.venn-circle").data(circleData).join("circle")
  .attr("class", "venn-circle")
  .attr("cx", d => d.cx).attr("cy", d => d.cy).attr("r", d => d.r)
  .attr("fill", d => colorScale(d.name)).attr("fill-opacity", 0.12)
  .attr("stroke", d => colorScale(d.name))
  .attr("stroke-width", 2.5).attr("stroke-opacity", 0.65);

// --- Category labels (data join per circle, editorial serif) ---
const catFont = "Georgia, 'Times New Roman', serif";

const catLabelDefs = [
  { name: "Overhyped",       lines: ["Overhyped"],          x: circleData[0].cx,                        y: circleData[0].cy - circleData[0].r - 20, anchor: "middle" },
  { name: "Actually Useful", lines: ["Actually", "Useful"], x: circleData[1].cx + circleData[1].r + 26, y: circleData[1].cy - 13,                  anchor: "start"  },
  { name: "Secretly Loved",  lines: ["Secretly", "Loved"],  x: circleData[2].cx - circleData[2].r - 26, y: circleData[2].cy - 13,                  anchor: "end"    },
];

catLabelDefs.forEach(def => {
  const catG = svg.append("g");
  catG.selectAll("text").data(def.lines).join("text")
    .attr("x", def.x)
    .attr("y", (_, i) => def.y + i * 28)
    .attr("text-anchor", def.anchor)
    .attr("fill", colorScale(def.name))
    .style("font-size", "20px").style("font-weight", "700")
    .style("font-family", catFont)
    .text(d => d);
});

// --- "outside all circles" annotation ---
const outsideItems = items.filter(d => d.zone === "outside");
if (outsideItems.length) {
  svg.append("text")
    .attr("x", ZONE_CENTROIDS.outside.x)
    .attr("y", d3.min(outsideItems, d => d.y) - 22)
    .attr("text-anchor", "middle").attr("fill", inkMuted)
    .style("font-size", "14px").style("font-style", "italic")
    .text("outside all circles");
}

// --- Items (data join over all items, positions from d3.group stacking) ---
svg.selectAll("text.venn-item").data(items).join("text")
  .attr("class", "venn-item")
  .attr("x", d => d.x)
  .attr("y", d => d.y)
  .attr("text-anchor", "middle")
  .attr("dominant-baseline", "middle")
  .attr("fill", d => d.zone === "outside" ? inkMuted : t.inkSoft)
  .style("font-size", "14px")
  .style("font-style", d => d.zone === "outside" ? "italic" : "normal")
  .style("font-family", "system-ui, -apple-system, sans-serif")
  .text(d => d.label);

// --- Title ---
svg.append("text")
  .attr("x", width / 2).attr("y", 46)
  .attr("text-anchor", "middle").attr("fill", t.ink)
  .style("font-size", "22px").style("font-weight", "600")
  .text("venn-labeled-items · javascript · d3 · anyplot.ai");
Runnable source as JSON, for any HTTP client: https://api.anyplot.ai/specs/venn-labeled-items/d3/code. Any spec id and library id listed in llms-full.txt fit the same URL shape; every URL below is complete and callable.
{
  "spec_id": "venn-labeled-items",
  "language": "javascript",
  "library": "d3",
  "page": "https://anyplot.ai/venn-labeled-items/javascript/d3",
  "hub": "https://anyplot.ai/venn-labeled-items",
  "code_json": "https://api.anyplot.ai/specs/venn-labeled-items/d3/code",
  "spec_json": "https://api.anyplot.ai/specs/venn-labeled-items",
  "render_light_png": "https://storage.googleapis.com/anyplot-images/plots/venn-labeled-items/javascript/d3/plot-light.png",
  "render_dark_png": "https://storage.googleapis.com/anyplot-images/plots/venn-labeled-items/javascript/d3/plot-dark.png",
  "interactive_light_html": "https://storage.googleapis.com/anyplot-images/plots/venn-labeled-items/javascript/d3/plot-light.html",
  "interactive_dark_html": "https://storage.googleapis.com/anyplot-images/plots/venn-labeled-items/javascript/d3/plot-dark.html",
  "quality_score": 87.0,
  "license": "MIT",
  "guide": "https://anyplot.ai/llms.txt"
}
Part of Chartgeist-Style Venn Diagram with Labeled Items on anyplot.ai.