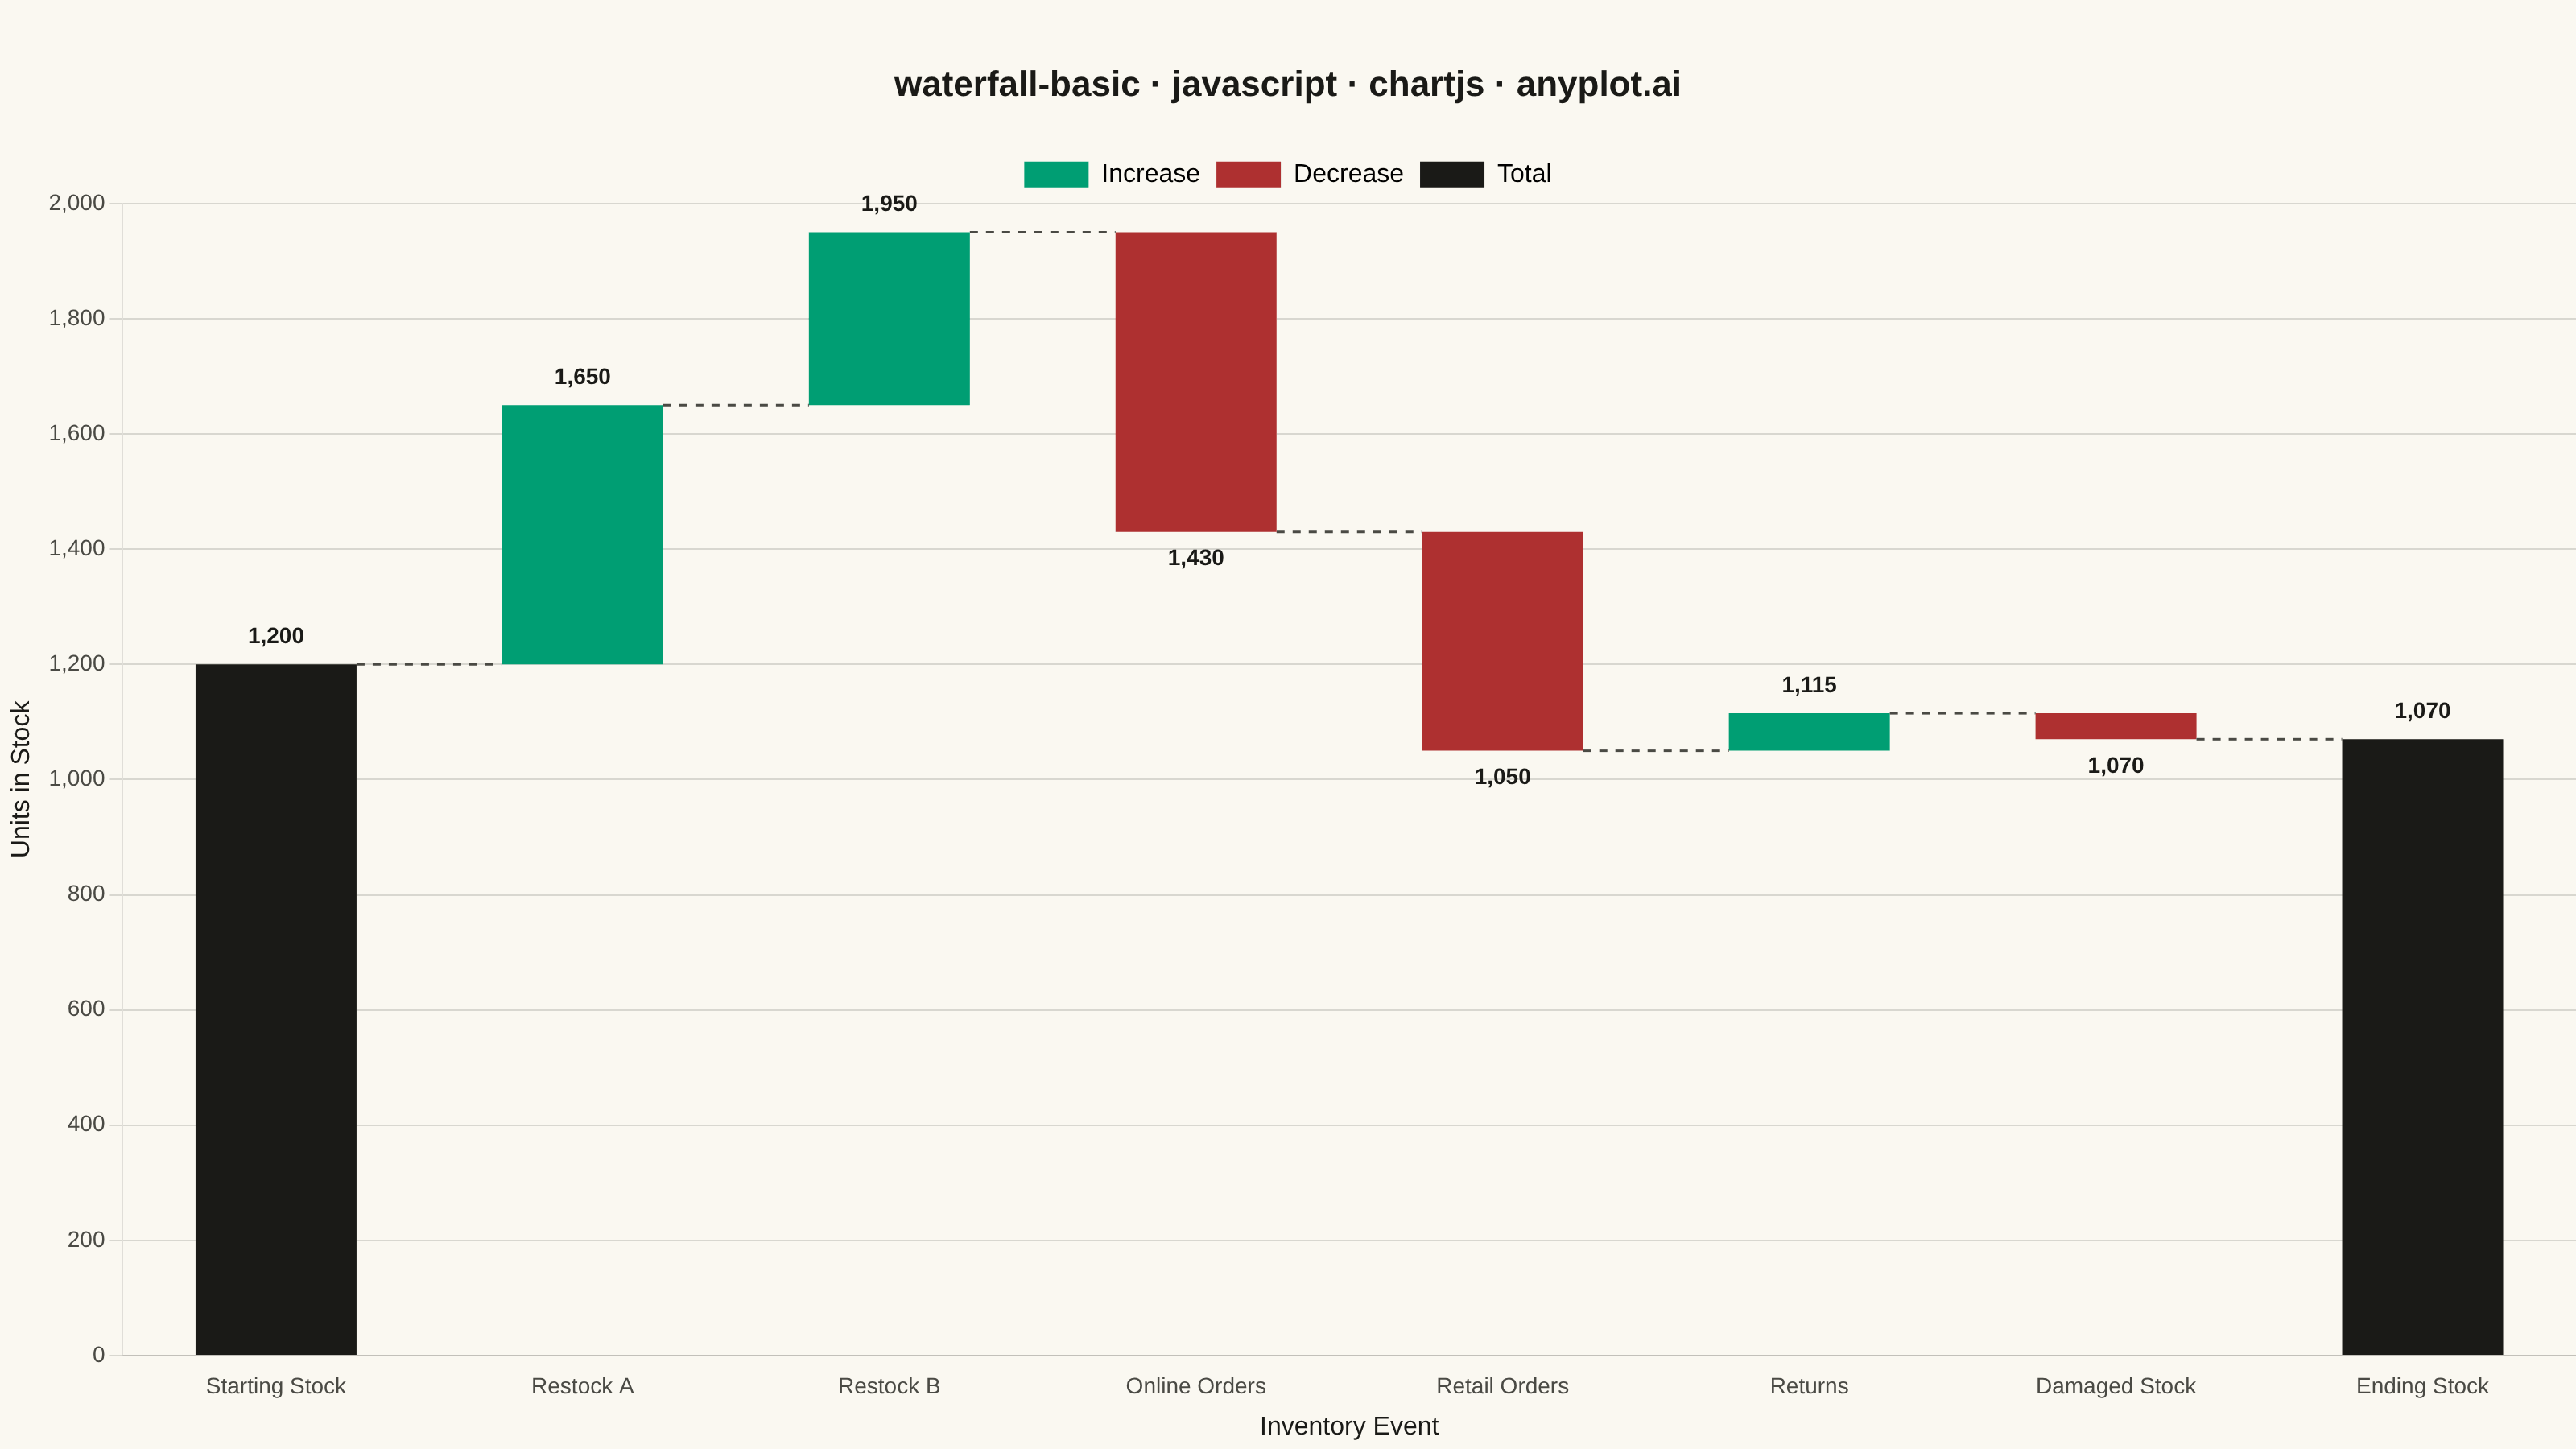
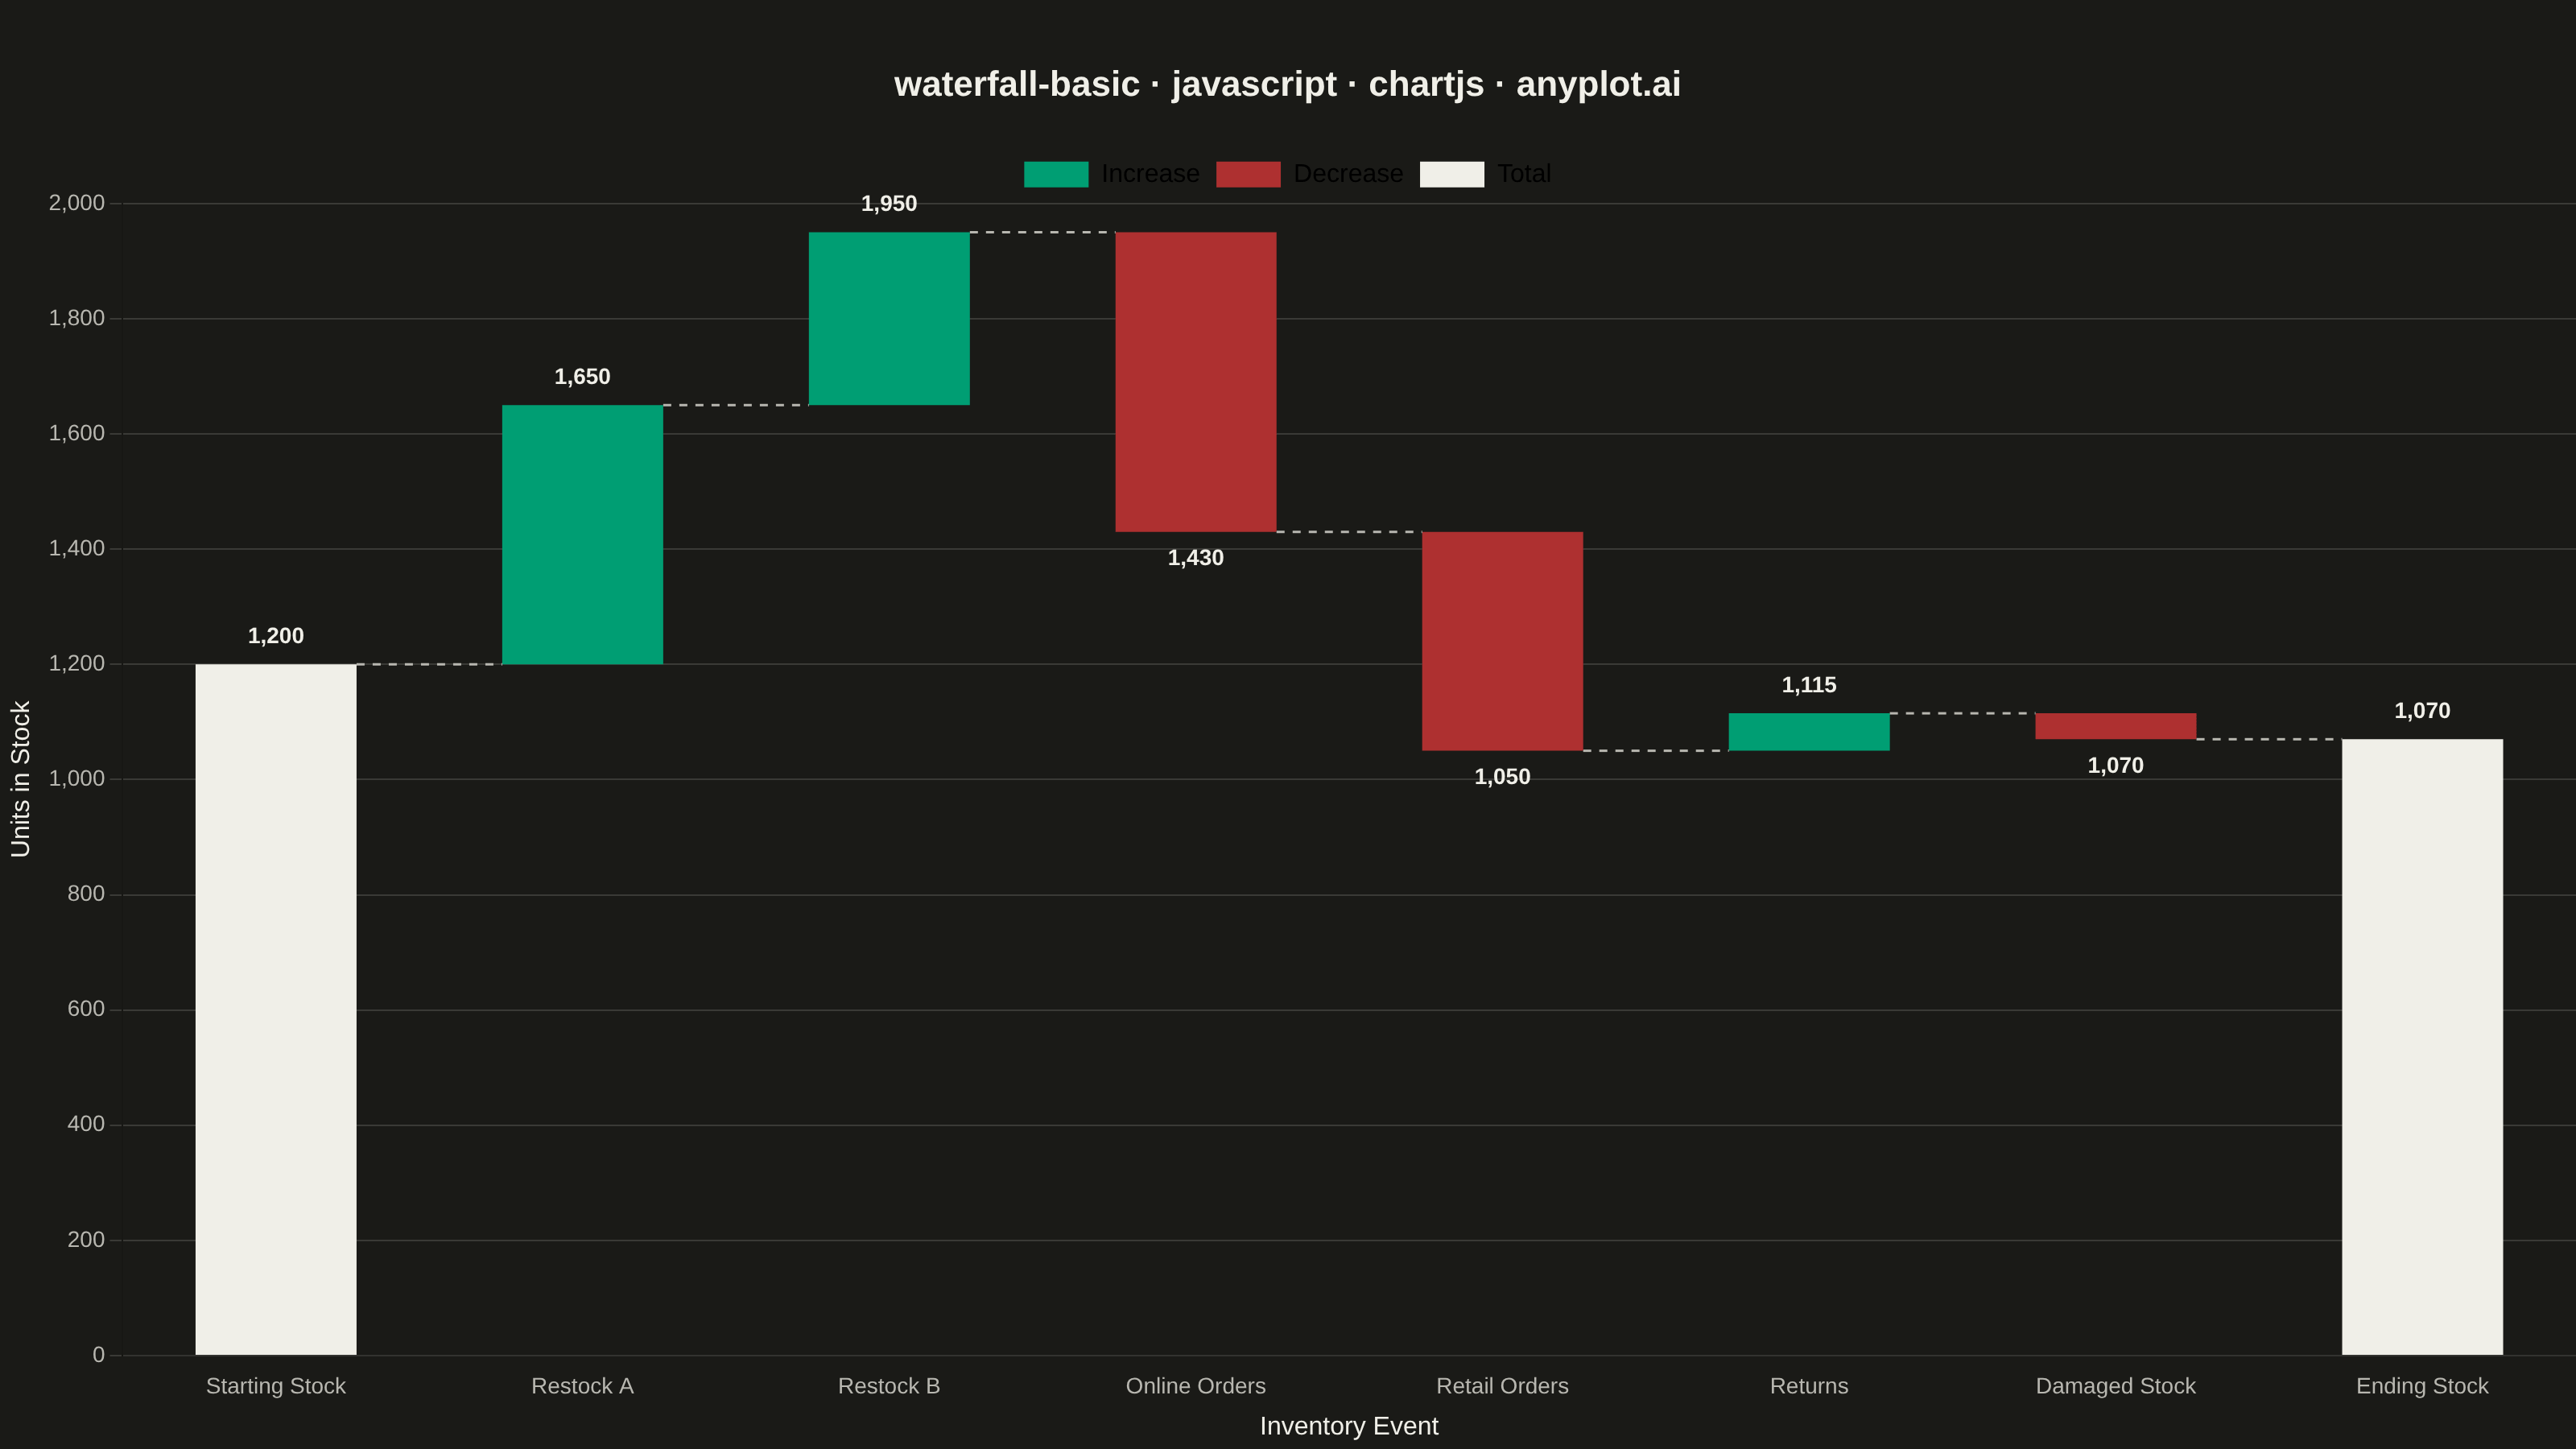
A waterfall chart visualizes how an initial value is affected by a series of intermediate positive or negative values, leading to a final value. Each bar represents a change from the previous cumulative total, with positive values extending upward and negative values extending downward. This chart type is essential for understanding cumulative effects and breaking down the components that contribute to a final result.
// anyplot.ai
// waterfall-basic: Basic Waterfall Chart
// Library: chartjs 4.4.7 | JavaScript 22.23.1
// Quality: 91/100 | Created: 2026-08-04

const t = window.ANYPLOT_TOKENS;

// --- Data (in-memory, deterministic) ----------------------------------------
// Warehouse inventory levels through a week of restocks, orders, and losses.
const categories = [
  "Starting Stock",
  "Restock A",
  "Restock B",
  "Online Orders",
  "Retail Orders",
  "Returns",
  "Damaged Stock",
  "Ending Stock",
];
const changes = [1200, 450, 300, -520, -380, 65, -45, null]; // null: last bar is a computed total

// --- Cumulative running total + per-bar [low, high] span --------------------
const cumulative = [];
let running = 0;
for (let i = 0; i < changes.length - 1; i++) {
  running += changes[i];
  cumulative.push(running);
}
const endingTotal = running;
cumulative.push(endingTotal);

const isTotal = (i) => i === 0 || i === categories.length - 1;
const bars = categories.map((_, i) => {
  if (isTotal(i)) return { lo: 0, hi: cumulative[i], kind: "total", after: cumulative[i] };
  const before = cumulative[i - 1];
  const after = cumulative[i];
  return { lo: Math.min(before, after), hi: Math.max(before, after), kind: changes[i] >= 0 ? "increase" : "decrease", after };
});

const barColor = (kind) => (kind === "total" ? t.ink : kind === "increase" ? t.palette[0] : t.palette[4]);

// --- Mount -------------------------------------------------------------------
const canvas = document.createElement("canvas");
document.getElementById("container").appendChild(canvas);

// --- Chart ---------------------------------------------------------------------
new Chart(canvas, {
  type: "bar",
  data: {
    labels: categories,
    datasets: [
      {
        label: "Stock level",
        data: bars.map((b) => [b.lo, b.hi]),
        backgroundColor: bars.map((b) => barColor(b.kind)),
        borderWidth: 0,
        barPercentage: 0.7,
        categoryPercentage: 0.75,
      },
    ],
  },
  options: {
    responsive: true,
    maintainAspectRatio: false,
    animation: false,
    layout: { padding: { top: 40 } },
    plugins: {
      title: {
        display: true,
        text: "waterfall-basic · javascript · chartjs · anyplot.ai",
        color: t.ink,
        font: { size: 22 },
        padding: { bottom: 24 },
      },
      legend: {
        labels: {
          color: t.ink,
          font: { size: 16 },
          generateLabels: () => [
            { text: "Increase", fillStyle: t.palette[0], strokeStyle: t.palette[0], lineWidth: 0 },
            { text: "Decrease", fillStyle: t.palette[4], strokeStyle: t.palette[4], lineWidth: 0 },
            { text: "Total", fillStyle: t.ink, strokeStyle: t.ink, lineWidth: 0 },
          ],
        },
      },
      tooltip: {
        callbacks: {
          label: (ctx) => `Running total: ${bars[ctx.dataIndex].after.toLocaleString()} units`,
        },
      },
    },
    scales: {
      x: {
        ticks: { color: t.inkSoft, font: { size: 14 } },
        grid: { display: false },
        title: { display: true, text: "Inventory Event", color: t.ink, font: { size: 16 } },
      },
      y: {
        ticks: { color: t.inkSoft, font: { size: 14 } },
        grid: { color: t.grid },
        title: { display: true, text: "Units in Stock", color: t.ink, font: { size: 16 } },
        beginAtZero: true,
      },
    },
  },
  plugins: [
    {
      id: "waterfallAnnotations",
      afterDatasetsDraw(chart) {
        const { ctx, scales } = chart;
        const meta = chart.getDatasetMeta(0);

        // Connecting lines between the running-total level of consecutive bars
        ctx.save();
        ctx.strokeStyle = t.inkSoft;
        ctx.lineWidth = 1.5;
        ctx.setLineDash([5, 5]);
        for (let i = 0; i < bars.length - 1; i++) {
          const levelY = scales.y.getPixelForValue(cumulative[i]);
          const xStart = meta.data[i].x + meta.data[i].width / 2;
          const xEnd = meta.data[i + 1].x - meta.data[i + 1].width / 2;
          ctx.beginPath();
          ctx.moveTo(xStart, levelY);
          ctx.lineTo(xEnd, levelY);
          ctx.stroke();
        }
        ctx.restore();

        // Running-total labels above/below each bar
        ctx.save();
        ctx.font = "600 14px sans-serif";
        ctx.fillStyle = t.ink;
        ctx.textAlign = "center";
        bars.forEach((bar, i) => {
          const x = meta.data[i].x;
          const afterIsTop = bar.after === bar.hi;
          if (afterIsTop) {
            ctx.textBaseline = "bottom";
            ctx.fillText(bar.after.toLocaleString(), x, scales.y.getPixelForValue(bar.hi) - 10);
          } else {
            ctx.textBaseline = "top";
            ctx.fillText(bar.after.toLocaleString(), x, scales.y.getPixelForValue(bar.lo) + 10);
          }
        });
        ctx.restore();
      },
    },
  ],
});
Runnable source as JSON, for any HTTP client: https://api.anyplot.ai/specs/waterfall-basic/chartjs/code. Any spec id and library id listed in llms-full.txt fit the same URL shape; every URL below is complete and callable.
{
  "spec_id": "waterfall-basic",
  "language": "javascript",
  "library": "chartjs",
  "page": "https://anyplot.ai/waterfall-basic/javascript/chartjs",
  "hub": "https://anyplot.ai/waterfall-basic",
  "code_json": "https://api.anyplot.ai/specs/waterfall-basic/chartjs/code",
  "spec_json": "https://api.anyplot.ai/specs/waterfall-basic",
  "render_light_png": "https://storage.googleapis.com/anyplot-images/plots/waterfall-basic/javascript/chartjs/plot-light.png",
  "render_dark_png": "https://storage.googleapis.com/anyplot-images/plots/waterfall-basic/javascript/chartjs/plot-dark.png",
  "interactive_light_html": "https://storage.googleapis.com/anyplot-images/plots/waterfall-basic/javascript/chartjs/plot-light.html",
  "interactive_dark_html": "https://storage.googleapis.com/anyplot-images/plots/waterfall-basic/javascript/chartjs/plot-dark.html",
  "quality_score": 91.0,
  "license": "MIT",
  "guide": "https://anyplot.ai/llms.txt"
}
Part of Basic Waterfall Chart on anyplot.ai.