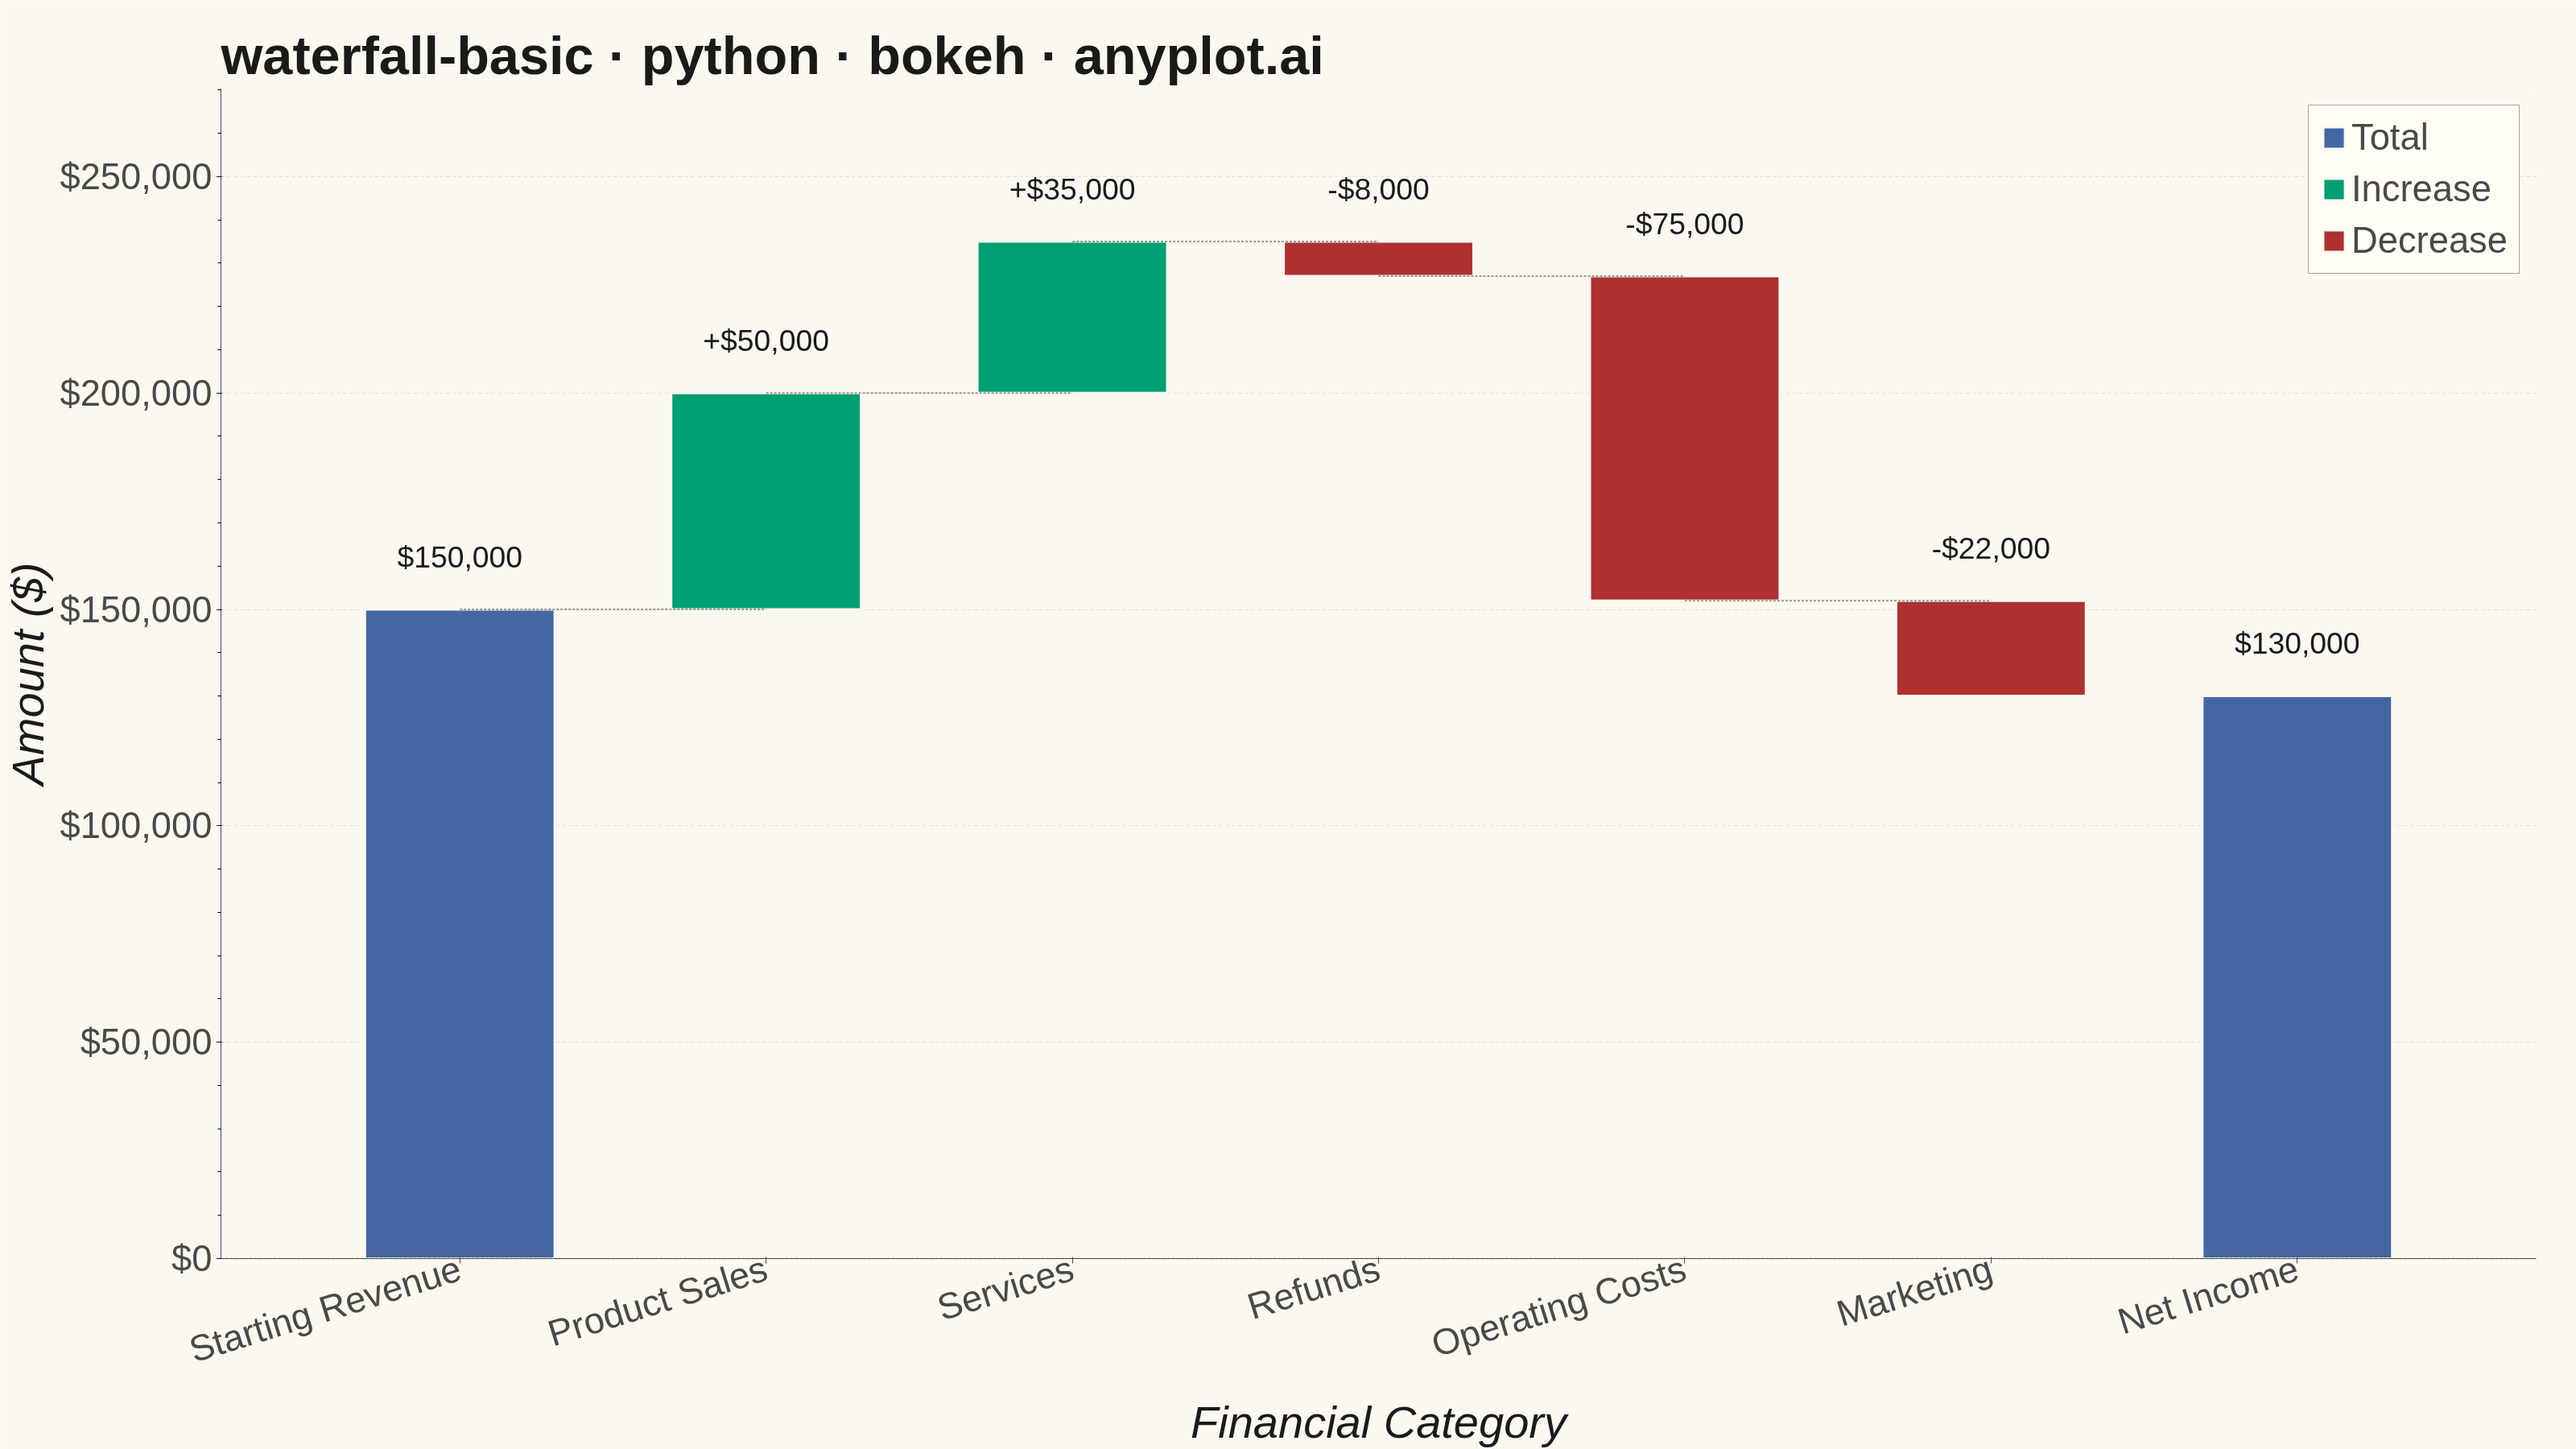
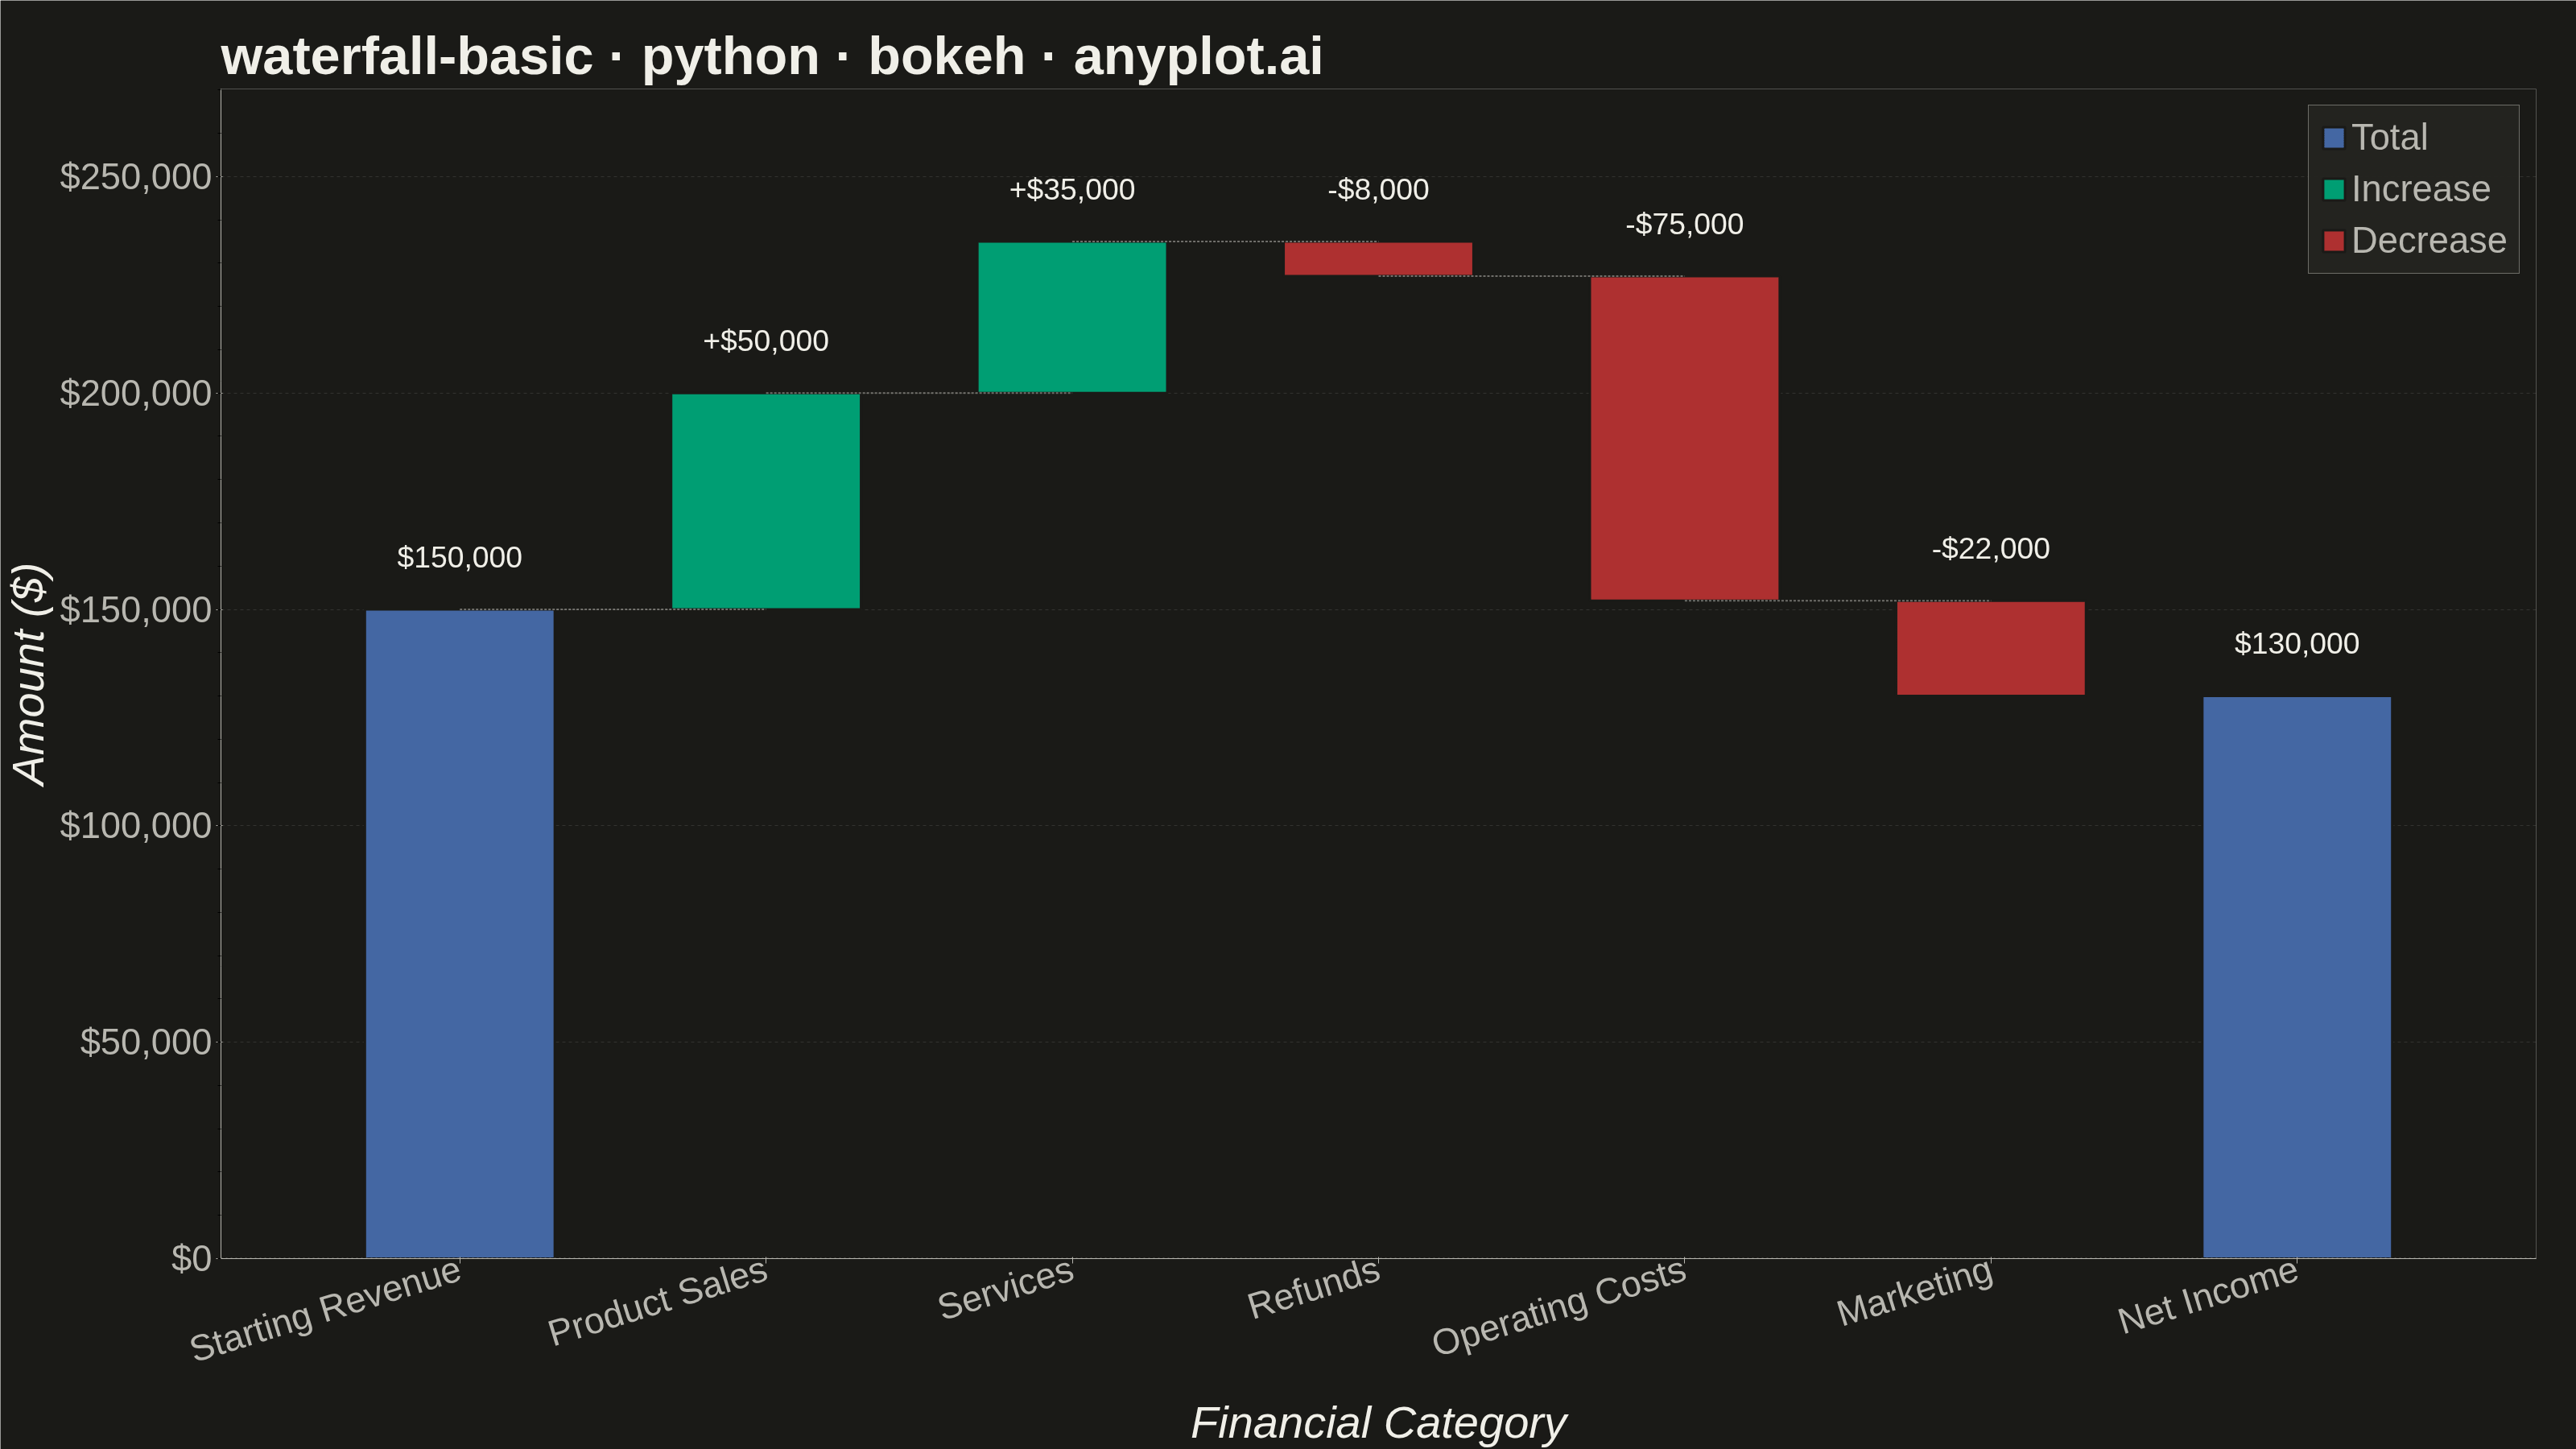
A waterfall chart visualizes how an initial value is affected by a series of intermediate positive or negative values, leading to a final value. Each bar represents a change from the previous cumulative total, with positive values extending upward and negative values extending downward. This chart type is essential for understanding cumulative effects and breaking down the components that contribute to a final result.
""" anyplot.ai
waterfall-basic: Basic Waterfall Chart
Library: bokeh 3.9.2 | Python 3.13.14
Quality: 90/100 | Updated: 2026-08-04
"""

import os
import time
from pathlib import Path

from bokeh.io import output_file, save
from bokeh.models import ColumnDataSource, FactorRange, HoverTool, LabelSet, NumeralTickFormatter, Span
from bokeh.plotting import figure
from bokeh.transform import factor_cmap
from selenium import webdriver
from selenium.webdriver.chrome.options import Options


THEME = os.getenv("ANYPLOT_THEME", "light")
PAGE_BG = "#FAF8F1" if THEME == "light" else "#1A1A17"
ELEVATED_BG = "#FFFDF6" if THEME == "light" else "#242420"
INK = "#1A1A17" if THEME == "light" else "#F0EFE8"
INK_SOFT = "#4A4A44" if THEME == "light" else "#B8B7B0"

# Imprint palette — brand green for gains, the deferred semantic-red anchor
# for losses, blue for the start/end totals
POSITIVE = "#009E73"
NEGATIVE = "#AE3030"
TOTAL = "#4467A3"

# Data - quarterly financial breakdown from revenue to net income
categories = ["Starting Revenue", "Product Sales", "Services", "Refunds", "Operating Costs", "Marketing", "Net Income"]
changes = [150000, 50000, 35000, -8000, -75000, -22000, 0]

# Waterfall bar positions
running_total = 0
bar_bottoms = []
bar_tops = []
bar_types = []
display_values = []

for i, change in enumerate(changes):
    if i == 0:
        # Starting total - full bar from 0
        running_total = change
        bar_bottoms.append(0)
        bar_tops.append(running_total)
        bar_types.append("Total")
        display_values.append(running_total)
    elif i == len(categories) - 1:
        # Final total - full bar from 0 to current running total
        bar_bottoms.append(0)
        bar_tops.append(running_total)
        bar_types.append("Total")
        display_values.append(running_total)
    else:
        # Intermediate changes
        if change >= 0:
            bar_bottoms.append(running_total)
            bar_tops.append(running_total + change)
            bar_types.append("Increase")
        else:
            bar_bottoms.append(running_total + change)
            bar_tops.append(running_total)
            bar_types.append("Decrease")
        running_total += change
        display_values.append(change)

max_value = max(bar_tops)
label_offset = max_value * 0.035

label_texts = []
for i, val in enumerate(display_values):
    if i == 0 or i == len(categories) - 1:
        label_texts.append(f"${val:,.0f}")
    elif val >= 0:
        label_texts.append(f"+${val:,.0f}")
    else:
        label_texts.append(f"-${abs(val):,.0f}")

source = ColumnDataSource(
    data={
        "categories": categories,
        "bottom": bar_bottoms,
        "top": bar_tops,
        "type": bar_types,
        "label": label_texts,
        "label_y": [top + label_offset for top in bar_tops],
    }
)

# Running totals feed the connector segments between consecutive bars
running_totals = []
rt = 0
for i, change in enumerate(changes):
    if i == 0:
        rt = change
    elif i < len(changes) - 1:
        rt += change
    running_totals.append(rt)

connector_xs = [[categories[i], categories[i + 1]] for i in range(len(categories) - 2)]
connector_ys = [[running_totals[i], running_totals[i]] for i in range(len(categories) - 2)]

# Figure
p = figure(
    x_range=FactorRange(*categories, range_padding=0.08),
    width=3200,
    height=1800,
    title="waterfall-basic · python · bokeh · anyplot.ai",
    x_axis_label="Financial Category",
    y_axis_label="Amount ($)",
    toolbar_location=None,
    min_border_bottom=160,
    min_border_left=200,
    min_border_top=110,
    min_border_right=50,
)

# Bars colored by step type via a categorical color mapper — also drives
# an automatic legend so Increase/Decrease/Total read without guesswork
bars = p.vbar(
    x="categories",
    top="top",
    bottom="bottom",
    width=0.62,
    source=source,
    fill_color=factor_cmap("type", palette=[POSITIVE, NEGATIVE, TOTAL], factors=["Increase", "Decrease", "Total"]),
    line_color=PAGE_BG,
    line_width=3,
    legend_field="type",
)

p.add_tools(
    HoverTool(renderers=[bars], tooltips=[("Category", "@categories"), ("Type", "@type"), ("Amount", "@label")])
)

# Zero baseline for reference
p.add_layout(Span(location=0, dimension="width", line_color=INK_SOFT, line_width=1.5, line_dash="dotted"))

# Dashed connectors linking each bar's cumulative edge to the next step
p.multi_line(xs=connector_xs, ys=connector_ys, line_color=INK_SOFT, line_width=2, line_dash="dashed", line_alpha=0.55)

# Value labels, batched from the shared source rather than looped Label() calls
p.add_layout(
    LabelSet(
        x="categories",
        y="label_y",
        text="label",
        source=source,
        text_font_size="28pt",
        text_align="center",
        text_baseline="bottom",
        text_color=INK,
    )
)

# Style
p.title.text_font_size = "50pt"
p.title.text_color = INK

p.xaxis.axis_label_text_font_size = "42pt"
p.xaxis.axis_label_text_color = INK
p.yaxis.axis_label_text_font_size = "42pt"
p.yaxis.axis_label_text_color = INK

p.xaxis.major_label_text_font_size = "34pt"
p.yaxis.major_label_text_font_size = "34pt"
p.xaxis.major_label_text_color = INK_SOFT
p.yaxis.major_label_text_color = INK_SOFT
p.xaxis.major_label_orientation = 0.3
p.yaxis.formatter = NumeralTickFormatter(format="$0,0")

p.xaxis.axis_line_color = INK_SOFT
p.yaxis.axis_line_color = INK_SOFT
p.xaxis.major_tick_line_color = INK_SOFT
p.yaxis.major_tick_line_color = INK_SOFT

p.xgrid.grid_line_color = None
p.ygrid.grid_line_color = INK
p.ygrid.grid_line_alpha = 0.12
p.ygrid.grid_line_dash = [4, 4]

p.background_fill_color = PAGE_BG
p.border_fill_color = PAGE_BG
p.outline_line_color = None  # L-shaped frame — no closed rectangle border

p.legend.location = "top_right"
p.legend.orientation = "vertical"
p.legend.background_fill_color = ELEVATED_BG
p.legend.border_line_color = INK_SOFT
p.legend.label_text_color = INK_SOFT
p.legend.label_text_font_size = "34pt"
p.legend.glyph_height = 34
p.legend.glyph_width = 34
p.legend.spacing = 12
p.legend.padding = 14
p.legend.margin = 20

p.y_range.start = 0
p.y_range.end = max_value * 1.15

# Save HTML
output_file(f"plot-{THEME}.html")
save(p)

# Screenshot with headless Chrome — Selenium 4 auto-resolves a working driver
W, H = 3200, 1800
opts = Options()
for arg in (
    "--headless=new",
    "--no-sandbox",
    "--disable-dev-shm-usage",
    "--disable-gpu",
    f"--window-size={W},{H}",
    "--hide-scrollbars",
):
    opts.add_argument(arg)

driver = webdriver.Chrome(options=opts)
driver.set_window_size(W, H)
driver.get(f"file://{Path(f'plot-{THEME}.html').resolve()}")
# Headless Chrome's --window-size sets the OUTER window (phantom title-bar
# reserved even headless), so pin the viewport exactly via CDP instead.
driver.execute_cdp_cmd(
    "Emulation.setDeviceMetricsOverride", {"width": W, "height": H, "deviceScaleFactor": 1, "mobile": False}
)
time.sleep(3)  # let bokeh's JS render the canvas
driver.save_screenshot(f"plot-{THEME}.png")
driver.quit()
Runnable source as JSON, for any HTTP client: https://api.anyplot.ai/specs/waterfall-basic/bokeh/code. Any spec id and library id listed in llms-full.txt fit the same URL shape; every URL below is complete and callable.
{
  "spec_id": "waterfall-basic",
  "language": "python",
  "library": "bokeh",
  "page": "https://anyplot.ai/waterfall-basic/python/bokeh",
  "hub": "https://anyplot.ai/waterfall-basic",
  "code_json": "https://api.anyplot.ai/specs/waterfall-basic/bokeh/code",
  "spec_json": "https://api.anyplot.ai/specs/waterfall-basic",
  "render_light_png": "https://storage.googleapis.com/anyplot-images/plots/waterfall-basic/python/bokeh/plot-light.png",
  "render_dark_png": "https://storage.googleapis.com/anyplot-images/plots/waterfall-basic/python/bokeh/plot-dark.png",
  "interactive_light_html": "https://storage.googleapis.com/anyplot-images/plots/waterfall-basic/python/bokeh/plot-light.html",
  "interactive_dark_html": "https://storage.googleapis.com/anyplot-images/plots/waterfall-basic/python/bokeh/plot-dark.html",
  "quality_score": 90.0,
  "license": "MIT",
  "guide": "https://anyplot.ai/llms.txt"
}
Part of Basic Waterfall Chart on anyplot.ai.