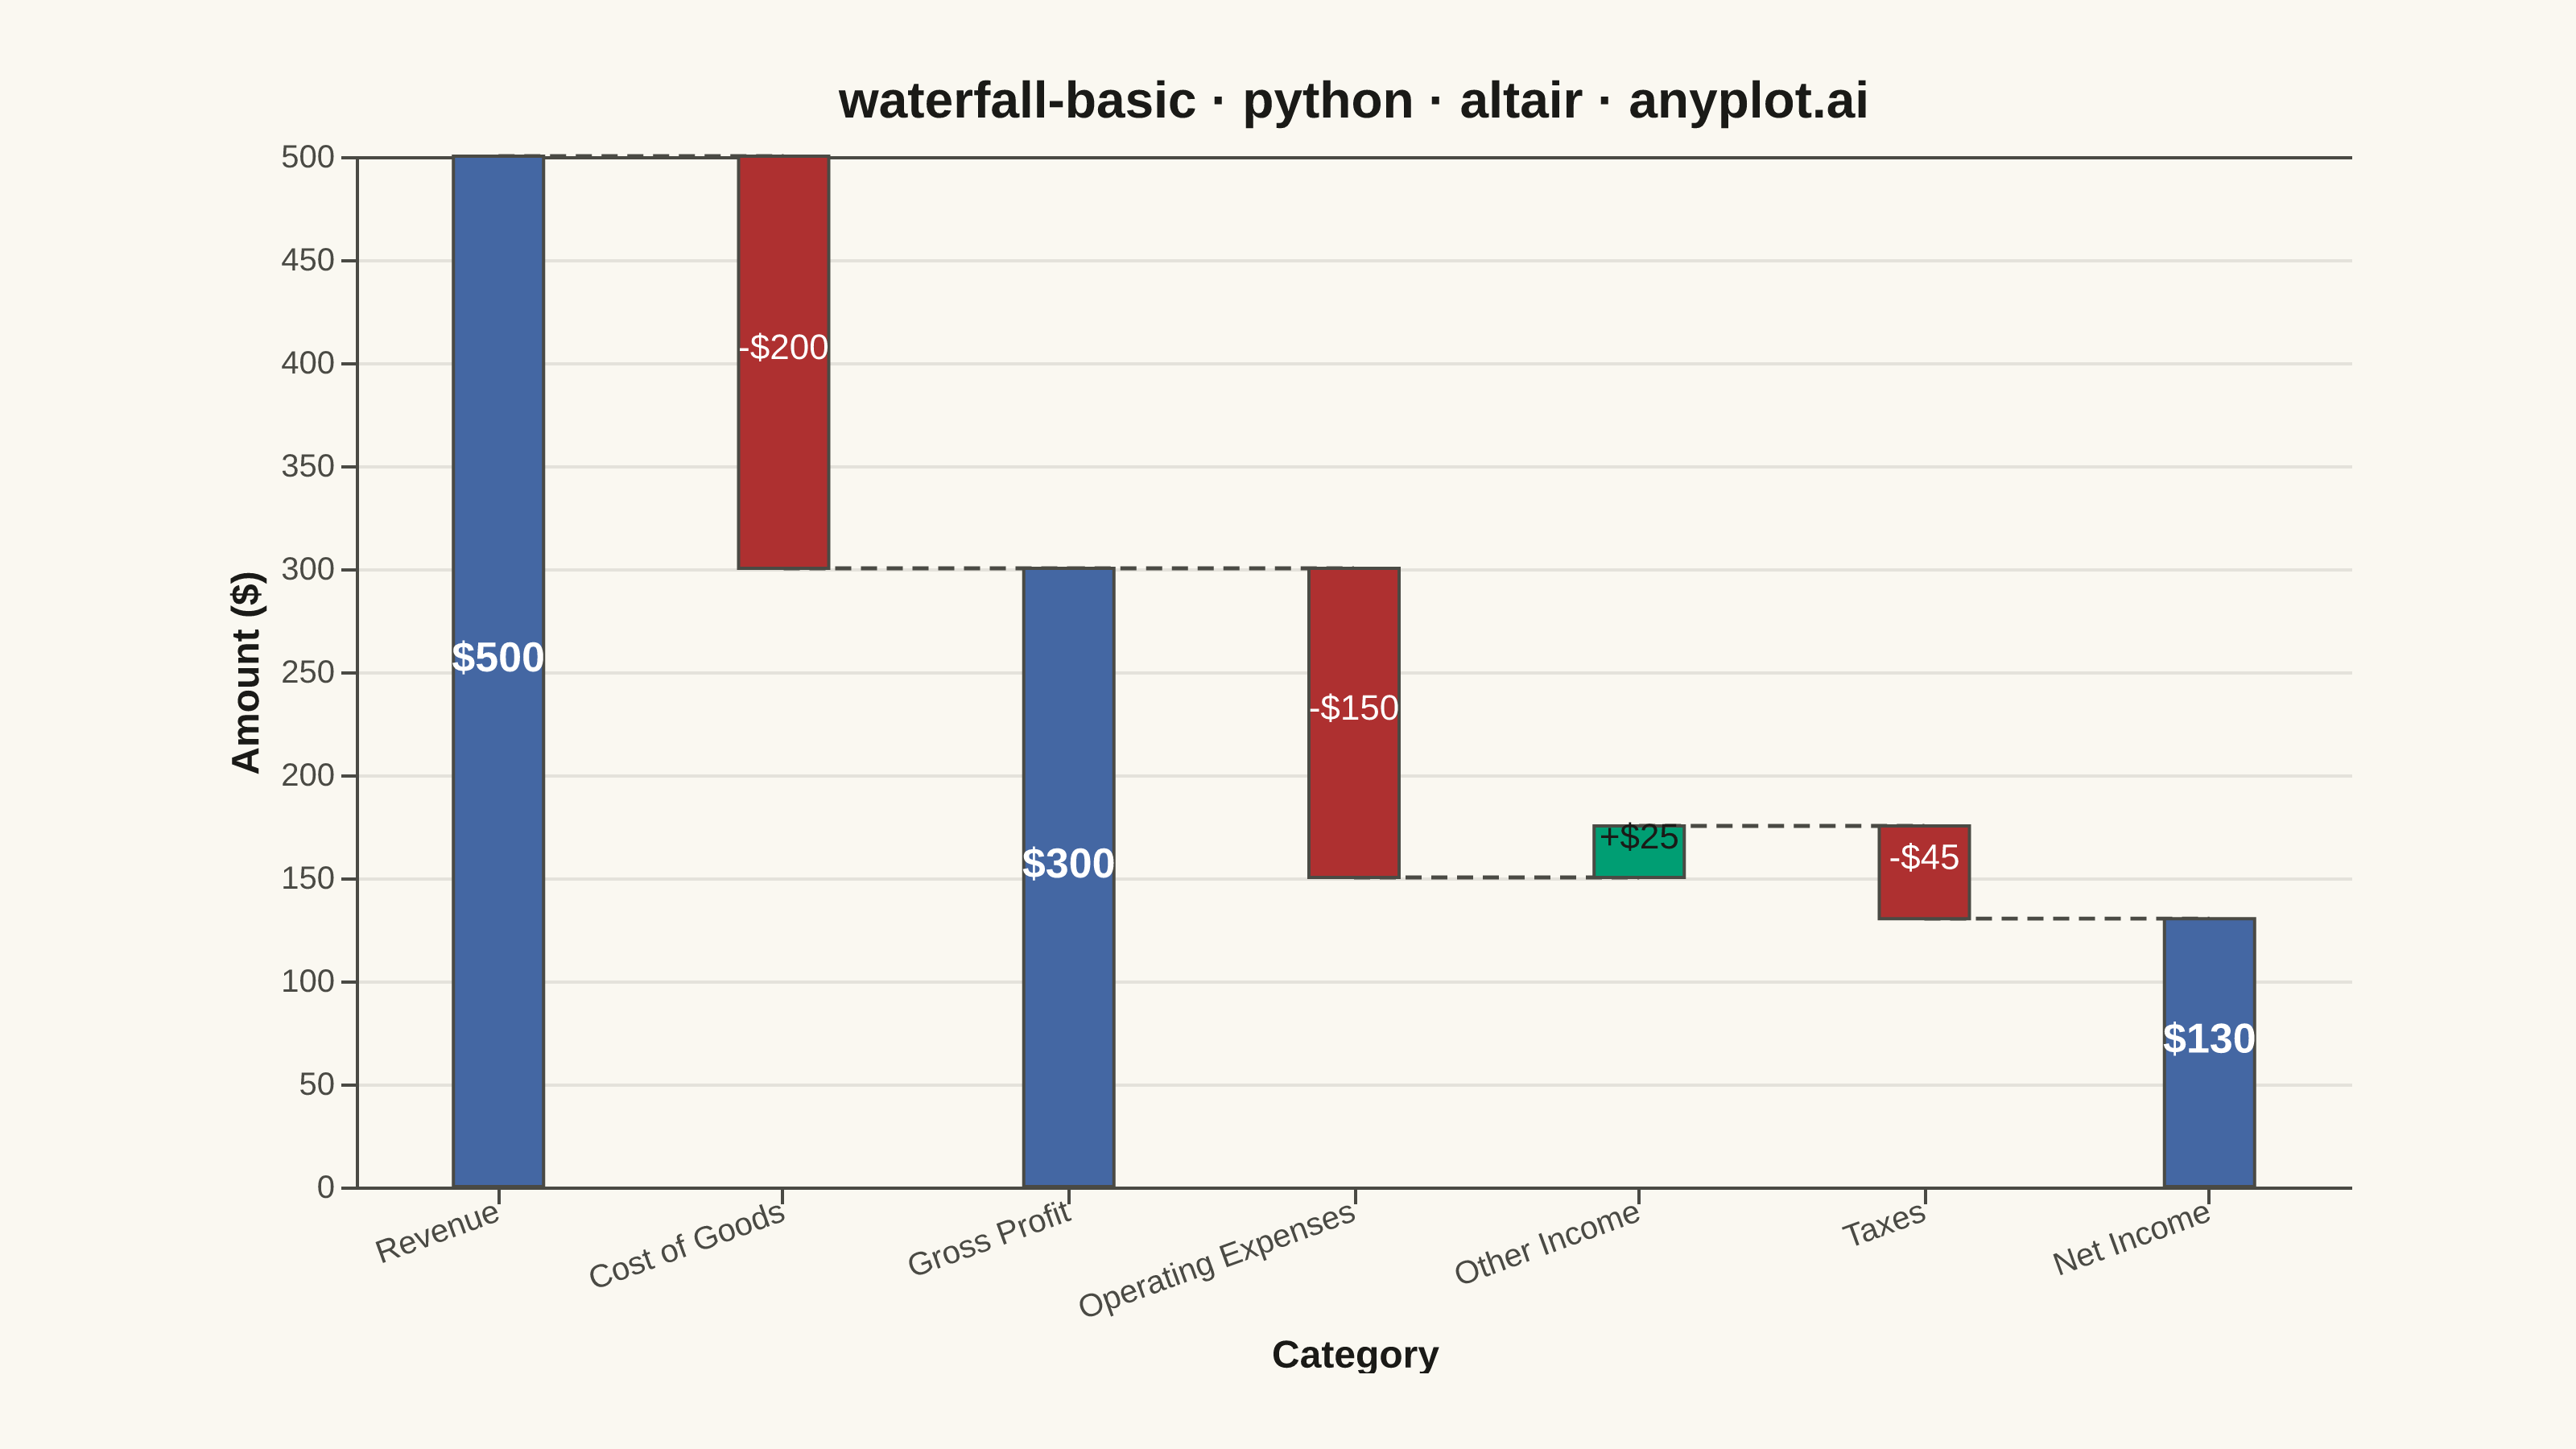
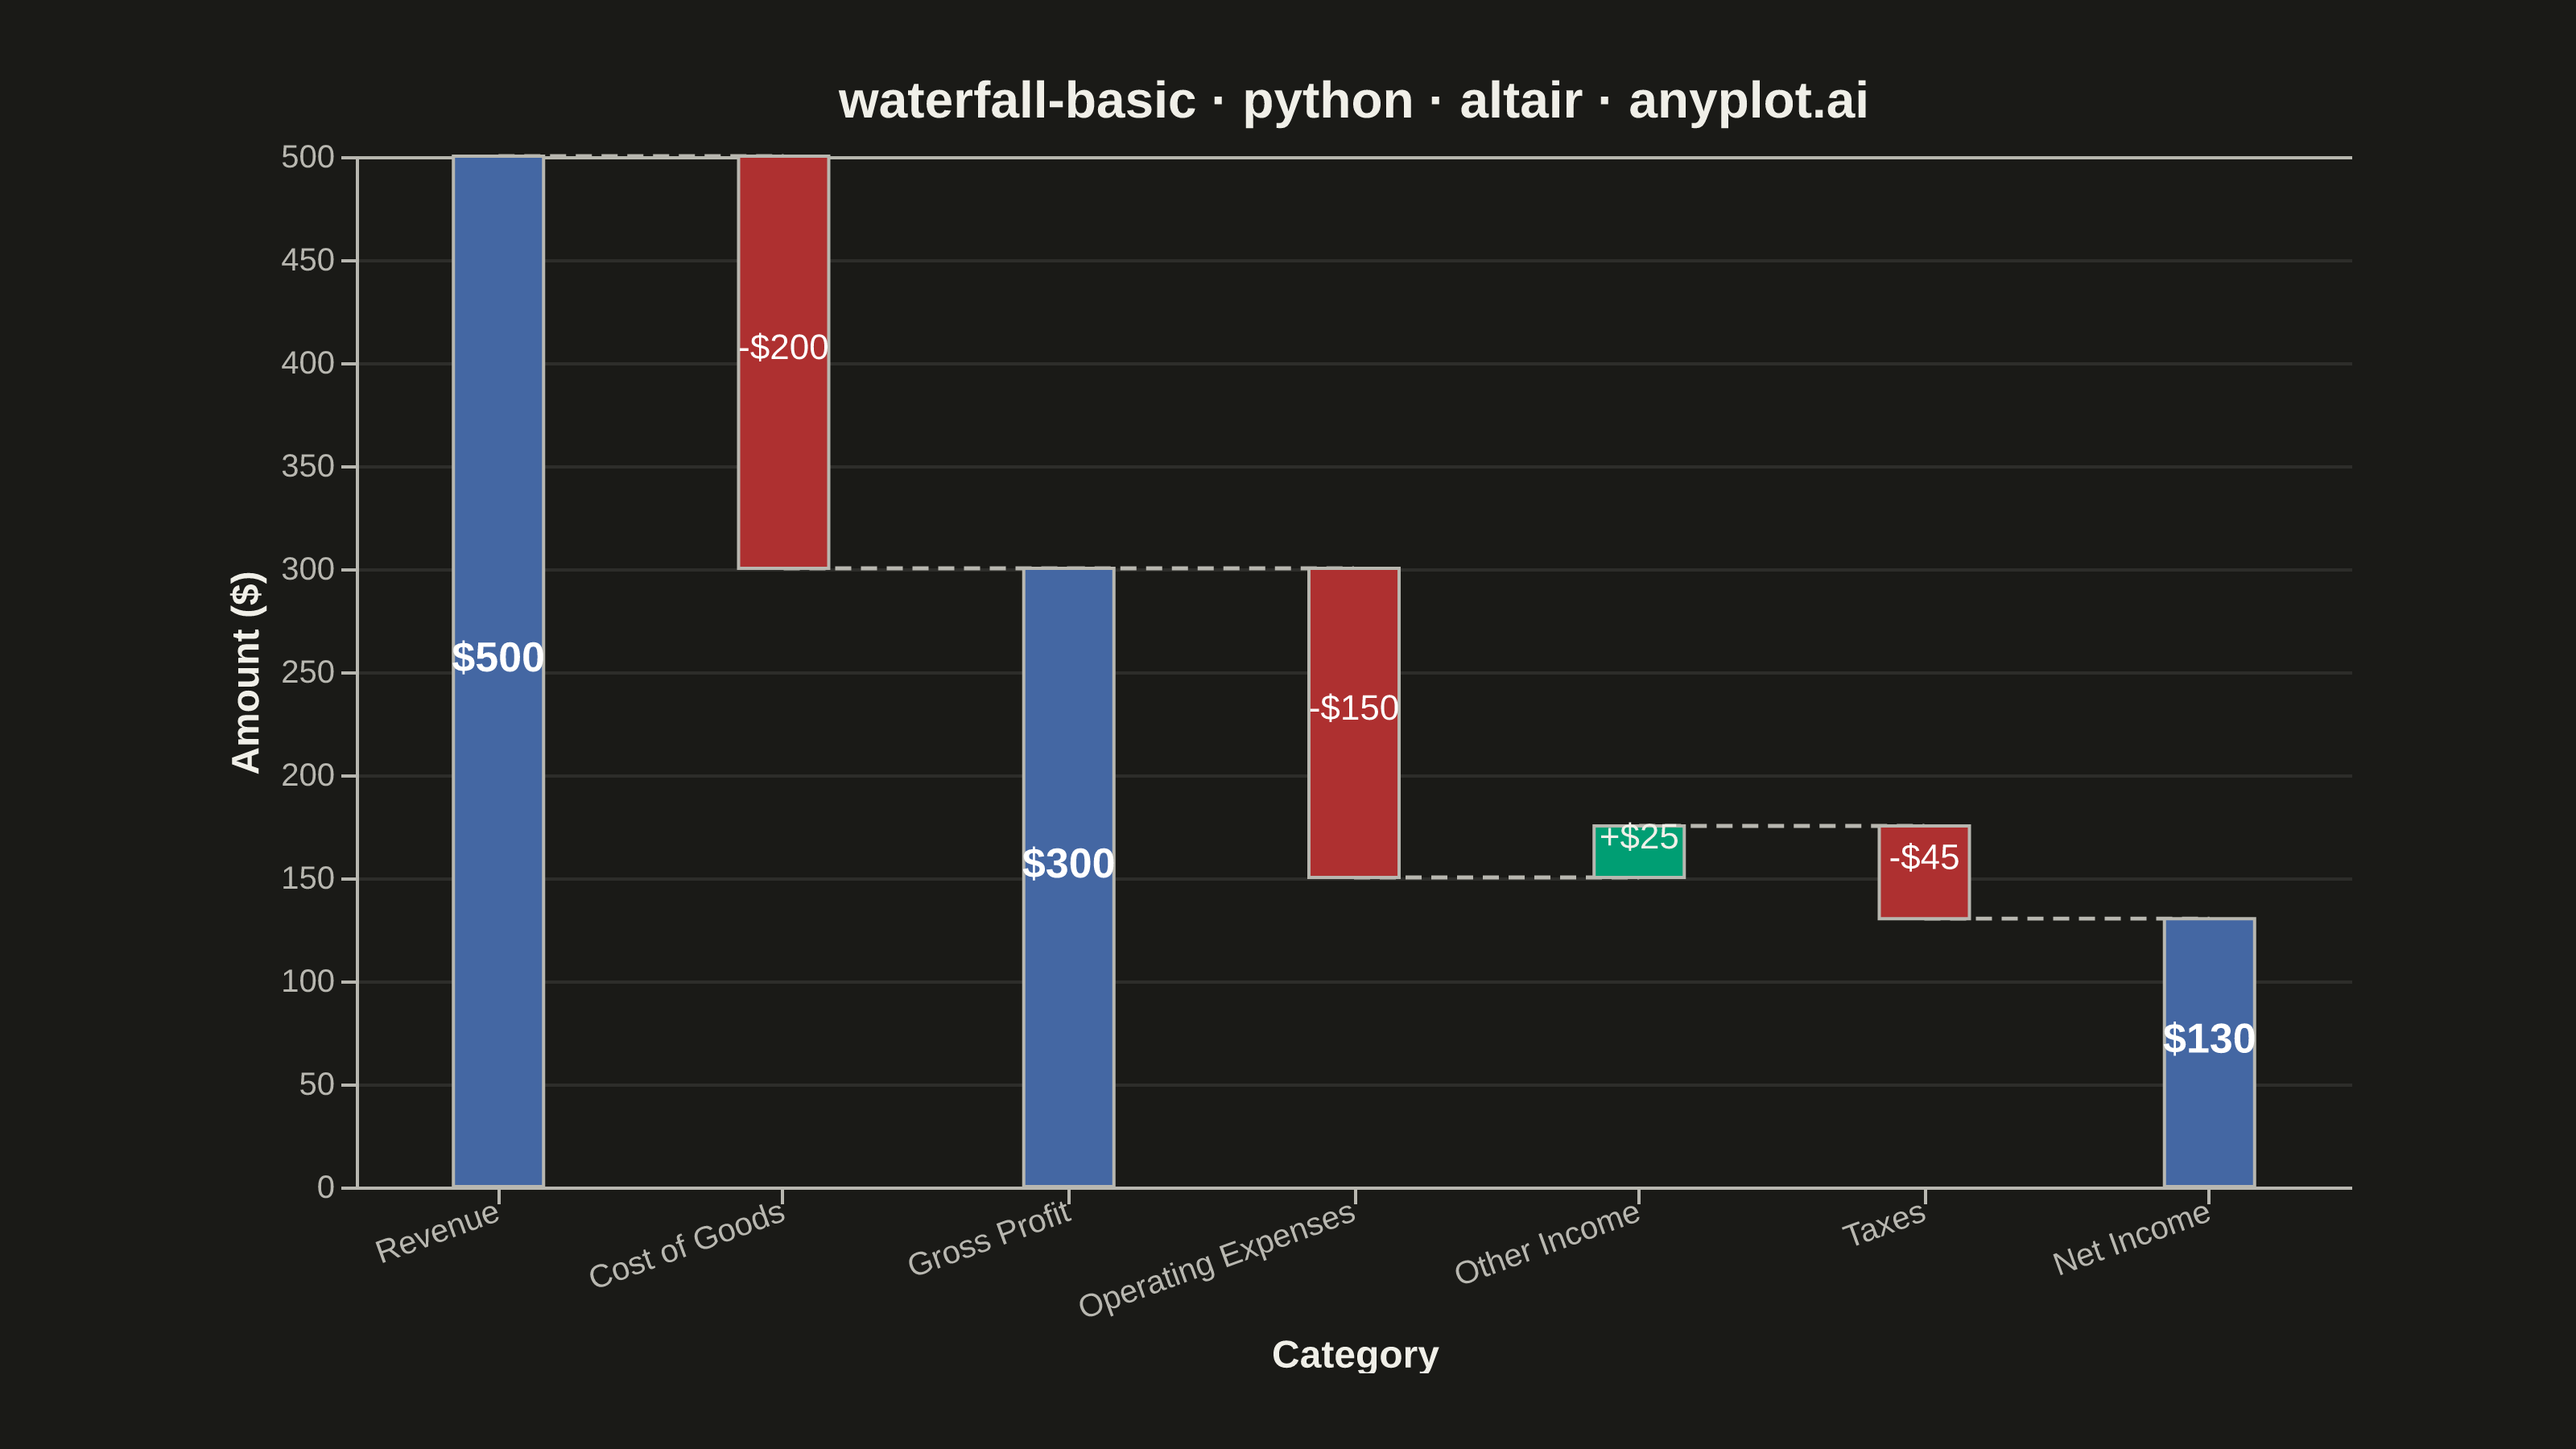
A waterfall chart visualizes how an initial value is affected by a series of intermediate positive or negative values, leading to a final value. Each bar represents a change from the previous cumulative total, with positive values extending upward and negative values extending downward. This chart type is essential for understanding cumulative effects and breaking down the components that contribute to a final result.
""" anyplot.ai
waterfall-basic: Basic Waterfall Chart
Library: altair 6.2.2 | Python 3.13.14
Quality: 92/100 | Updated: 2026-08-04
"""

import os

import altair as alt
import pandas as pd
from PIL import Image


# Theme tokens (see prompts/default-style-guide.md)
THEME = os.getenv("ANYPLOT_THEME", "light")
PAGE_BG = "#FAF8F1" if THEME == "light" else "#1A1A17"
INK = "#1A1A17" if THEME == "light" else "#F0EFE8"
INK_SOFT = "#4A4A44" if THEME == "light" else "#B8B7B0"

# Imprint palette — semantic exception applied: green=gain, matte red=loss, blue=total/baseline
POSITIVE_COLOR = "#009E73"  # Imprint position 1 — brand green, always first
NEGATIVE_COLOR = "#AE3030"  # Imprint position 5 — semantic anchor for loss
TOTAL_COLOR = "#4467A3"  # Imprint position 3 — blue for totals/subtotals

# Data: Quarterly financial breakdown from revenue to net income
categories = ["Revenue", "Cost of Goods", "Gross Profit", "Operating Expenses", "Other Income", "Taxes", "Net Income"]
values = [500, -200, None, -150, 25, -45, None]

# Calculate running totals and bar positions
n = len(categories)
running_total = [0] * n
bar_bottom = [0] * n
bar_top = [0] * n
bar_types = []

running_total[0] = values[0]
bar_bottom[0] = 0
bar_top[0] = values[0]
bar_types.append("total")

current = values[0]
for i in range(1, n):
    if values[i] is None:
        running_total[i] = current
        bar_bottom[i] = 0
        bar_top[i] = current
        bar_types.append("total")
    else:
        running_total[i] = current + values[i]
        if values[i] >= 0:
            bar_bottom[i] = current
            bar_top[i] = current + values[i]
            bar_types.append("positive")
        else:
            bar_bottom[i] = current + values[i]
            bar_top[i] = current
            bar_types.append("negative")
        current = running_total[i]

# Create display values for labels
display_values = []
for i, val in enumerate(values):
    if bar_types[i] == "total":
        display_values.append(f"${int(running_total[i])}")
    elif val >= 0:
        display_values.append(f"+${int(val)}")
    else:
        display_values.append(f"-${int(abs(val))}")

# Create DataFrame for bars
df = pd.DataFrame(
    {
        "category": categories,
        "bar_bottom": bar_bottom,
        "bar_top": bar_top,
        "bar_type": bar_types,
        "running_total": running_total,
        "display_value": display_values,
        "order": list(range(n)),
        "label_y": [(b + t) / 2 for b, t in zip(bar_bottom, bar_top, strict=True)],
    }
)

# Color scale using the Imprint palette (semantic exception: total/positive/negative)
color_scale = alt.Scale(domain=["total", "positive", "negative"], range=[TOTAL_COLOR, POSITIVE_COLOR, NEGATIVE_COLOR])

# Sort by order field
sort_order = alt.EncodingSortField(field="order", order="ascending")

# Bars using bar marks with y and y2
bars = (
    alt.Chart(df)
    .mark_bar(size=28, stroke=INK_SOFT, strokeWidth=1)
    .encode(
        x=alt.X(
            "category:N",
            sort=sort_order,
            title="Category",
            axis=alt.Axis(labelFontSize=10, titleFontSize=12, labelAngle=-20, grid=False),
        ),
        y=alt.Y(
            "bar_bottom:Q", title="Amount ($)", axis=alt.Axis(labelFontSize=10, titleFontSize=12, gridOpacity=0.12)
        ),
        y2=alt.Y2("bar_top:Q"),
        color=alt.Color("bar_type:N", scale=color_scale, legend=None),
    )
)

# Value labels, split by bar_type so each sits on its own fill with solid contrast:
# bold + larger on totals (visual hierarchy anchor), regular + smaller on deltas (secondary).
# White reads best on the dark blue/red fills; ink reads best on the brighter green fill.
total_labels = (
    alt.Chart(df)
    .transform_filter(alt.datum.bar_type == "total")
    .mark_text(fontSize=13, fontWeight="bold", color="#FFFFFF", dy=-4)
    .encode(x=alt.X("category:N", sort=sort_order), y=alt.Y("label_y:Q"), text="display_value:N")
)

positive_labels = (
    alt.Chart(df)
    .transform_filter(alt.datum.bar_type == "positive")
    .mark_text(fontSize=11, fontWeight="normal", color=INK, dy=-4)
    .encode(x=alt.X("category:N", sort=sort_order), y=alt.Y("label_y:Q"), text="display_value:N")
)

negative_labels = (
    alt.Chart(df)
    .transform_filter(alt.datum.bar_type == "negative")
    .mark_text(fontSize=11, fontWeight="normal", color="#FFFFFF", dy=-4)
    .encode(x=alt.X("category:N", sort=sort_order), y=alt.Y("label_y:Q"), text="display_value:N")
)

# Connector lines between cumulative levels
connector_data = []
for i in range(n - 1):
    connector_data.append(
        {"x": categories[i], "x2": categories[i + 1], "y": running_total[i], "order_x": i, "order_x2": i + 1}
    )

df_connectors = pd.DataFrame(connector_data)

connectors = (
    alt.Chart(df_connectors)
    .mark_rule(color=INK_SOFT, strokeDash=[5, 3], strokeWidth=1.2)
    .encode(x=alt.X("x:N", sort=sort_order), x2=alt.X2("x2:N"), y=alt.Y("y:Q"))
)

# Combine all layers
title = "waterfall-basic · python · altair · anyplot.ai"
chart = (
    alt.layer(connectors, bars, total_labels, positive_labels, negative_labels)
    .properties(
        width=620,
        height=320,
        padding={"left": 0, "right": 0, "top": 0, "bottom": 0},
        background=PAGE_BG,
        title=alt.Title(title, fontSize=16, color=INK),
    )
    .configure_view(fill=PAGE_BG, stroke=INK_SOFT, continuousWidth=620, continuousHeight=320)
    .configure_axis(domainColor=INK_SOFT, tickColor=INK_SOFT, gridColor=INK_SOFT, labelColor=INK_SOFT, titleColor=INK)
    .configure_title(color=INK)
)

# Save as PNG (padded to the canonical target) and HTML with theme suffix
chart.save(f"plot-{THEME}.png", scale_factor=4.0)
chart.save(f"plot-{THEME}.html")

# Canvas contract: pad (never crop) the saved PNG up to the exact 3200x1800 target
TW, TH = 3200, 1800
_img = Image.open(f"plot-{THEME}.png").convert("RGB")
_w, _h = _img.size
if _w > TW or _h > TH:
    raise SystemExit(
        f"altair vl-convert produced {_w}x{_h}, exceeds target {TW}x{TH}. "
        f"Shrink chart .properties(width=, height=) values and re-render."
    )
if _w < TW or _h < TH:
    _canvas = Image.new("RGB", (TW, TH), PAGE_BG)
    _canvas.paste(_img, ((TW - _w) // 2, (TH - _h) // 2))
    _canvas.save(f"plot-{THEME}.png")
Runnable source as JSON, for any HTTP client: https://api.anyplot.ai/specs/waterfall-basic/altair/code. Any spec id and library id listed in llms-full.txt fit the same URL shape; every URL below is complete and callable.
{
  "spec_id": "waterfall-basic",
  "language": "python",
  "library": "altair",
  "page": "https://anyplot.ai/waterfall-basic/python/altair",
  "hub": "https://anyplot.ai/waterfall-basic",
  "code_json": "https://api.anyplot.ai/specs/waterfall-basic/altair/code",
  "spec_json": "https://api.anyplot.ai/specs/waterfall-basic",
  "render_light_png": "https://storage.googleapis.com/anyplot-images/plots/waterfall-basic/python/altair/plot-light.png",
  "render_dark_png": "https://storage.googleapis.com/anyplot-images/plots/waterfall-basic/python/altair/plot-dark.png",
  "interactive_light_html": "https://storage.googleapis.com/anyplot-images/plots/waterfall-basic/python/altair/plot-light.html",
  "interactive_dark_html": "https://storage.googleapis.com/anyplot-images/plots/waterfall-basic/python/altair/plot-dark.html",
  "quality_score": 92.0,
  "license": "MIT",
  "guide": "https://anyplot.ai/llms.txt"
}
Part of Basic Waterfall Chart on anyplot.ai.