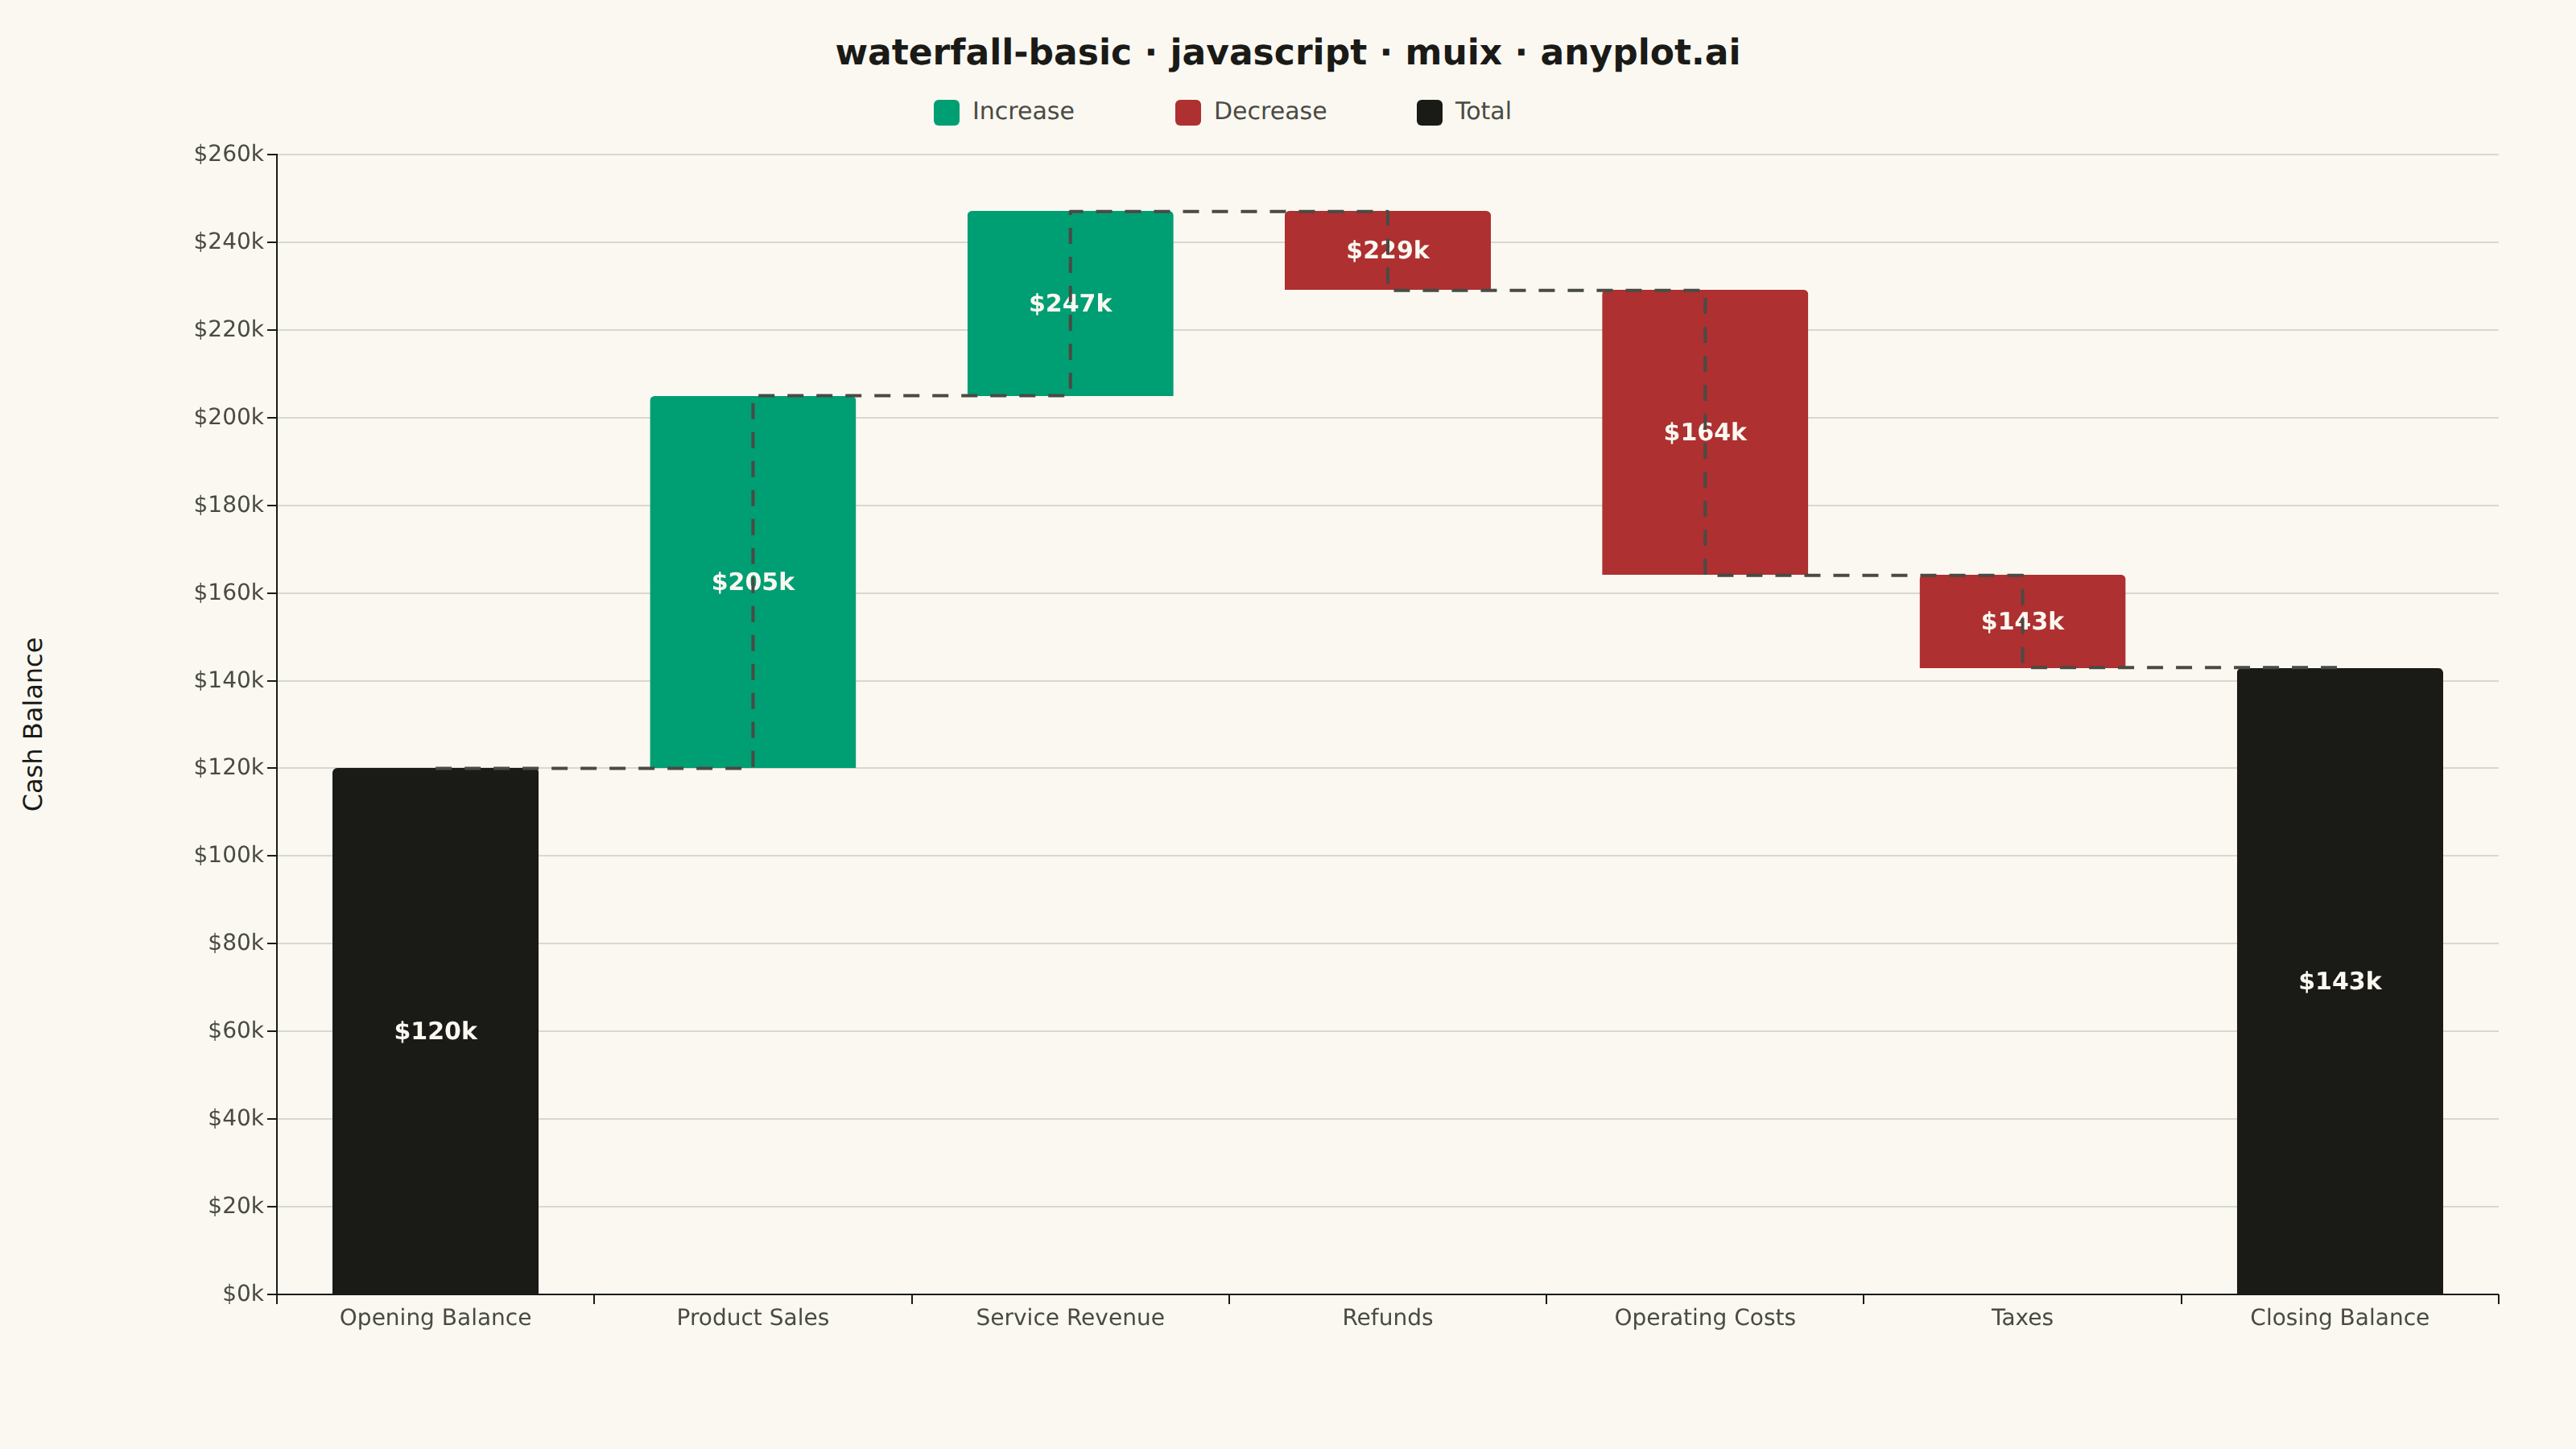
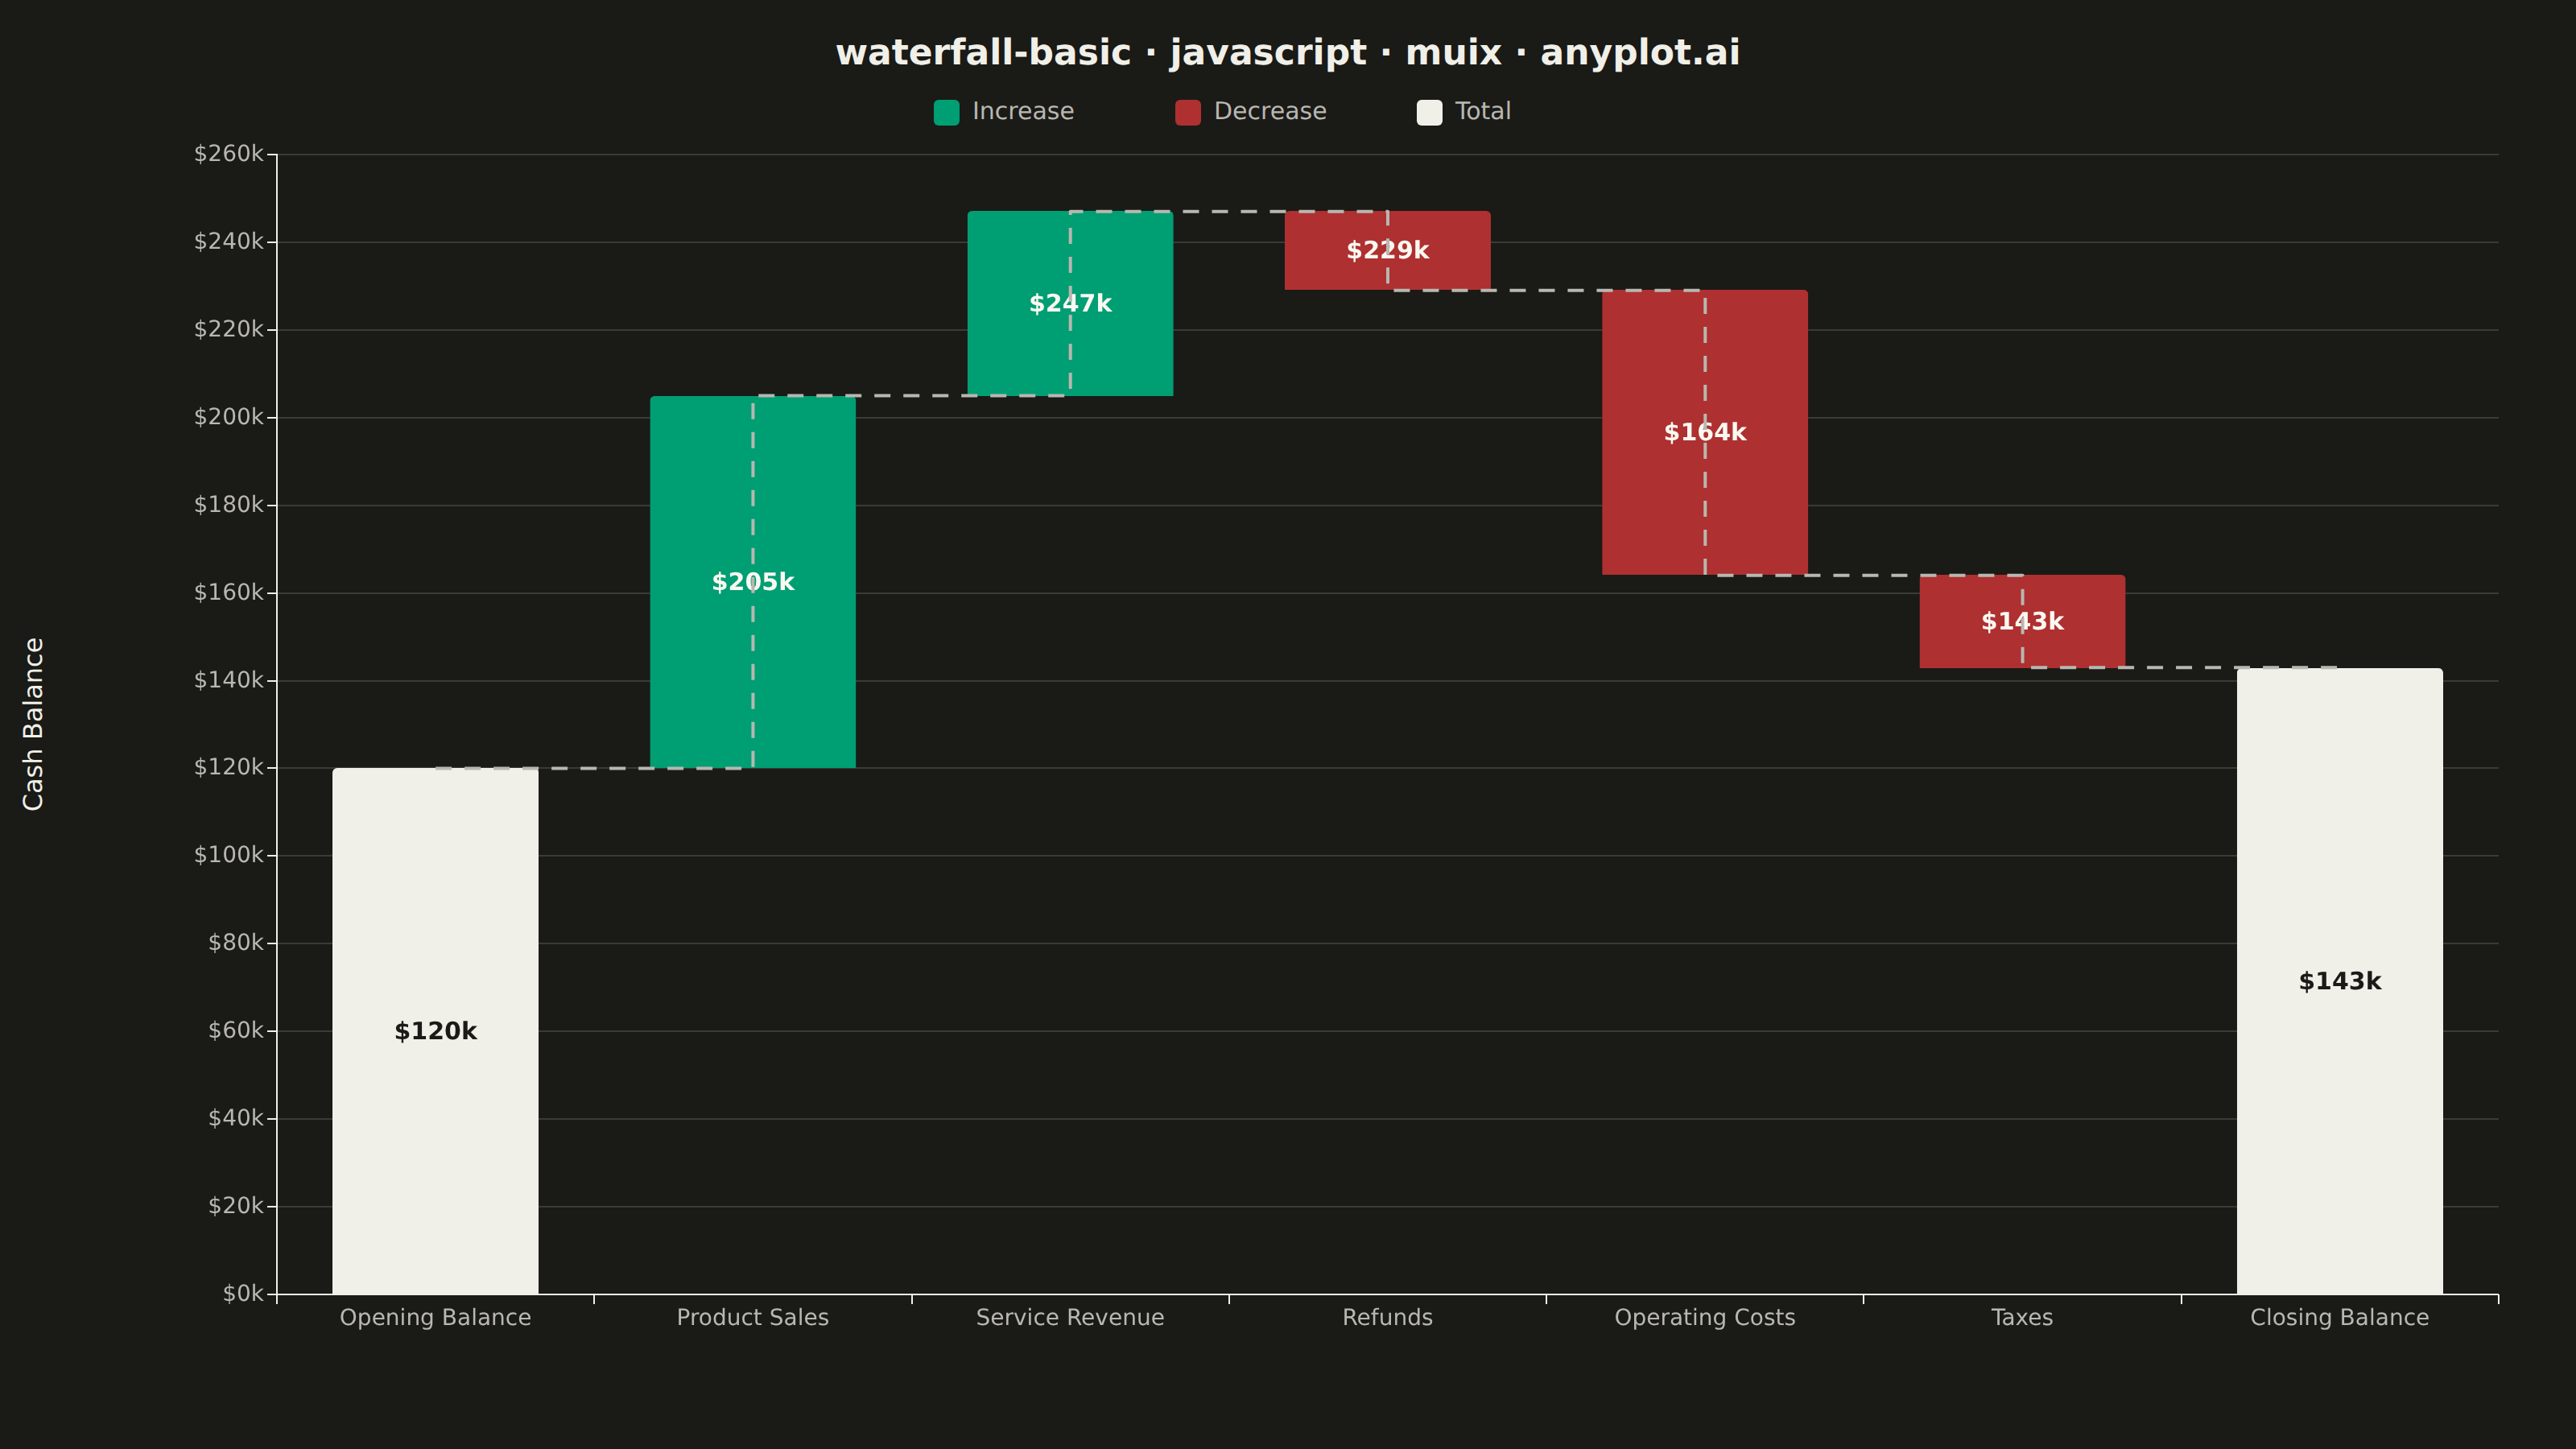
A waterfall chart visualizes how an initial value is affected by a series of intermediate positive or negative values, leading to a final value. Each bar represents a change from the previous cumulative total, with positive values extending upward and negative values extending downward. This chart type is essential for understanding cumulative effects and breaking down the components that contribute to a final result.
// anyplot.ai
// waterfall-basic: Basic Waterfall Chart
// Library: muix 7.29.1 | JavaScript 22.23.1
// Quality: 92/100 | Created: 2026-08-04
//# anyplot-orientation: landscape
// anyplot.ai
// waterfall-basic: Basic Waterfall Chart
// Library: MUI X Charts | React | Node 22
// License: @mui/x-charts — MIT (community). Pro/Premium are out of scope.
// Quality: pending | Created: 2026-08-04

import { ChartContainer } from "@mui/x-charts/ChartContainer";
import { BarPlot } from "@mui/x-charts/BarChart";
import { LinePlot } from "@mui/x-charts/LineChart";
import { ChartsXAxis } from "@mui/x-charts/ChartsXAxis";
import { ChartsYAxis } from "@mui/x-charts/ChartsYAxis";
import { ChartsGrid } from "@mui/x-charts/ChartsGrid";

const t = window.ANYPLOT_TOKENS;
const FONT = "system-ui, -apple-system, sans-serif";
const TITLE = "waterfall-basic · javascript · muix · anyplot.ai";

// --- Data (in-memory, deterministic) ----------------------------------------
// Quarterly cash bridge: opening balance -> revenue additions & cost/tax
// deductions -> closing balance. First and last steps are totals; the
// middle steps are signed changes (positive = inflow, negative = outflow).
const categories = [
  "Opening Balance",
  "Product Sales",
  "Service Revenue",
  "Refunds",
  "Operating Costs",
  "Taxes",
  "Closing Balance",
];
const deltas = [120000, 85000, 42000, -18000, -65000, -21000, 143000];
const isEdge = (i) => i === 0 || i === deltas.length - 1;

// Running total after each step (edges are absolute totals, not deltas).
let running = 0;
const runningTotal = deltas.map((d, i) => {
  running = isEdge(i) ? d : running + d;
  return running;
});

// Floating bars built from a stack of 4 series sharing one `stack` key:
//  - base:     invisible filler that lifts the visible segment off the axis
//  - increase: visible segment for positive changes (brand green)
//  - decrease: visible segment for negative changes (semantic red)
//  - total:    full-height bar for the opening/closing totals (neutral ink)
const baseData = deltas.map((d, i) => (isEdge(i) ? null : d >= 0 ? runningTotal[i - 1] : runningTotal[i]));
const increaseData = deltas.map((d, i) => (!isEdge(i) && d >= 0 ? d : null));
const decreaseData = deltas.map((d, i) => (!isEdge(i) && d < 0 ? -d : null));
const totalData = deltas.map((d, i) => (isEdge(i) ? d : null));

const formatMoney = (v) => `$${Math.round(v / 1000)}k`;

// Increase/decrease fills stay the same saturated green/red in both themes, so
// their bar labels need a fixed light ink rather than the theme-flipping PAGE_BG
// (PAGE_BG in dark mode is near-black, which fails contrast on the matte red).
const ON_COLOR_TEXT = "#FAF8F1";

// --- Chart (default-exported component — the harness mounts it) -------------
export default function Chart() {
  const W = window.ANYPLOT_SIZE.width;
  const H = window.ANYPLOT_SIZE.height;
  const margin = { top: 96, right: 48, bottom: 96, left: 172 };

  return (
    <ChartContainer
      width={W}
      height={H}
      margin={margin}
      skipAnimation
      series={[
        {
          type: "bar",
          id: "base",
          stack: "waterfall",
          data: baseData,
          color: "transparent",
        },
        {
          type: "bar",
          id: "increase",
          stack: "waterfall",
          data: increaseData,
          color: t.palette[0],
          label: "Increase",
        },
        {
          type: "bar",
          id: "decrease",
          stack: "waterfall",
          data: decreaseData,
          color: t.palette[4],
          label: "Decrease",
        },
        {
          type: "bar",
          id: "total",
          stack: "waterfall",
          data: totalData,
          color: t.ink,
          label: "Total",
        },
        {
          type: "line",
          id: "flow",
          data: runningTotal,
          color: t.inkSoft,
          curve: "stepAfter",
          showMark: false,
          disableHighlight: true,
        },
      ]}
      xAxis={[{ scaleType: "band", data: categories, categoryGapRatio: 0.35 }]}
      yAxis={[{ scaleType: "linear", min: 0, valueFormatter: formatMoney }]}
    >
      {/* Title */}
      <text x={W / 2} y={40} textAnchor="middle" fontSize={22} fontWeight={600} fill={t.ink} fontFamily={FONT}>
        {TITLE}
      </text>

      {/* Legend — small color-coded swatches for the three semantic bar roles */}
      <g fontFamily={FONT}>
        {[
          { label: "Increase", color: t.palette[0] },
          { label: "Decrease", color: t.palette[4] },
          { label: "Total", color: t.ink },
        ].map((item, i) => {
          const x = W / 2 - 220 + i * 150;
          return (
            <g key={item.label}>
              <rect x={x} y={62} width={16} height={16} rx={3} fill={item.color} />
              <text x={x + 24} y={74} fontSize={15} fill={t.inkSoft}>
                {item.label}
              </text>
            </g>
          );
        })}
      </g>

      <ChartsGrid horizontal />
      <BarPlot
        skipAnimation
        borderRadius={3}
        barLabel={(item) =>
          item.seriesId === "base" || item.value == null ? null : formatMoney(runningTotal[item.dataIndex])
        }
        slotProps={{
          barLabel: (ownerState) => ({
            style: {
              fontFamily: FONT,
              fontSize: 15,
              fontWeight: 700,
              fill: ownerState.seriesId === "total" ? t.pageBg : ON_COLOR_TEXT,
            },
          }),
        }}
      />
      <LinePlot skipAnimation strokeDasharray="10 8" strokeWidth={2} />

      <ChartsXAxis
        tickLabelStyle={{ fontSize: 14, fill: t.inkSoft, fontFamily: FONT }}
        stroke={t.inkSoft}
      />
      <ChartsYAxis
        tickLabelStyle={{ fontSize: 14, fill: t.inkSoft, fontFamily: FONT }}
        stroke={t.inkSoft}
      />

      {/* Y-axis title, drawn by hand: ChartsYAxis's built-in `label` uses a fixed
          small offset from the axis line that doesn't grow with wide "$Xk" tick
          text, so it collides with the ticks — positioning it ourselves avoids
          that. */}
      <text
        x={26}
        y={margin.top + (H - margin.top - margin.bottom) / 2}
        textAnchor="middle"
        transform={`rotate(-90, 26, ${margin.top + (H - margin.top - margin.bottom) / 2})`}
        fontSize={16}
        fill={t.ink}
        fontFamily={FONT}
      >
        Cash Balance
      </text>
    </ChartContainer>
  );
}
Runnable source as JSON, for any HTTP client: https://api.anyplot.ai/specs/waterfall-basic/muix/code. Any spec id and library id listed in llms-full.txt fit the same URL shape; every URL below is complete and callable.
{
  "spec_id": "waterfall-basic",
  "language": "javascript",
  "library": "muix",
  "page": "https://anyplot.ai/waterfall-basic/javascript/muix",
  "hub": "https://anyplot.ai/waterfall-basic",
  "code_json": "https://api.anyplot.ai/specs/waterfall-basic/muix/code",
  "spec_json": "https://api.anyplot.ai/specs/waterfall-basic",
  "render_light_png": "https://storage.googleapis.com/anyplot-images/plots/waterfall-basic/javascript/muix/plot-light.png",
  "render_dark_png": "https://storage.googleapis.com/anyplot-images/plots/waterfall-basic/javascript/muix/plot-dark.png",
  "interactive_light_html": "https://storage.googleapis.com/anyplot-images/plots/waterfall-basic/javascript/muix/plot-light.html",
  "interactive_dark_html": "https://storage.googleapis.com/anyplot-images/plots/waterfall-basic/javascript/muix/plot-dark.html",
  "quality_score": 92.0,
  "license": "MIT",
  "guide": "https://anyplot.ai/llms.txt"
}
Part of Basic Waterfall Chart on anyplot.ai.