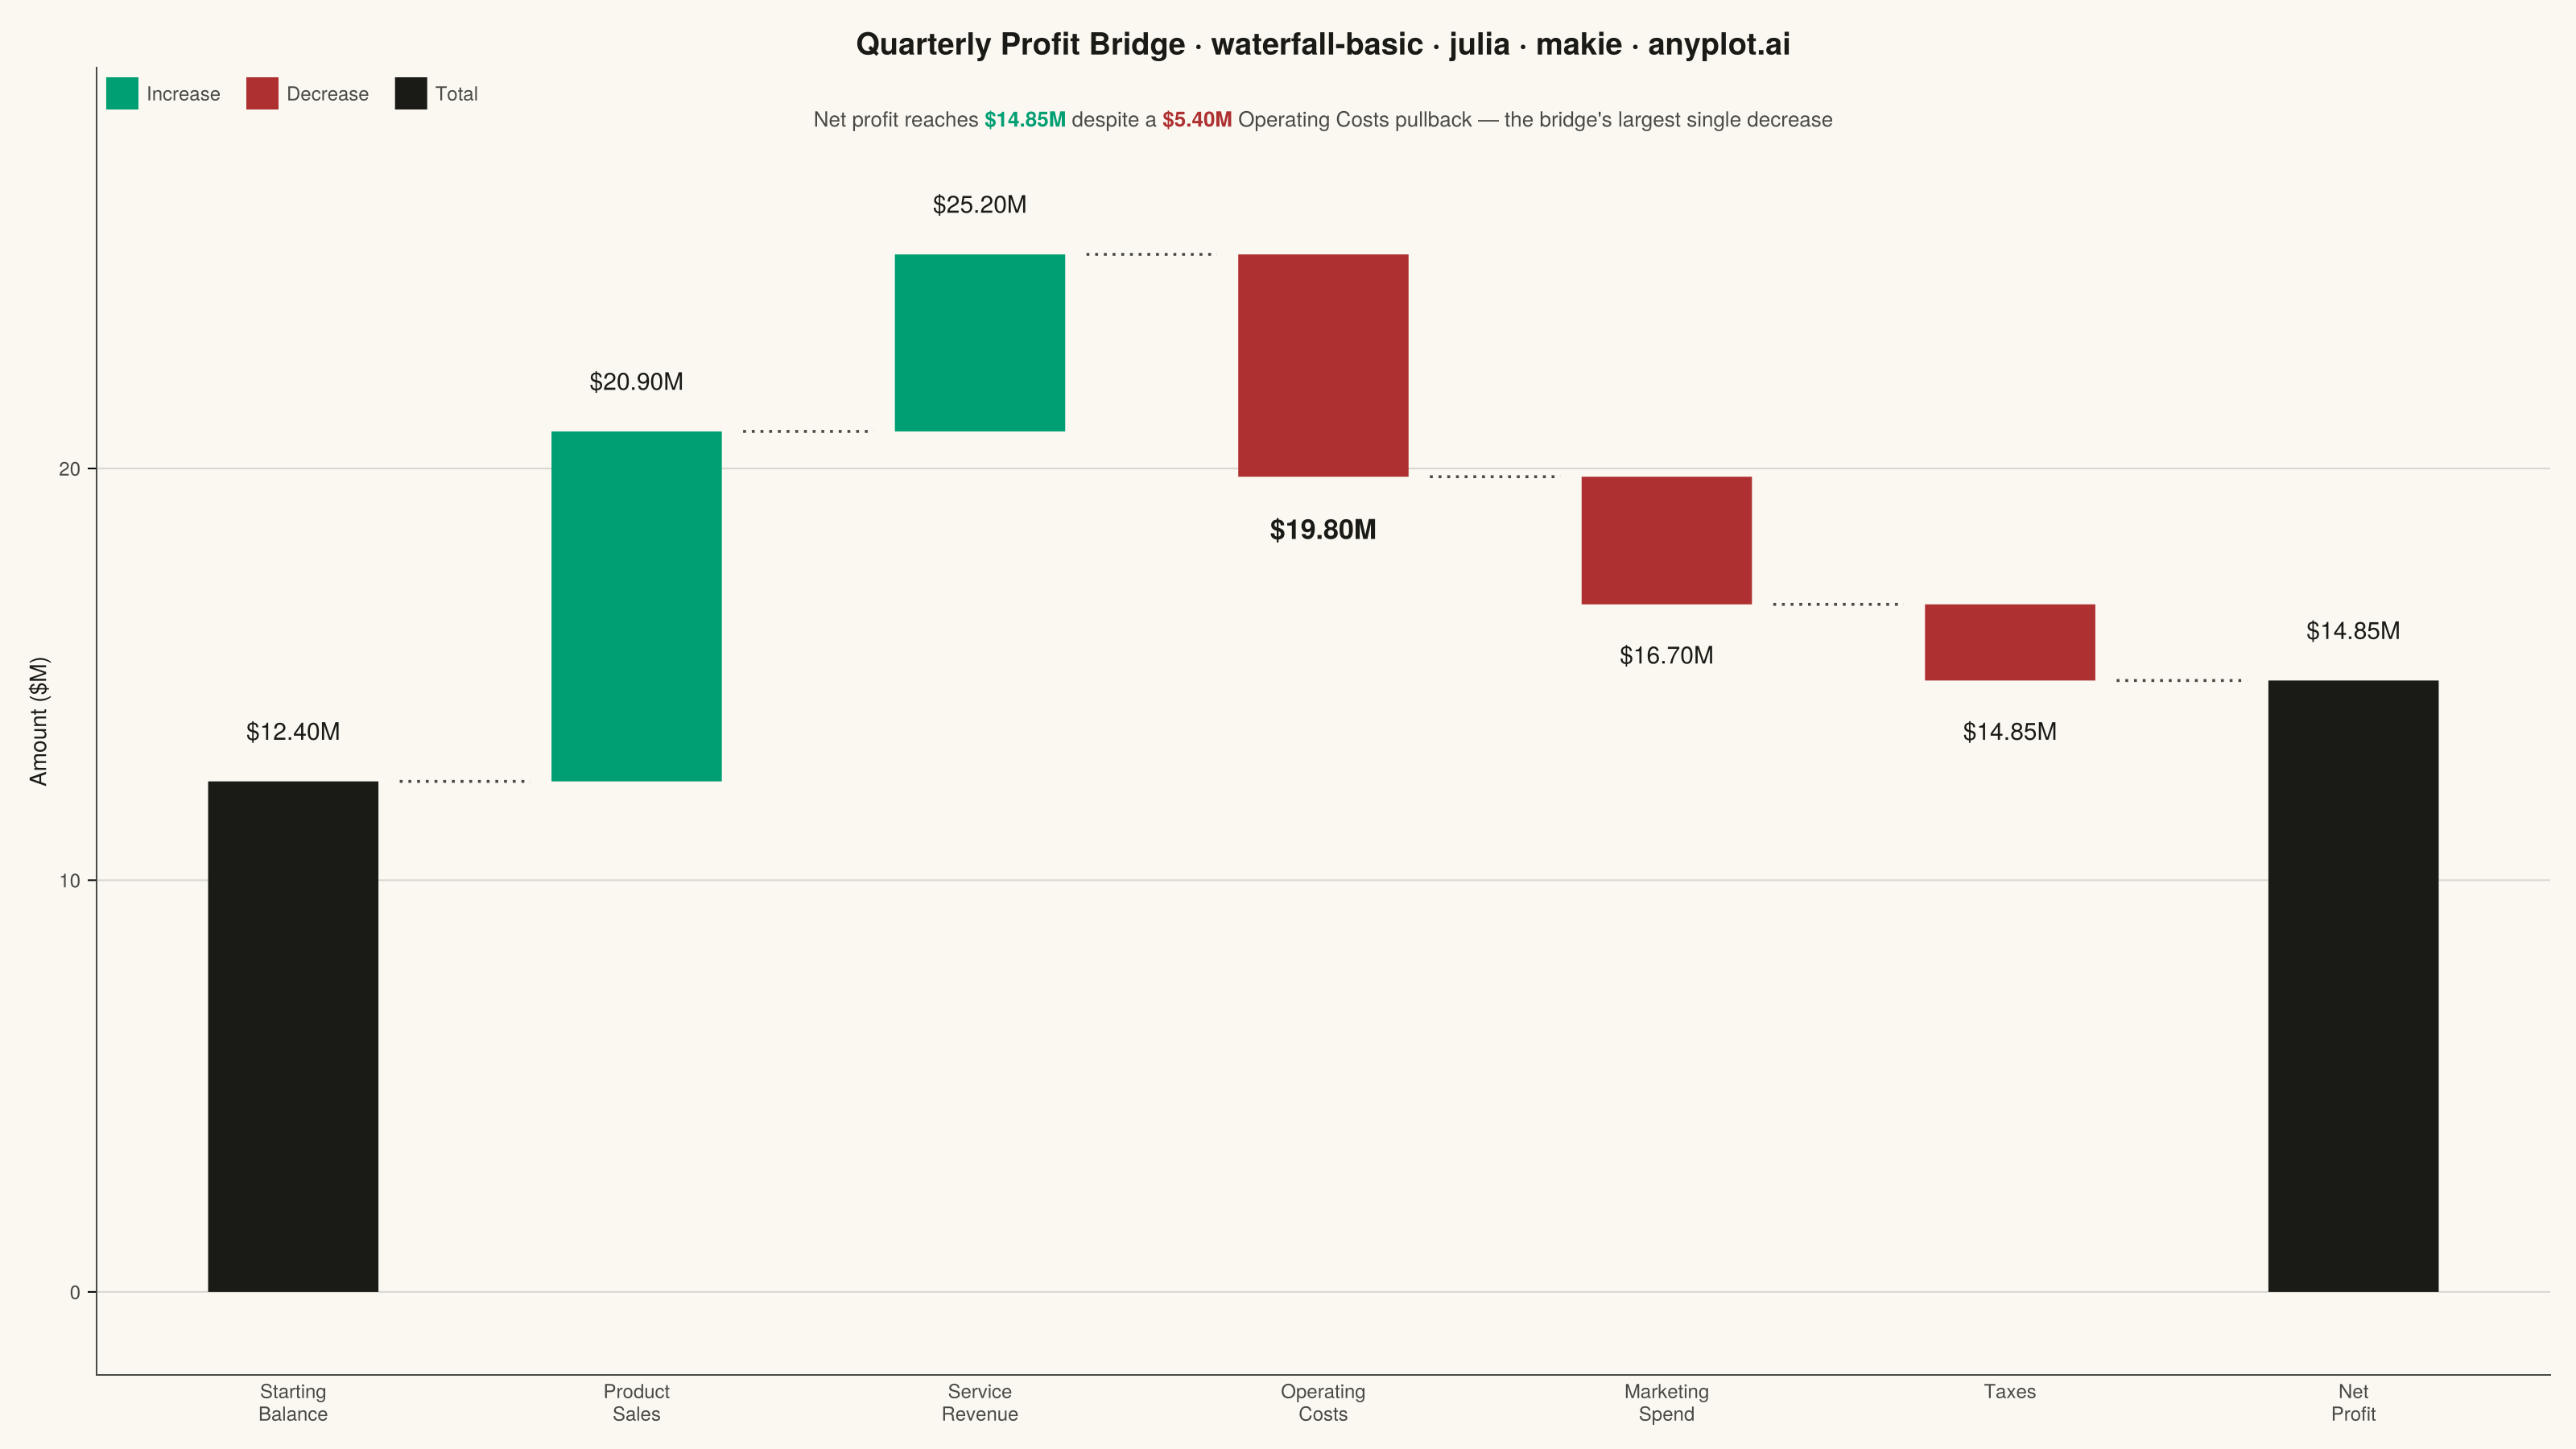
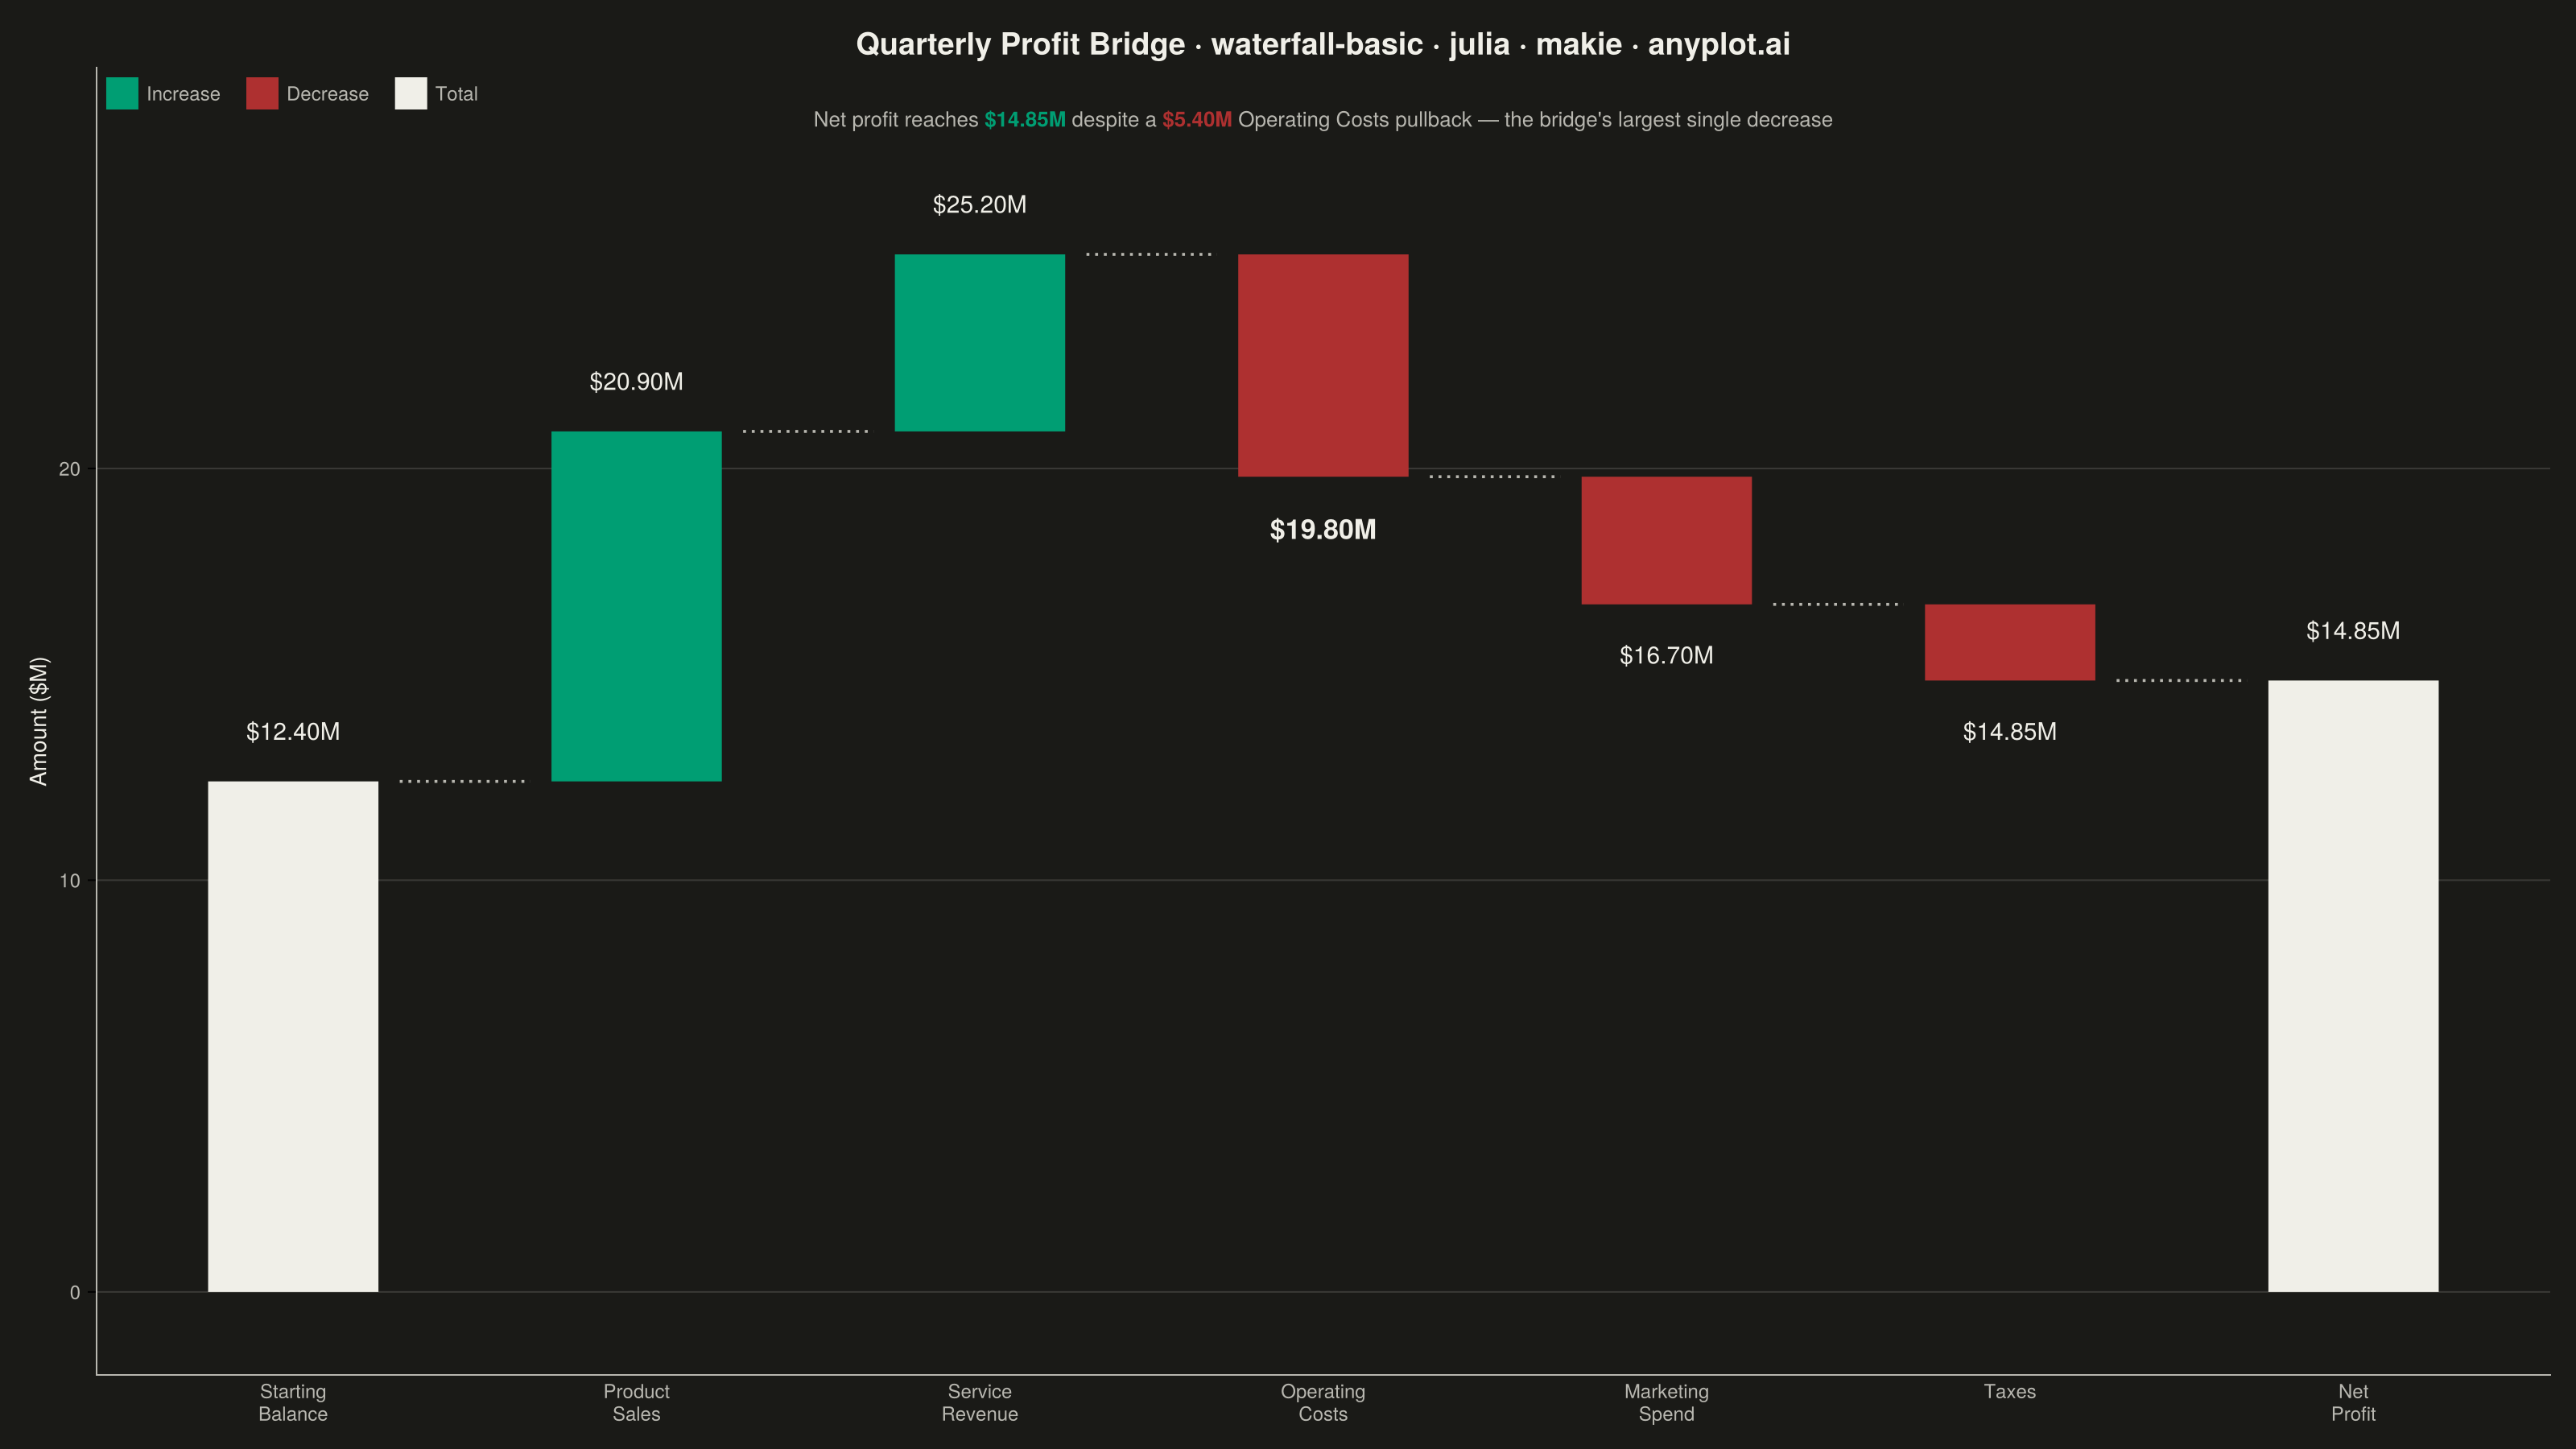
A waterfall chart visualizes how an initial value is affected by a series of intermediate positive or negative values, leading to a final value. Each bar represents a change from the previous cumulative total, with positive values extending upward and negative values extending downward. This chart type is essential for understanding cumulative effects and breaking down the components that contribute to a final result.
# anyplot.ai
# waterfall-basic: Basic Waterfall Chart
# Library: makie 0.21.9 | Julia 1.11.9
# Quality: 93/100 | Created: 2026-08-04

using CairoMakie
using Colors
using Printf

# --- Theme tokens -------------------------------------------------------------
const THEME    = get(ENV, "ANYPLOT_THEME", "light")
const PAGE_BG  = THEME == "light" ? colorant"#FAF8F1" : colorant"#1A1A17"
const INK      = THEME == "light" ? colorant"#1A1A17" : colorant"#F0EFE8"
const INK_SOFT = THEME == "light" ? colorant"#4A4A44" : colorant"#B8B7B0"

const IMPRINT_PALETTE = [
    colorant"#009E73", colorant"#C475FD", colorant"#4467A3", colorant"#BD8233",
    colorant"#AE3030", colorant"#2ABCCD", colorant"#954477", colorant"#99B314",
]
const BRAND   = IMPRINT_PALETTE[1]  # Imprint palette position 1 — increases
const LOSS    = IMPRINT_PALETTE[5]  # Imprint semantic anchor for loss — decreases
const NEUTRAL = INK                 # theme-adaptive neutral — start/end totals

# --- Data: quarterly profit bridge, $ millions --------------------------------
categories = ["Starting\nBalance", "Product\nSales", "Service\nRevenue",
              "Operating\nCosts", "Marketing\nSpend", "Taxes", "Net\nProfit"]
deltas   = [12.4, 8.5, 4.3, -5.4, -3.1, -1.85, 0.0]
is_total = [true, false, false, false, false, false, true]
n = length(categories)

running = zeros(Float64, n)
running[1] = deltas[1]
for i in 2:(n - 1)
    running[i] = running[i - 1] + deltas[i]
end
running[n] = running[n - 1]

bottoms = zeros(Float64, n)
tops = zeros(Float64, n)
bar_colors = Vector{typeof(BRAND)}(undef, n)
for i in 1:n
    if is_total[i]
        bottoms[i] = 0.0
        tops[i] = running[i]
        bar_colors[i] = NEUTRAL
    else
        lo, hi = extrema((running[i - 1], running[i]))
        bottoms[i] = lo
        tops[i] = hi
        bar_colors[i] = deltas[i] >= 0 ? BRAND : LOSS
    end
end

# --- Title (fontsize scaled to length — see plot-generator.md) ----------------
title_str = "Quarterly Profit Bridge · waterfall-basic · julia · makie · anyplot.ai"
title_fontsize = round(Int, 20 * min(1.0, 67 / length(title_str)))

# --- Plot -----------------------------------------------------------------------
fig = Figure(
    resolution      = (1600, 900),
    fontsize        = 14,
    backgroundcolor = PAGE_BG,
)

ax = Axis(
    fig[1, 1];
    title              = title_str,
    titlesize          = title_fontsize,
    titlecolor         = INK,
    ylabel             = "Amount (\$M)",
    ylabelsize         = 14,
    ylabelcolor        = INK,
    xticklabelcolor    = INK_SOFT,
    yticklabelcolor    = INK_SOFT,
    xticklabelsize     = 12,
    yticklabelsize     = 12,
    backgroundcolor    = PAGE_BG,
    topspinevisible    = false,
    rightspinevisible  = false,
    leftspinecolor     = INK_SOFT,
    bottomspinecolor   = INK_SOFT,
    xgridvisible       = false,
    ygridcolor         = RGBAf(INK.r, INK.g, INK.b, 0.15),
    xticks             = (1:n, categories),
    xticksvisible      = false,
)

bar_width = 0.62
barplot!(ax, 1:n, tops; fillto = bottoms, color = bar_colors, width = bar_width, strokewidth = 0)

# Connecting lines linking each bar's cumulative level to the next bar's start
half = bar_width / 2
for i in 1:(n - 1)
    level = running[i]
    lines!(ax, [i + half, i + 1 - half], [level, level];
        color = INK_SOFT, linewidth = 1.8, linestyle = :dot)
end

# The largest single decrease gets a bolder, slightly larger label to call
# out the focal point of the bridge.
decrease_idxs = findall(i -> !is_total[i] && deltas[i] < 0, 1:n)
biggest_idx = decrease_idxs[argmax(abs.(deltas[decrease_idxs]))]
biggest_label = replace(categories[biggest_idx], "\n" => " ")

# Running total labels — above the bar for increases/totals, below for decreases
label_offset = maximum(tops) * 0.035
for i in 1:n
    label = @sprintf("\$%.2fM", running[i])
    emphasize = i == biggest_idx
    lbl_fontsize = emphasize ? 17 : 15
    lbl_font = emphasize ? :bold : :regular
    if is_total[i] || deltas[i] >= 0
        text!(ax, i, tops[i] + label_offset; text = label,
            align = (:center, :bottom), color = INK, fontsize = lbl_fontsize, font = lbl_font)
    else
        text!(ax, i, bottoms[i] - label_offset; text = label,
            align = (:center, :top), color = INK, fontsize = lbl_fontsize, font = lbl_font)
    end
end

# Subtitle annotation summarizing the bridge's focal point, set in the axis's
# relative-space headroom above the tallest bar — a Makie `rich()` touch that
# mixes weight/color within a single text object to call out the two key figures.
subtitle_rich = rich(
    "Net profit reaches ",
    rich(@sprintf("\$%.2fM", running[end]); color = BRAND, font = :bold),
    " despite a ",
    rich(@sprintf("\$%.2fM", abs(deltas[biggest_idx])); color = LOSS, font = :bold),
    " $biggest_label pullback — the bridge's largest single decrease",
)
text!(ax, 0.5, 0.97; space = :relative, text = subtitle_rich,
    align = (:center, :top), fontsize = 13, color = INK_SOFT)

ylims!(ax, -maximum(tops) * 0.08, maximum(tops) * 1.18)

elements = [PolyElement(color = BRAND), PolyElement(color = LOSS), PolyElement(color = NEUTRAL)]
Legend(fig[1, 1], elements, ["Increase", "Decrease", "Total"];
    tellwidth = false, tellheight = false,
    halign = :left, valign = :top,
    orientation = :horizontal,
    framevisible = false,
    labelcolor = INK_SOFT,
    labelsize = 12,
    backgroundcolor = :transparent,
)

# --- Save -----------------------------------------------------------------------
save("plot-$(THEME).png", fig; px_per_unit = 2)
Runnable source as JSON, for any HTTP client: https://api.anyplot.ai/specs/waterfall-basic/makie/code. Any spec id and library id listed in llms-full.txt fit the same URL shape; every URL below is complete and callable.
{
  "spec_id": "waterfall-basic",
  "language": "julia",
  "library": "makie",
  "page": "https://anyplot.ai/waterfall-basic/julia/makie",
  "hub": "https://anyplot.ai/waterfall-basic",
  "code_json": "https://api.anyplot.ai/specs/waterfall-basic/makie/code",
  "spec_json": "https://api.anyplot.ai/specs/waterfall-basic",
  "render_light_png": "https://storage.googleapis.com/anyplot-images/plots/waterfall-basic/julia/makie/plot-light.png",
  "render_dark_png": "https://storage.googleapis.com/anyplot-images/plots/waterfall-basic/julia/makie/plot-dark.png",
  "quality_score": 93.0,
  "license": "MIT",
  "guide": "https://anyplot.ai/llms.txt"
}
Part of Basic Waterfall Chart on anyplot.ai.