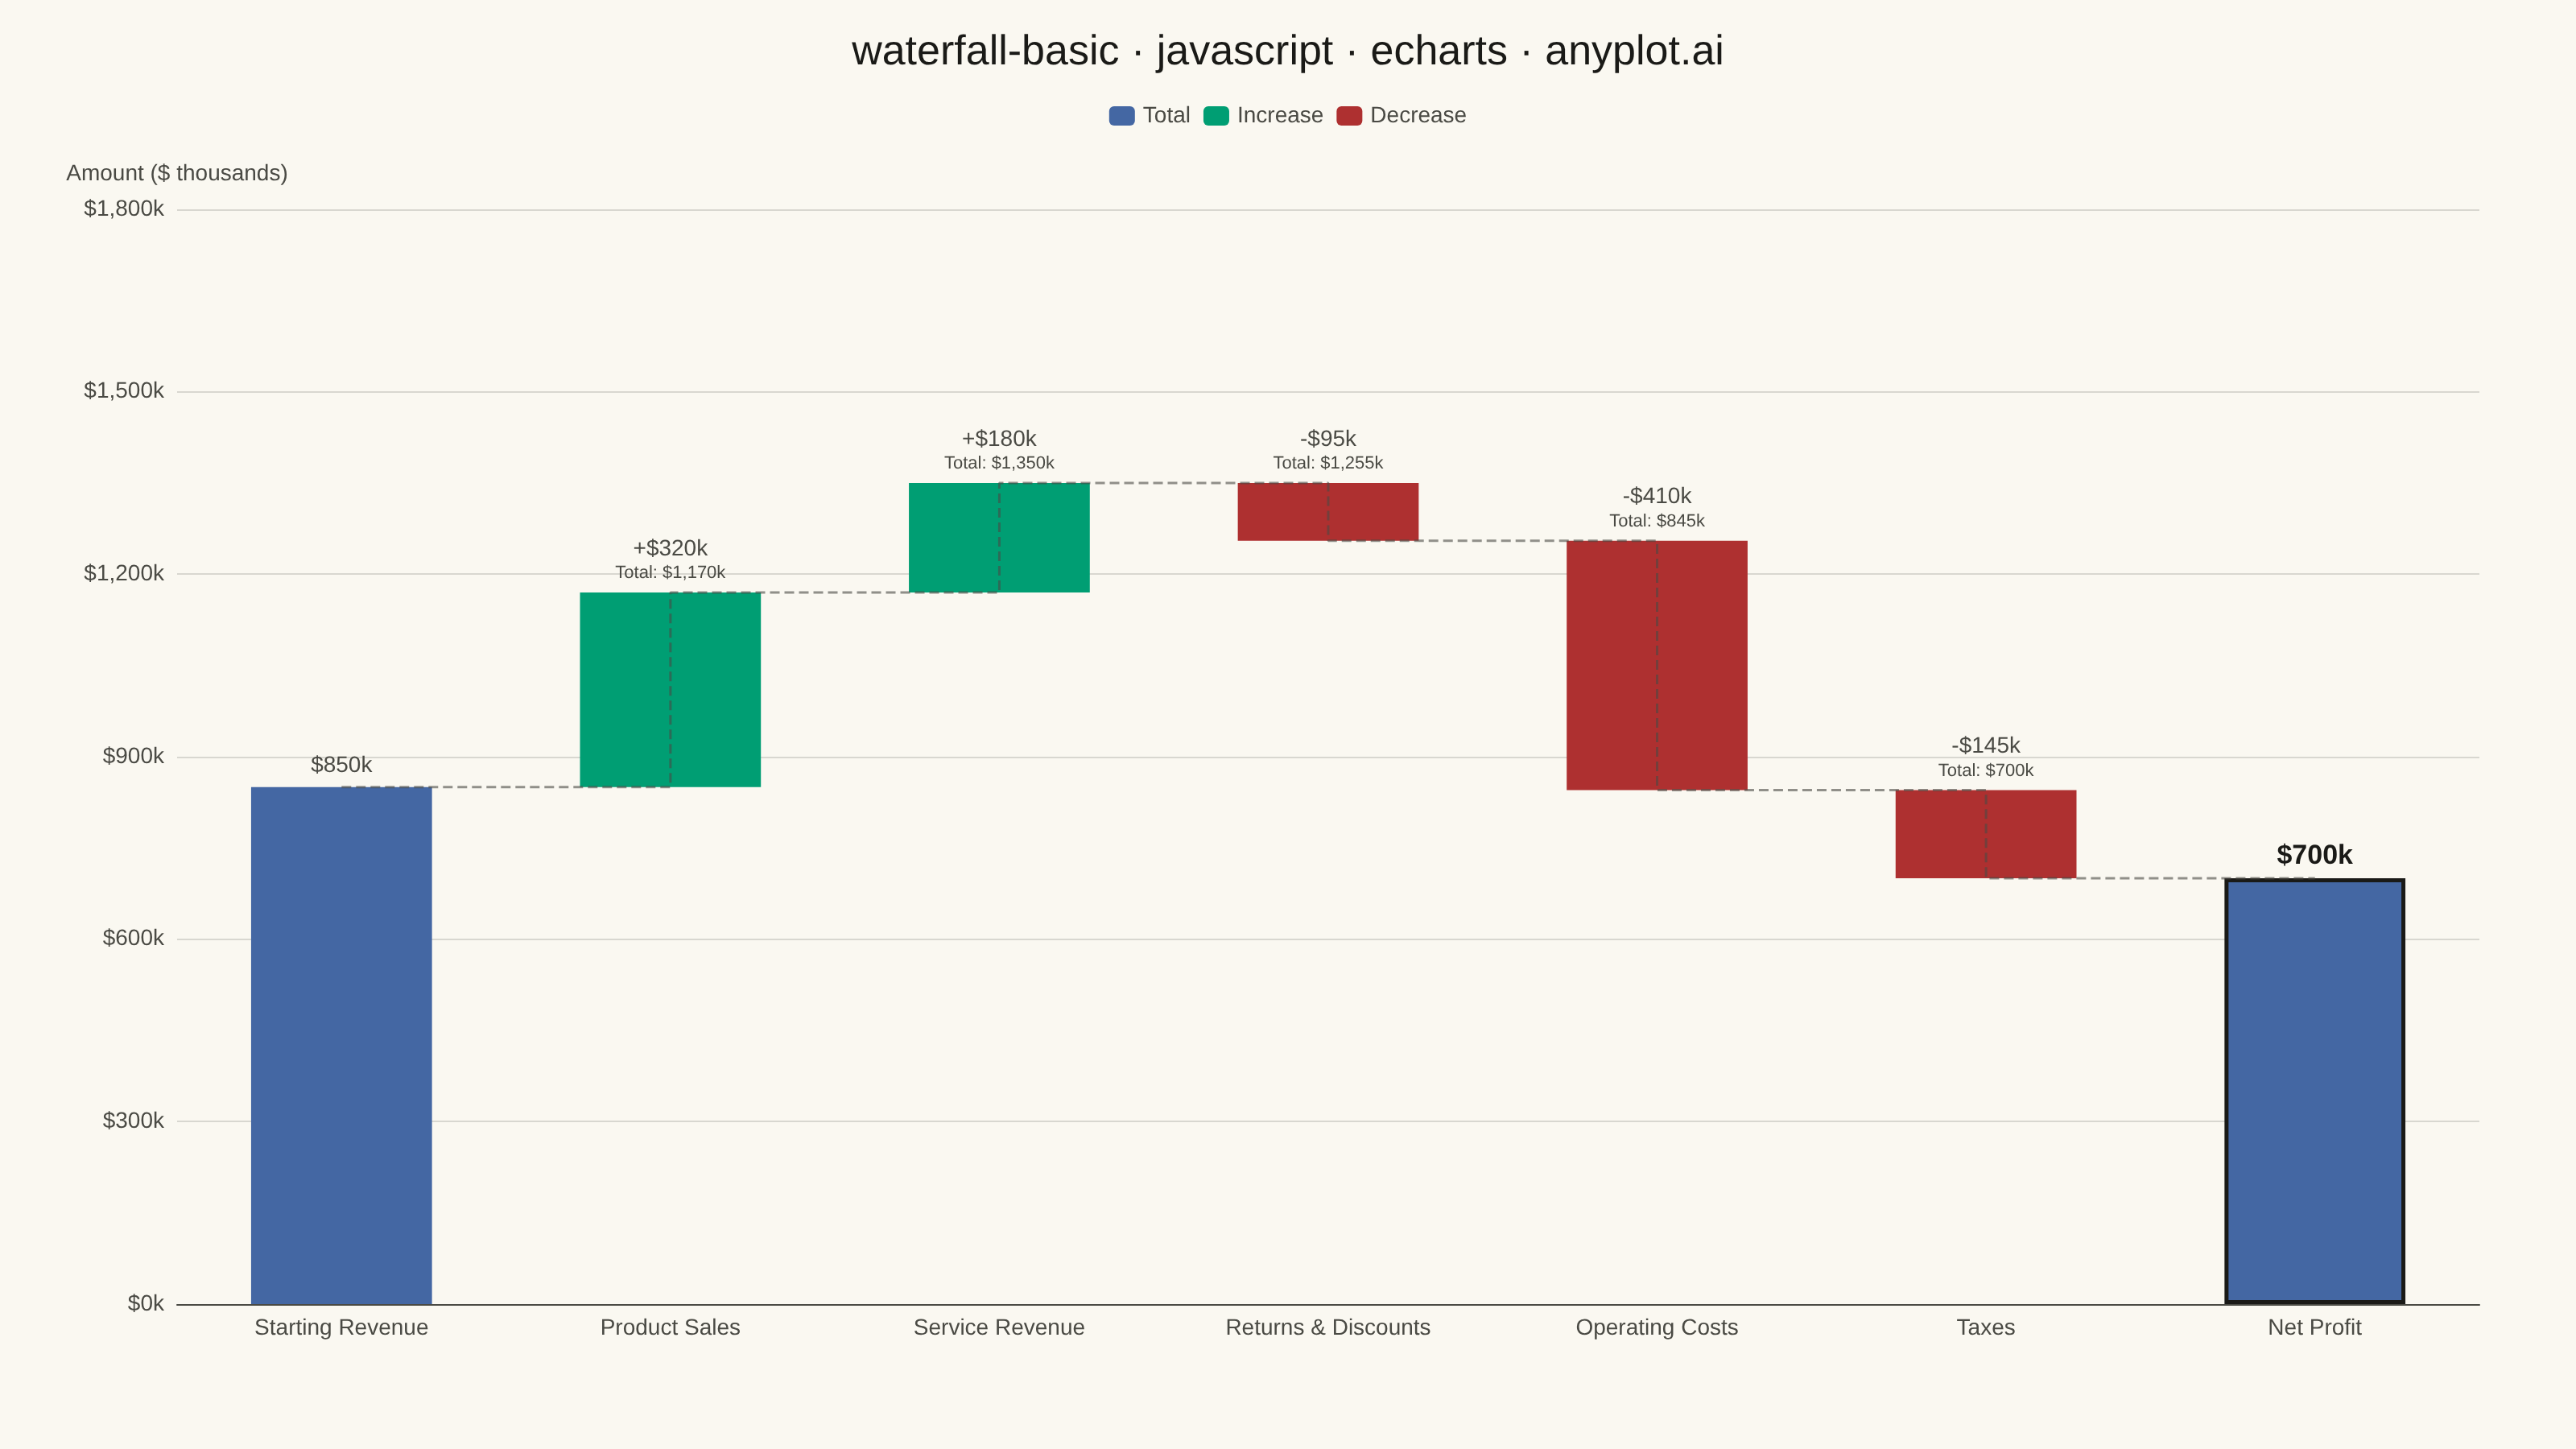
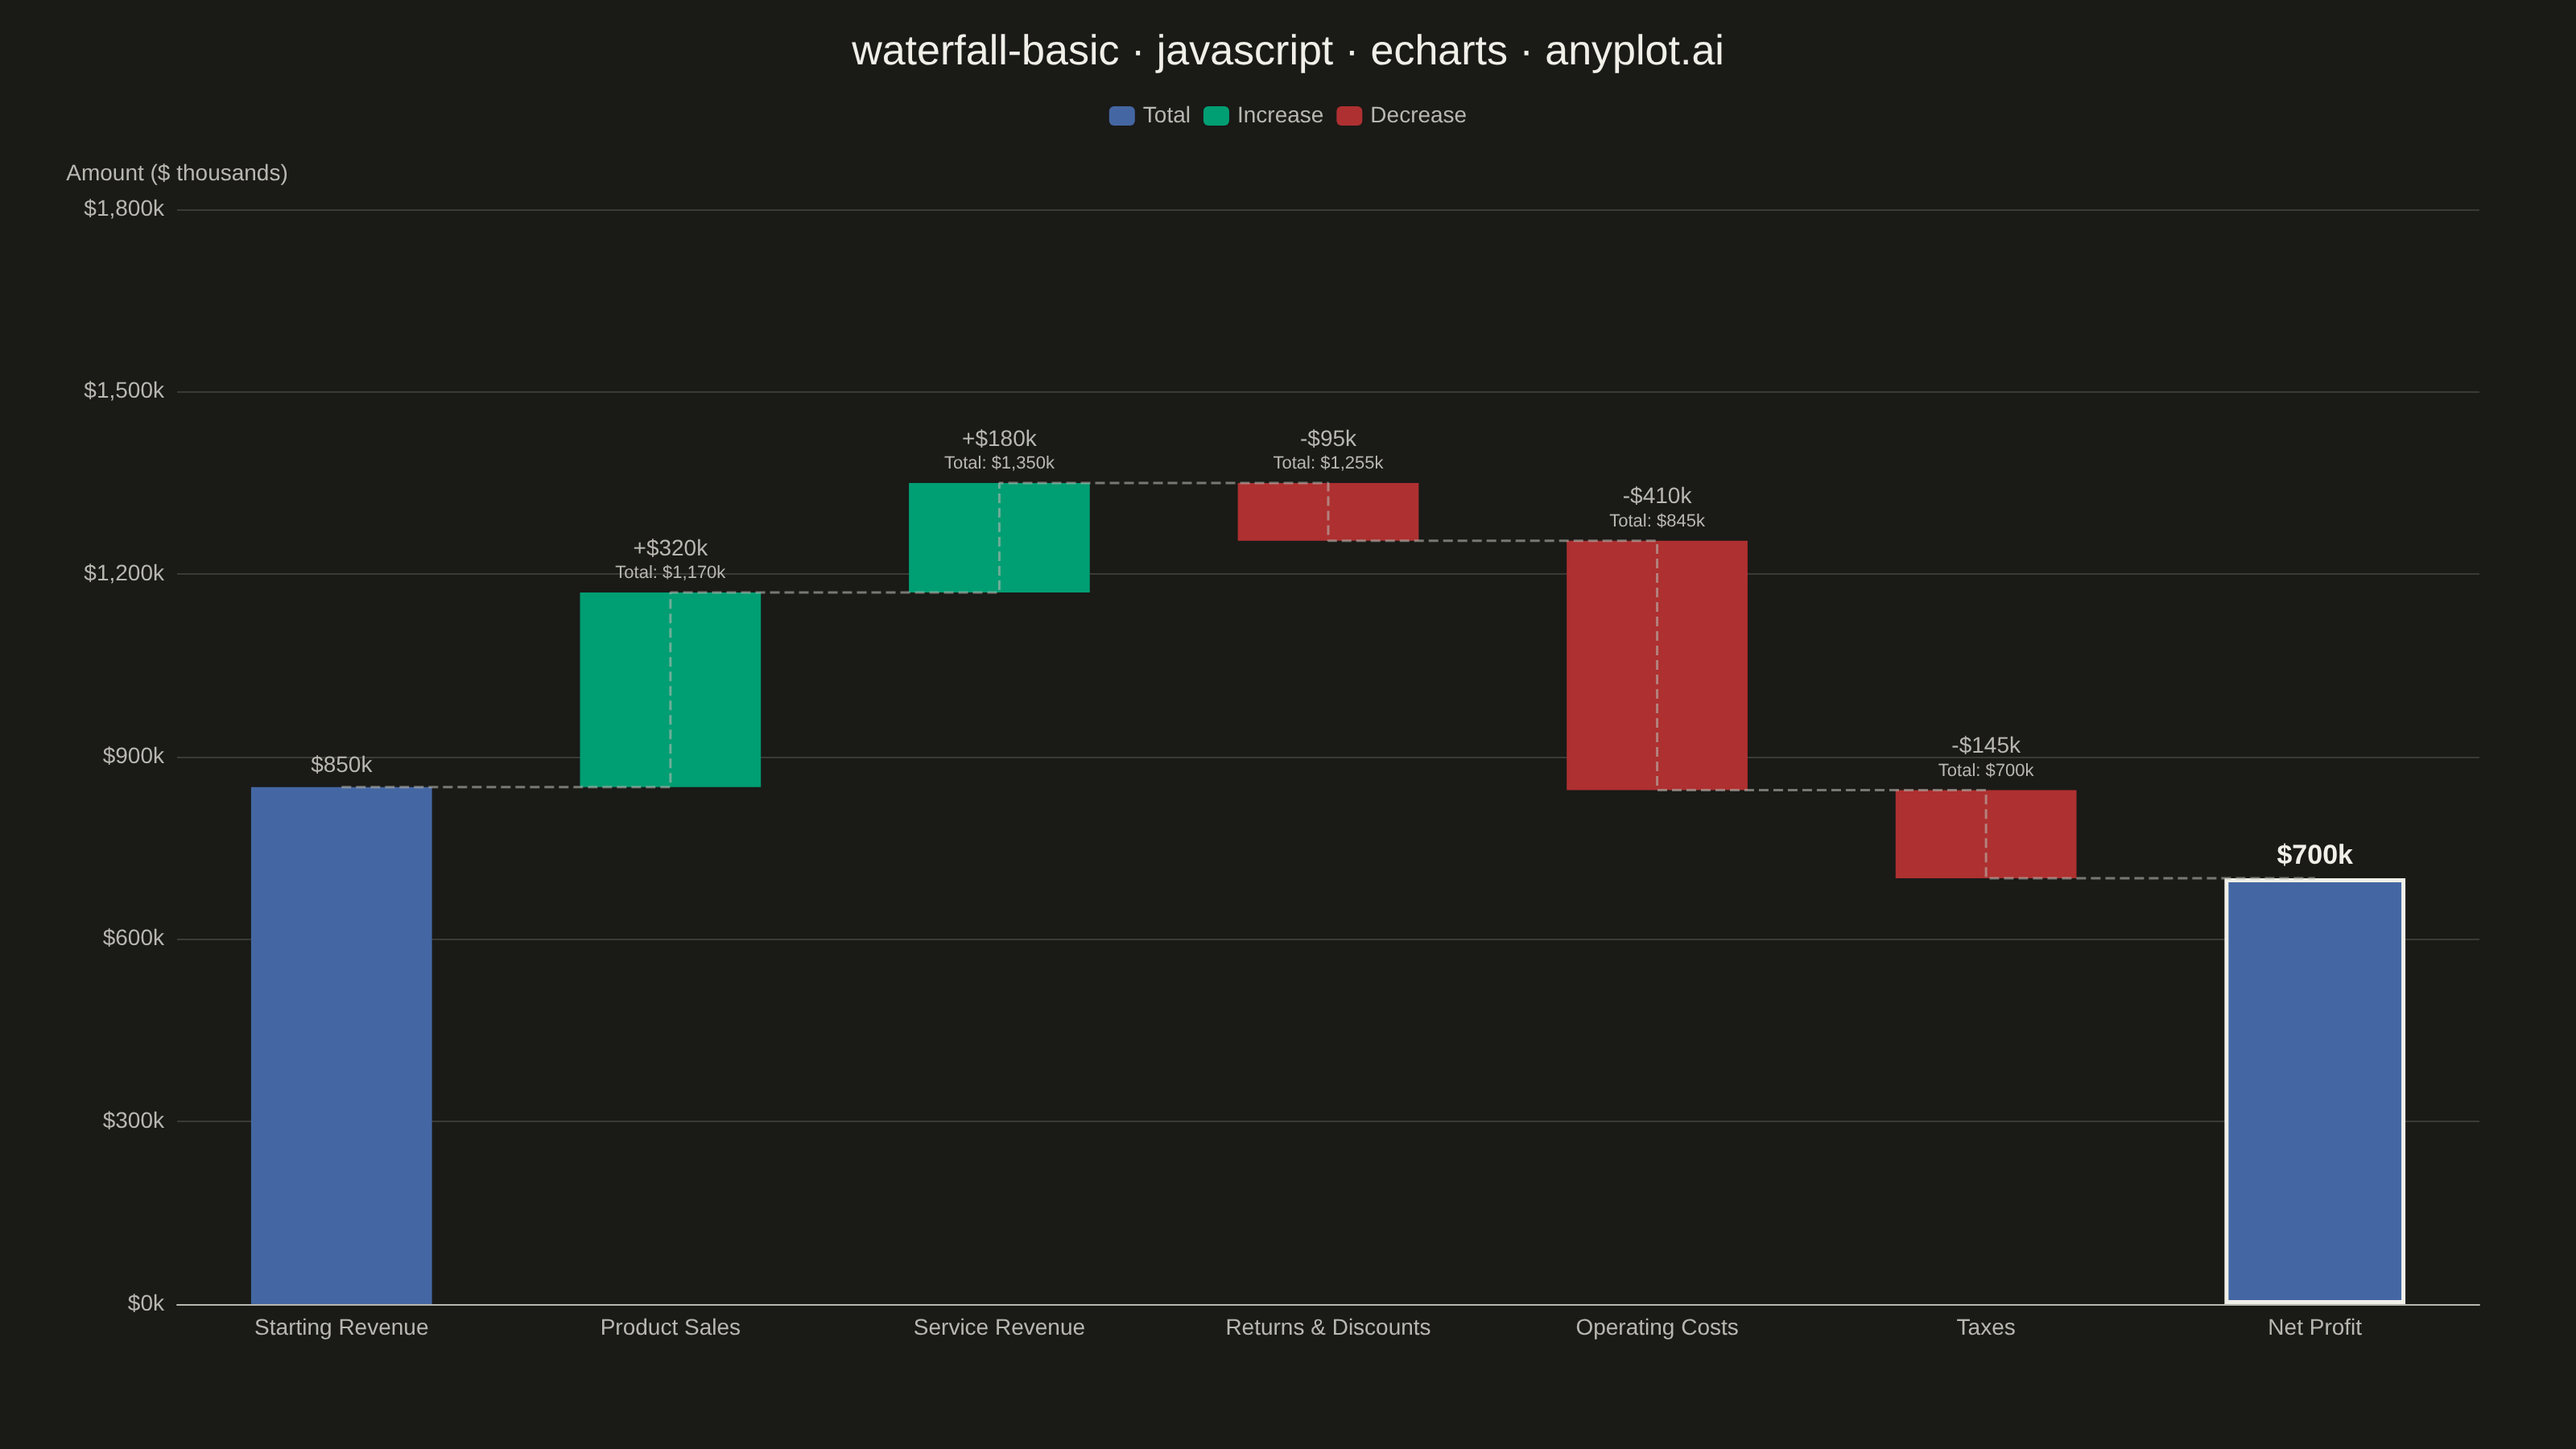
A waterfall chart visualizes how an initial value is affected by a series of intermediate positive or negative values, leading to a final value. Each bar represents a change from the previous cumulative total, with positive values extending upward and negative values extending downward. This chart type is essential for understanding cumulative effects and breaking down the components that contribute to a final result.
// anyplot.ai
// waterfall-basic: Basic Waterfall Chart
// Library: echarts 6.1.0 | JavaScript 22.23.1
// Quality: 89/100 | Created: 2026-08-04

const t = window.ANYPLOT_TOKENS;

// --- Data (in-memory, deterministic) ----------------------------------------
// Quarterly bridge from starting revenue to net profit, in $ thousands.
const categories = [
  "Starting Revenue",
  "Product Sales",
  "Service Revenue",
  "Returns & Discounts",
  "Operating Costs",
  "Taxes",
  "Net Profit",
];
const stepType = ["total", "increase", "increase", "decrease", "decrease", "decrease", "total"];
const rawValues = [850, 320, 180, -95, -410, -145, 700];

const fmt = (n) => n.toLocaleString("en-US");

const base = [];
const totalSeries = [];
const increaseSeries = [];
const decreaseSeries = [];
const connectorTop = [];
const labelText = [];
const runningTotalText = [];

let cumulative = 0;
const lastIndex = categories.length - 1;
for (let i = 0; i < categories.length; i++) {
  const kind = stepType[i];
  const value = rawValues[i];

  totalSeries.push(0);
  increaseSeries.push(0);
  decreaseSeries.push(0);

  if (kind === "total") {
    base.push(0);
    cumulative = value;
    labelText.push(`$${fmt(value)}k`);
    runningTotalText.push("");
    // Emphasize the ending Net Profit total: dark outline + bold, larger label.
    totalSeries[i] =
      i === lastIndex
        ? {
            value,
            itemStyle: { color: t.palette[2], borderColor: t.ink, borderWidth: 2.5 },
            label: {
              formatter: () => `$${fmt(value)}k`,
              fontWeight: 700,
              fontSize: 17,
              color: t.ink,
            },
          }
        : value;
  } else if (kind === "increase") {
    base.push(cumulative);
    increaseSeries[i] = value;
    cumulative += value;
    labelText.push(`+$${fmt(value)}k`);
    runningTotalText.push(`Total: $${fmt(cumulative)}k`);
  } else {
    cumulative += value;
    base.push(cumulative);
    decreaseSeries[i] = -value;
    labelText.push(`-$${fmt(Math.abs(value))}k`);
    runningTotalText.push(`Total: $${fmt(cumulative)}k`);
  }
  connectorTop.push(cumulative);
}

const maxTop = Math.max(...connectorTop, ...totalSeries.map((v) => (typeof v === "object" ? v.value : v)));
const yAxisMax = Math.ceil((maxTop * 1.3) / 100) * 100;

// --- Init --------------------------------------------------------------------
const chart = echarts.init(document.getElementById("container"));

// --- Option --------------------------------------------------------------------
const topLabel = {
  show: true,
  position: "top",
  formatter: (params) => {
    if (params.value === 0) return "";
    const idx = params.dataIndex;
    const sub = runningTotalText[idx];
    return sub ? `{main|${labelText[idx]}}\n{sub|${sub}}` : `{main|${labelText[idx]}}`;
  },
  rich: {
    main: { color: t.inkSoft, fontSize: 14, lineHeight: 16 },
    sub: { color: t.inkSoft, fontSize: 11, lineHeight: 14 },
  },
};

chart.setOption({
  animation: false,
  backgroundColor: "transparent",
  title: {
    text: "waterfall-basic · javascript · echarts · anyplot.ai",
    left: "center",
    textStyle: { color: t.ink, fontSize: 26, fontWeight: 500 },
  },
  legend: {
    data: ["Total", "Increase", "Decrease"],
    top: 60,
    textStyle: { color: t.inkSoft, fontSize: 14 },
    itemWidth: 16,
    itemHeight: 12,
  },
  grid: { left: 110, right: 60, top: 130, bottom: 90 },
  xAxis: {
    type: "category",
    data: categories,
    axisLabel: { color: t.inkSoft, fontSize: 14, interval: 0 },
    axisLine: { lineStyle: { color: t.inkSoft } },
    axisTick: { show: false },
    splitLine: { show: false },
  },
  yAxis: {
    type: "value",
    name: "Amount ($ thousands)",
    nameTextStyle: { color: t.inkSoft, fontSize: 14 },
    max: yAxisMax,
    axisLabel: { color: t.inkSoft, fontSize: 14, formatter: "${value}k" },
    axisLine: { show: false },
    axisTick: { show: false },
    splitLine: { lineStyle: { color: t.grid } },
  },
  series: [
    {
      name: "placeholder",
      type: "bar",
      stack: "total",
      silent: true,
      itemStyle: { color: "transparent" },
      data: base,
    },
    {
      name: "Total",
      type: "bar",
      stack: "total",
      barWidth: "55%",
      itemStyle: { color: t.palette[2] },
      label: topLabel,
      data: totalSeries,
    },
    {
      name: "Increase",
      type: "bar",
      stack: "total",
      barWidth: "55%",
      itemStyle: { color: t.palette[0] },
      label: topLabel,
      data: increaseSeries,
    },
    {
      name: "Decrease",
      type: "bar",
      stack: "total",
      barWidth: "55%",
      itemStyle: { color: t.palette[4] },
      label: topLabel,
      data: decreaseSeries,
    },
    {
      name: "connector",
      type: "line",
      step: "end",
      symbol: "none",
      silent: true,
      legendHoverLink: false,
      lineStyle: { color: t.inkSoft, type: "dashed", width: 1.5, opacity: 0.6 },
      data: connectorTop,
    },
  ],
});
Runnable source as JSON, for any HTTP client: https://api.anyplot.ai/specs/waterfall-basic/echarts/code. Any spec id and library id listed in llms-full.txt fit the same URL shape; every URL below is complete and callable.
{
  "spec_id": "waterfall-basic",
  "language": "javascript",
  "library": "echarts",
  "page": "https://anyplot.ai/waterfall-basic/javascript/echarts",
  "hub": "https://anyplot.ai/waterfall-basic",
  "code_json": "https://api.anyplot.ai/specs/waterfall-basic/echarts/code",
  "spec_json": "https://api.anyplot.ai/specs/waterfall-basic",
  "render_light_png": "https://storage.googleapis.com/anyplot-images/plots/waterfall-basic/javascript/echarts/plot-light.png",
  "render_dark_png": "https://storage.googleapis.com/anyplot-images/plots/waterfall-basic/javascript/echarts/plot-dark.png",
  "interactive_light_html": "https://storage.googleapis.com/anyplot-images/plots/waterfall-basic/javascript/echarts/plot-light.html",
  "interactive_dark_html": "https://storage.googleapis.com/anyplot-images/plots/waterfall-basic/javascript/echarts/plot-dark.html",
  "quality_score": 89.0,
  "license": "MIT",
  "guide": "https://anyplot.ai/llms.txt"
}
Part of Basic Waterfall Chart on anyplot.ai.