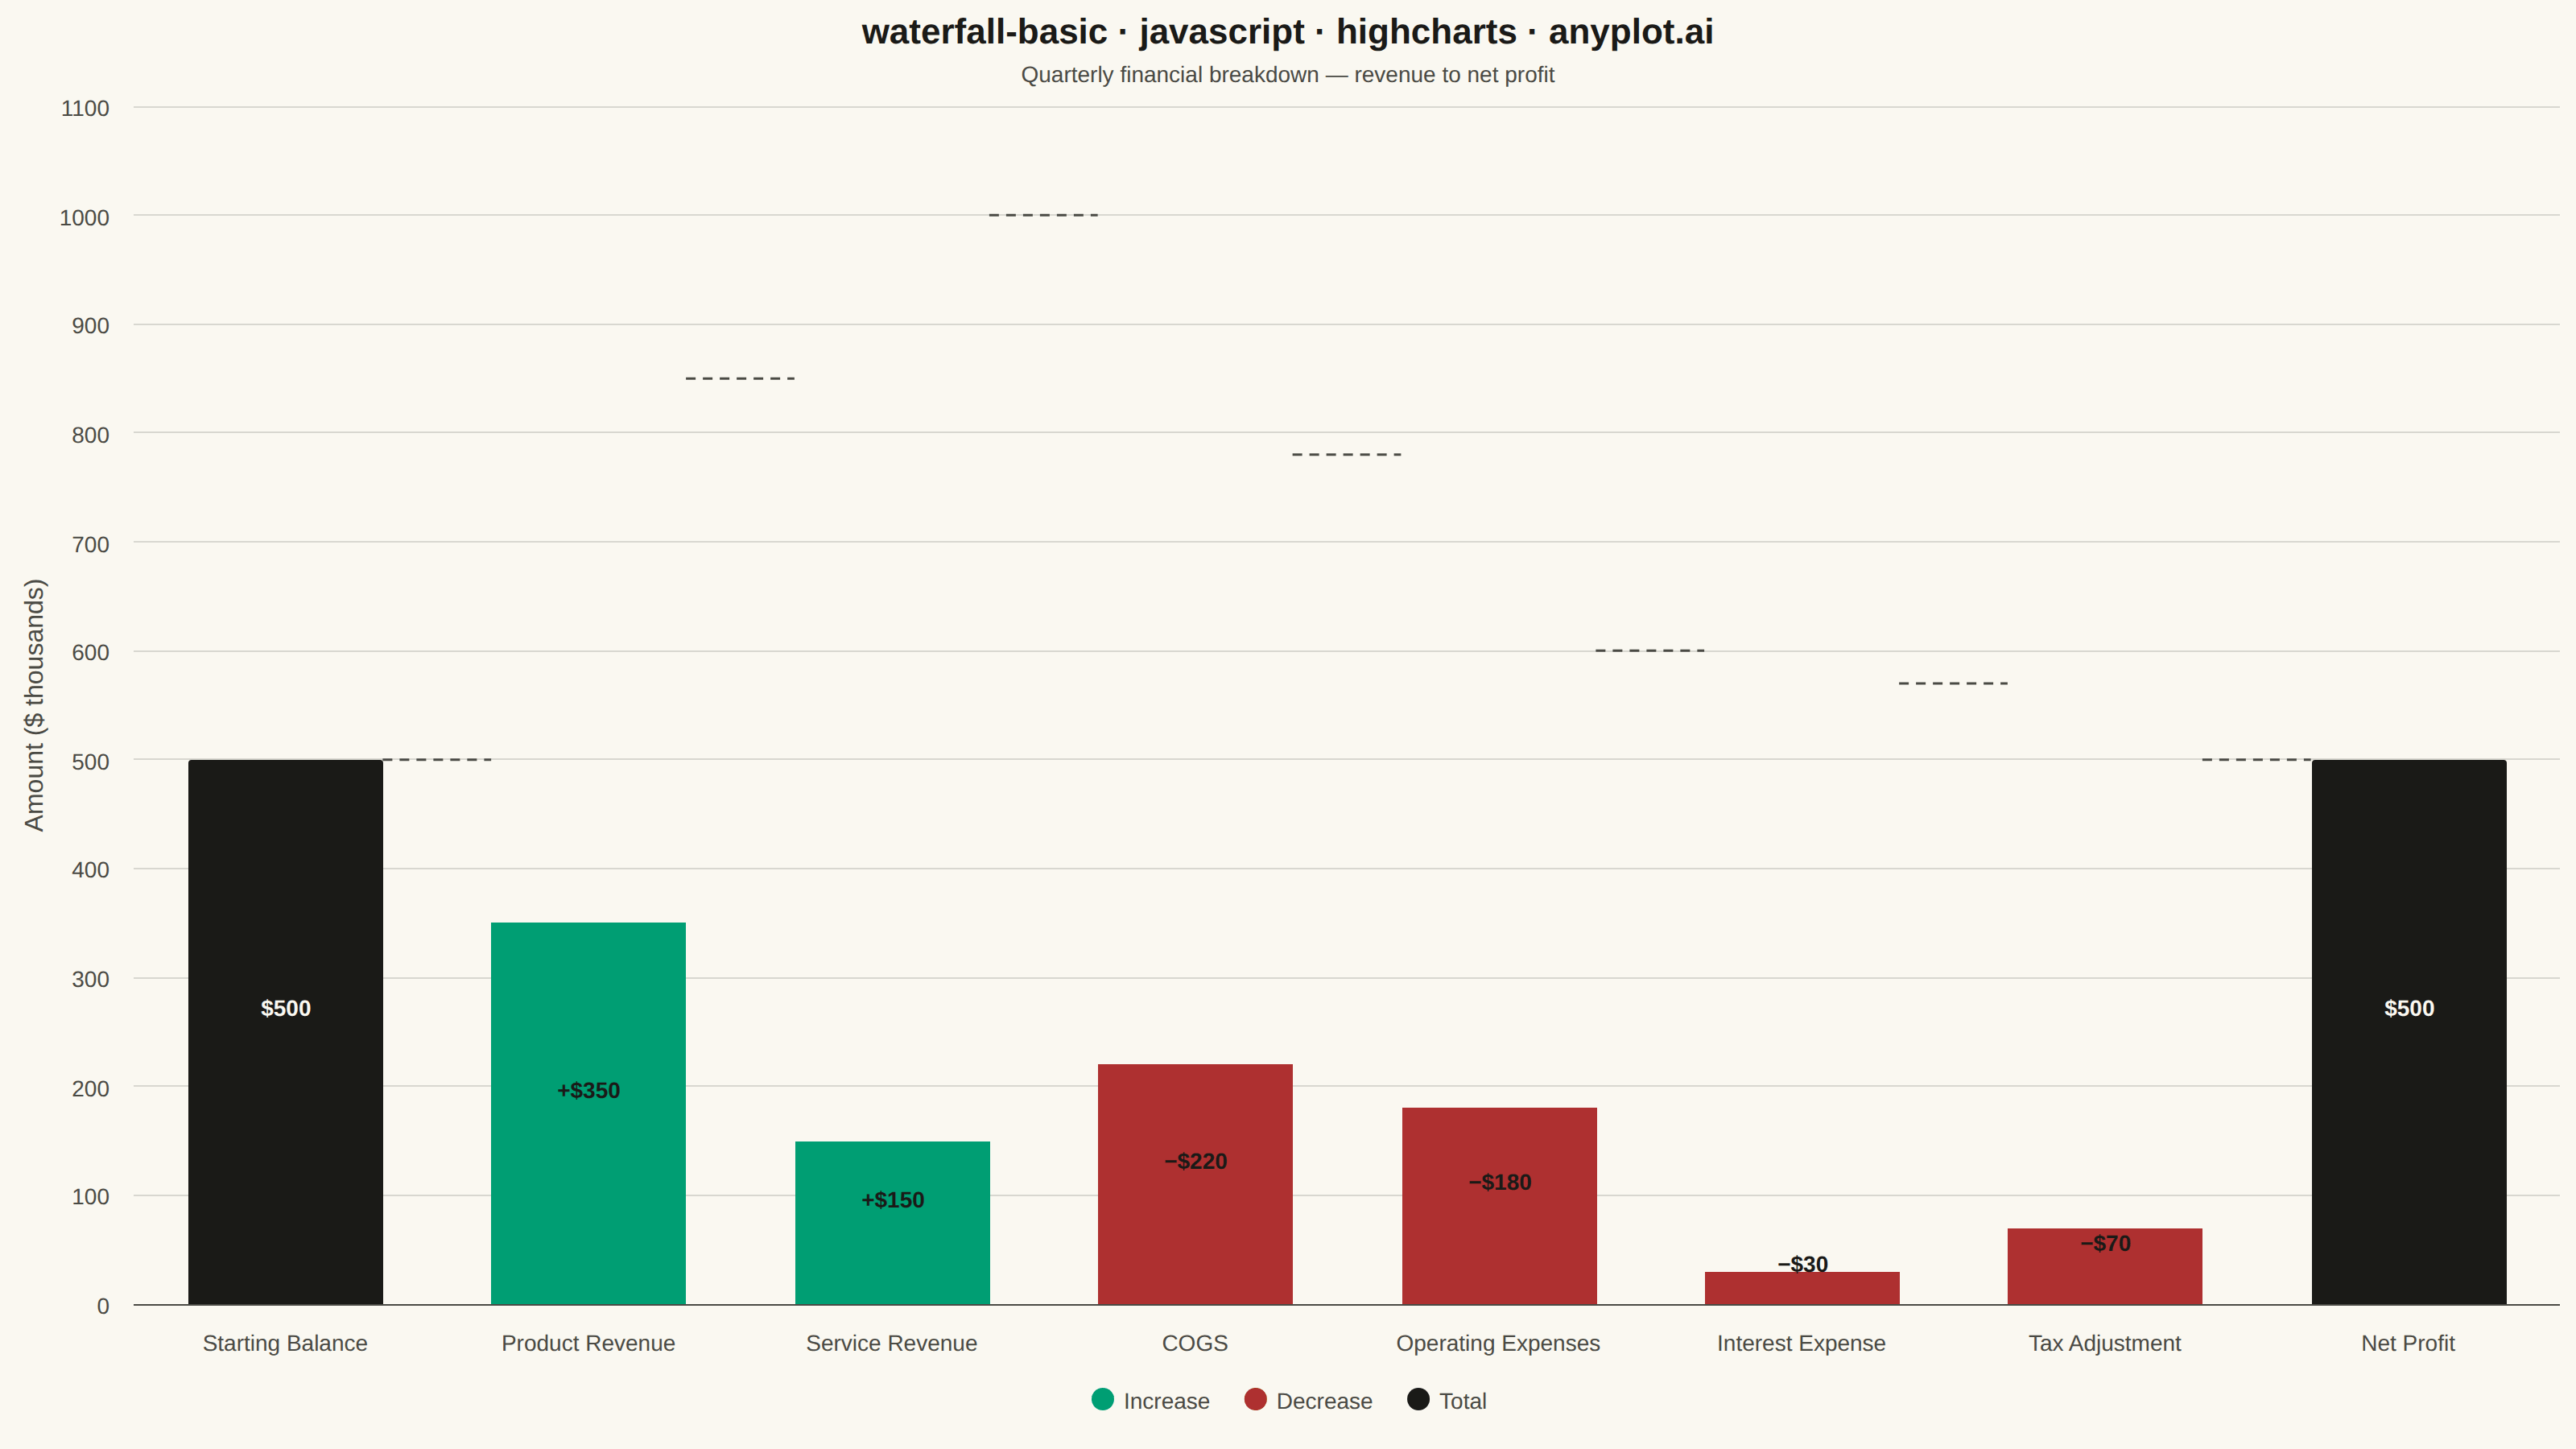
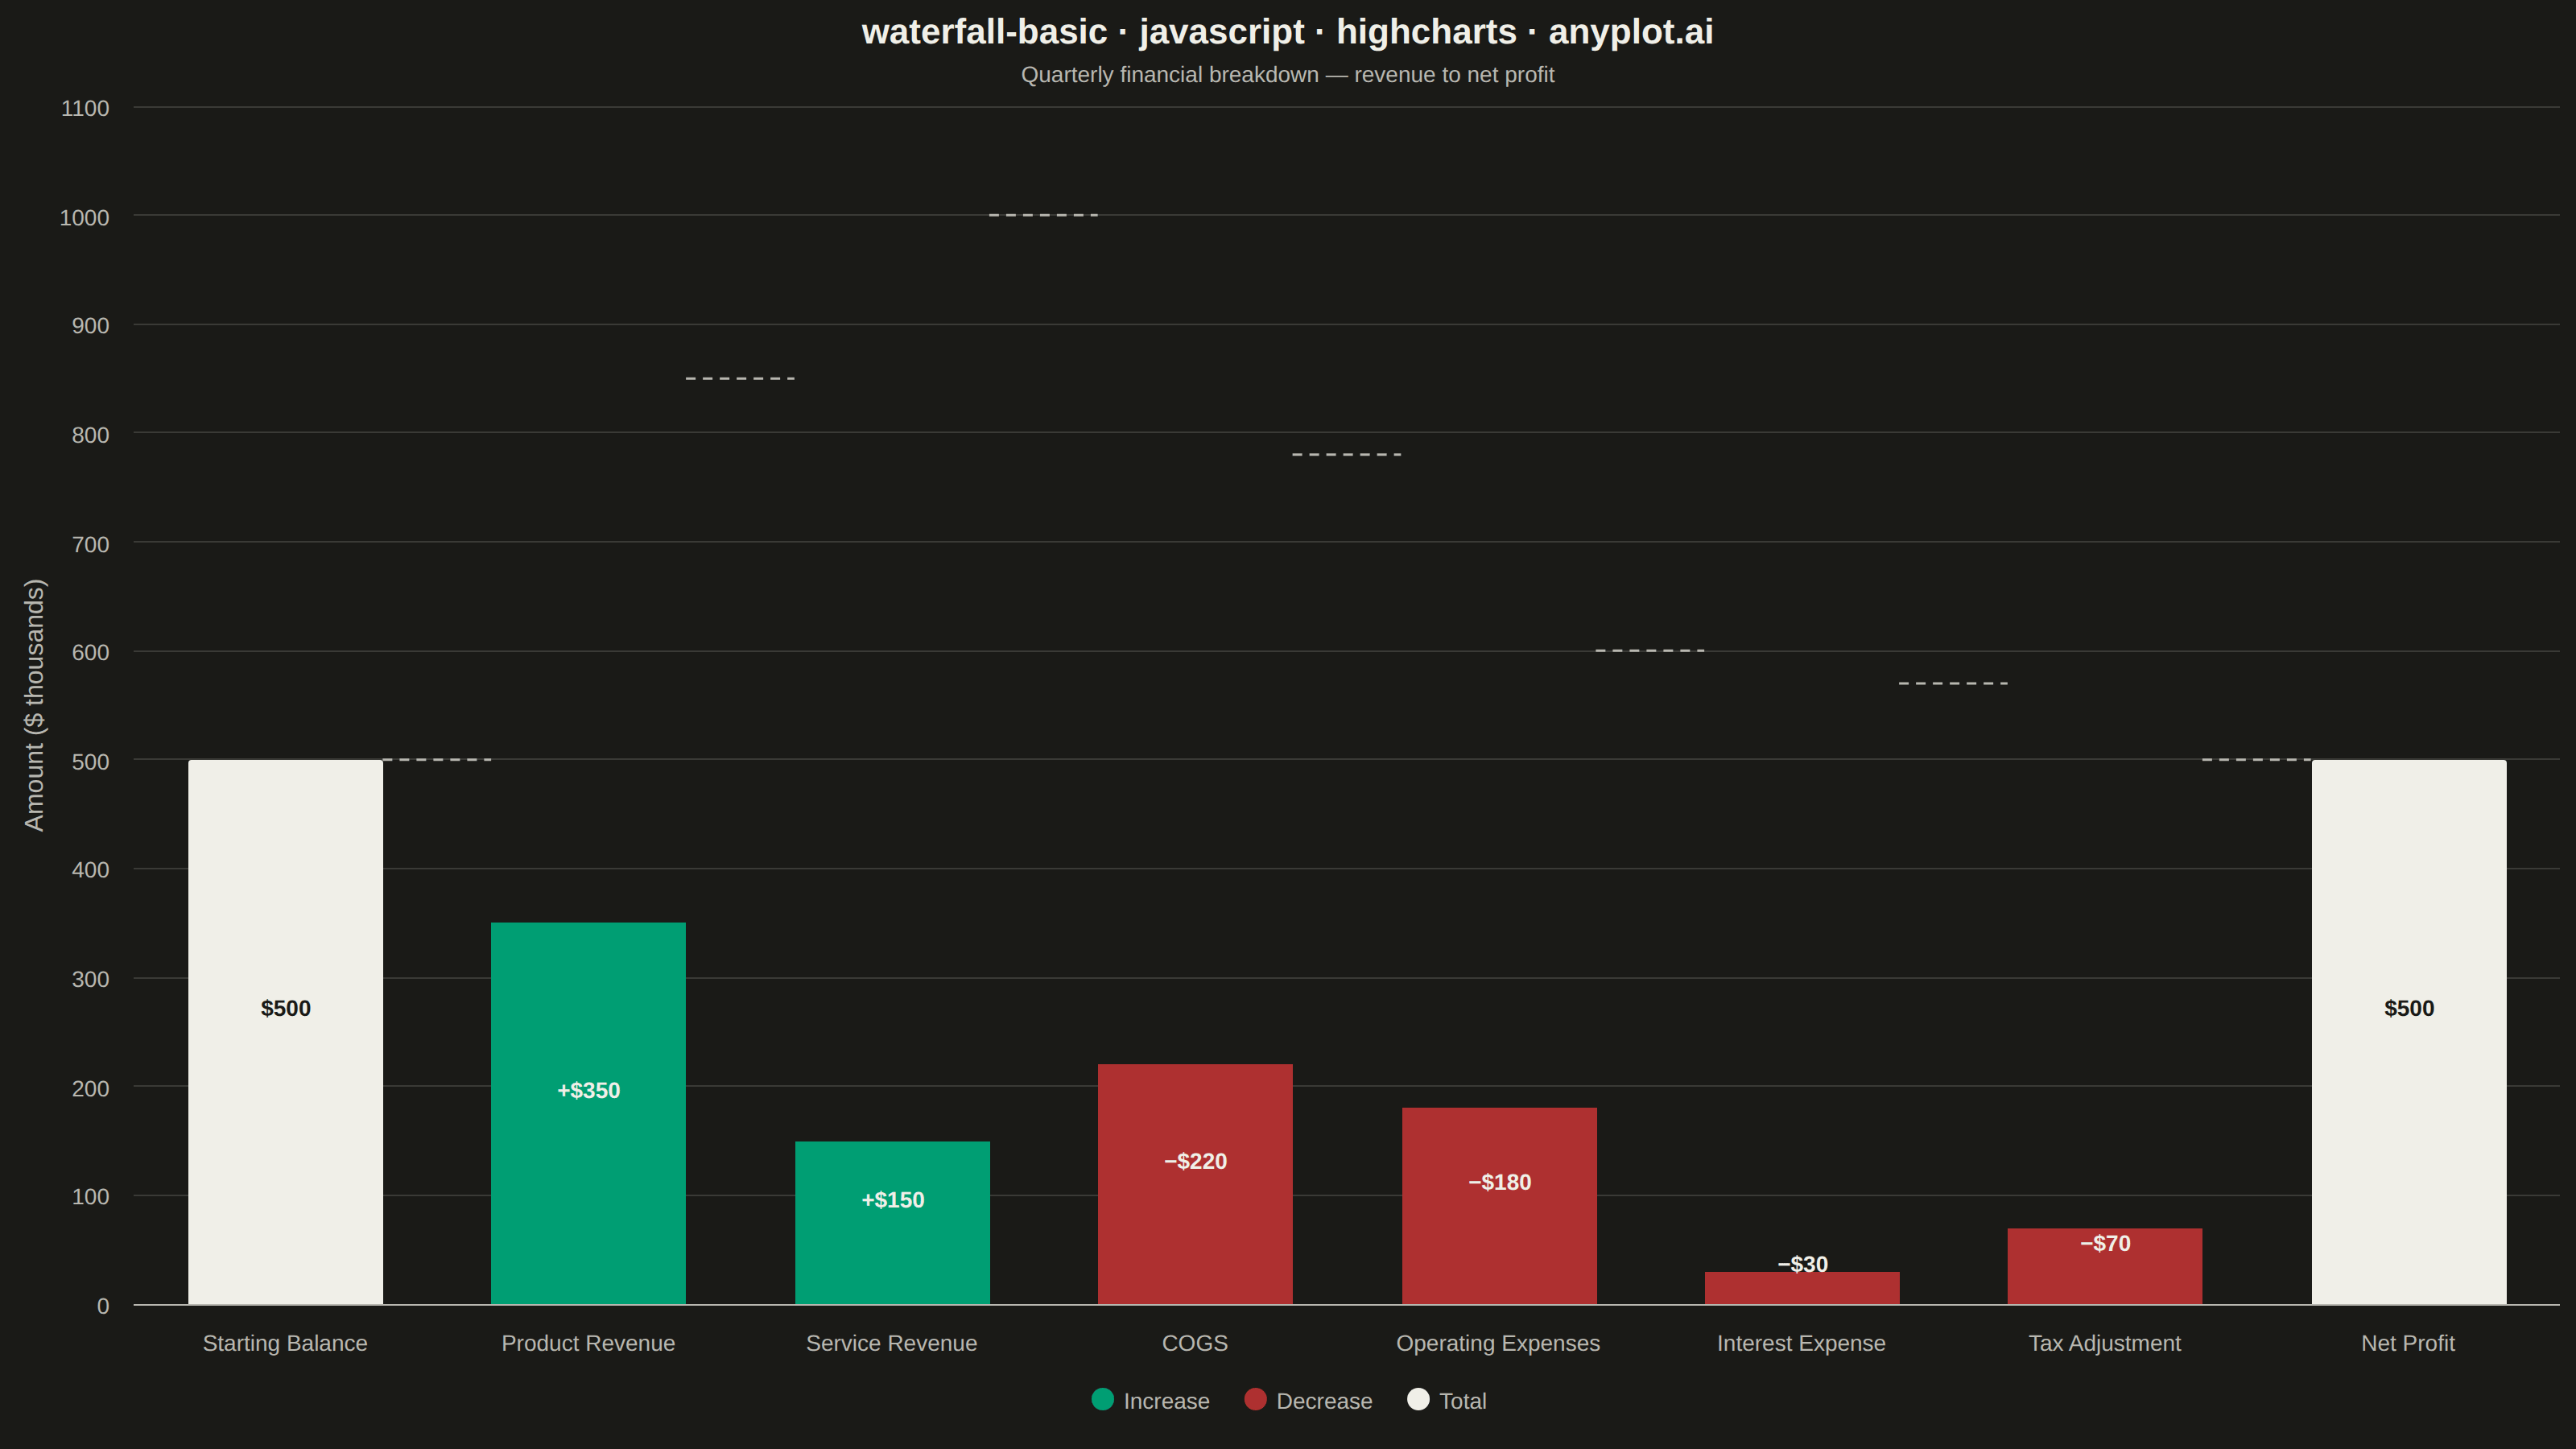
A waterfall chart visualizes how an initial value is affected by a series of intermediate positive or negative values, leading to a final value. Each bar represents a change from the previous cumulative total, with positive values extending upward and negative values extending downward. This chart type is essential for understanding cumulative effects and breaking down the components that contribute to a final result.
// anyplot.ai
// waterfall-basic: Basic Waterfall Chart
// Library: highcharts 12.6.0 | JavaScript 22.23.1
// Quality: 88/100 | Created: 2026-08-04

//# anyplot-orientation: landscape
const t = window.ANYPLOT_TOKENS;

// --- Data (in-memory, deterministic) ----------------------------------------
// Quarterly financial breakdown: revenue streams down to net profit.
// Only the core Highcharts bundle is loaded (no `modules/waterfall.js`), so the
// waterfall is built from stacked `column` series instead of the native
// `type: "waterfall"` series — an invisible "base" series floats each visible
// segment at the right height, and a thin connector line bridges consecutive
// running totals.
const steps = [
  { label: "Starting Balance", type: "total", value: 500 },
  { label: "Product Revenue", type: "increase", value: 350 },
  { label: "Service Revenue", type: "increase", value: 150 },
  { label: "COGS", type: "decrease", value: -220 },
  { label: "Operating Expenses", type: "decrease", value: -180 },
  { label: "Interest Expense", type: "decrease", value: -30 },
  { label: "Tax Adjustment", type: "decrease", value: -70 },
  { label: "Net Profit", type: "total", value: null },
];

const categories = steps.map((s) => s.label);

// Running cumulative total after each step; the final "total" step reads its
// own displayed value off this running sum instead of a hard-coded number.
const cumulative = [];
let running = 0;
steps.forEach((s, i) => {
  if (s.type === "total") {
    if (i === 0) running = s.value;
    else s.value = running;
  } else {
    running += s.value;
  }
  cumulative.push(running);
});

const fmtTotal = (v) => `$${v.toLocaleString()}`;
const fmtChange = (v) =>
  v >= 0 ? `+$${v.toLocaleString()}` : `−$${Math.abs(v).toLocaleString()}`;
// Change label plus the running cumulative total it leaves the waterfall at,
// so intermediate bars communicate both the step delta and the running total.
const fmtChangeWithRunningTotal = (v, cum) => `${fmtChange(v)} → ${fmtTotal(cum)}`;

const baseData = [];
const totalData = [];
const increaseData = [];
const decreaseData = [];

steps.forEach((s, i) => {
  if (s.type === "total") {
    baseData.push(0);
    totalData.push({ y: s.value, custom: { label: fmtTotal(s.value) } });
    increaseData.push(null);
    decreaseData.push(null);
  } else if (s.type === "increase") {
    const prevCum = cumulative[i] - s.value;
    baseData.push(prevCum);
    totalData.push(null);
    increaseData.push({
      y: s.value,
      custom: { label: fmtChangeWithRunningTotal(s.value, cumulative[i]) },
    });
    decreaseData.push(null);
  } else {
    baseData.push(cumulative[i]);
    totalData.push(null);
    increaseData.push(null);
    decreaseData.push({
      y: -s.value,
      custom: { label: fmtChangeWithRunningTotal(s.value, cumulative[i]) },
    });
  }
});

// Height (in axis units) at which the connector between bar i and bar i+1 sits
// — the running total right after bar i, which is also the boundary point the
// two neighbouring columns share.
const connectorLevels = cumulative.slice(0, -1);

function firstShapeArgsAt(chart, index) {
  for (const series of chart.series) {
    const point = series.points[index];
    if (point && point.shapeArgs) return point.shapeArgs;
  }
  return null;
}

// --- Chart -------------------------------------------------------------------
Highcharts.chart("container", {
  chart: {
    type: "column",
    backgroundColor: "transparent",
    animation: false,
    style: { fontFamily: "inherit" },
    events: {
      render: function () {
        const chart = this;
        if (chart.waterfallConnectors) {
          chart.waterfallConnectors.forEach((el) => el.destroy());
        }
        chart.waterfallConnectors = [];
        const shapeArgs = firstShapeArgsAt(chart, 0);
        if (!shapeArgs) return;
        const halfWidth = shapeArgs.width / 2;
        const xAxis = chart.xAxis[0];
        const yAxis = chart.yAxis[0];
        connectorLevels.forEach((level, i) => {
          const x1 = xAxis.toPixels(i) + halfWidth;
          const x2 = xAxis.toPixels(i + 1) - halfWidth;
          const y = yAxis.toPixels(level);
          const path = chart.renderer
            .path(["M", x1, y, "L", x2, y])
            .attr({
              "stroke-width": 1.5,
              stroke: t.inkSoft,
              dashstyle: "Dash",
              zIndex: 5,
            })
            .add();
          chart.waterfallConnectors.push(path);
        });
      },
    },
  },
  credits: { enabled: false },
  title: {
    text: "waterfall-basic · javascript · highcharts · anyplot.ai",
    style: { color: t.ink, fontSize: "22px", fontWeight: "600" },
  },
  subtitle: {
    text: "Quarterly financial breakdown — revenue to net profit",
    style: { color: t.inkSoft, fontSize: "14px" },
  },
  xAxis: {
    categories,
    lineColor: t.inkSoft,
    tickColor: t.inkSoft,
    labels: { style: { color: t.inkSoft, fontSize: "14px" } },
  },
  yAxis: {
    title: {
      text: "Amount ($ thousands)",
      style: { color: t.inkSoft, fontSize: "16px" },
    },
    gridLineColor: t.grid,
    labels: { style: { color: t.inkSoft, fontSize: "14px" } },
  },
  legend: {
    itemStyle: { color: t.inkSoft, fontSize: "14px" },
    itemHoverStyle: { color: t.ink },
  },
  tooltip: {
    formatter: function () {
      return `<b>${this.series.name}</b>: ${this.point.custom.label}`;
    },
  },
  plotOptions: {
    series: { animation: false, stacking: "normal" },
    column: {
      borderWidth: 0,
      borderRadius: 2,
      pointPadding: 0.08,
      groupPadding: 0.12,
      dataLabels: {
        enabled: true,
        y: -16,
        style: {
          color: t.ink,
          fontSize: "14px",
          fontWeight: "600",
          textOutline: "none",
        },
        formatter: function () {
          return this.point.custom ? this.point.custom.label : null;
        },
      },
    },
  },
  series: [
    {
      name: "Base",
      data: baseData,
      color: "transparent",
      enableMouseTracking: false,
      showInLegend: false,
      dataLabels: { enabled: false },
    },
    {
      name: "Increase",
      data: increaseData,
      color: t.palette[0],
    },
    {
      name: "Decrease",
      data: decreaseData,
      color: t.palette[4],
    },
    {
      name: "Total",
      data: totalData,
      color: t.ink,
      dataLabels: { style: { color: t.pageBg } },
    },
  ],
});
Runnable source as JSON, for any HTTP client: https://api.anyplot.ai/specs/waterfall-basic/highcharts/code. Any spec id and library id listed in llms-full.txt fit the same URL shape; every URL below is complete and callable.
{
  "spec_id": "waterfall-basic",
  "language": "javascript",
  "library": "highcharts",
  "page": "https://anyplot.ai/waterfall-basic/javascript/highcharts",
  "hub": "https://anyplot.ai/waterfall-basic",
  "code_json": "https://api.anyplot.ai/specs/waterfall-basic/highcharts/code",
  "spec_json": "https://api.anyplot.ai/specs/waterfall-basic",
  "render_light_png": "https://storage.googleapis.com/anyplot-images/plots/waterfall-basic/javascript/highcharts/plot-light.png",
  "render_dark_png": "https://storage.googleapis.com/anyplot-images/plots/waterfall-basic/javascript/highcharts/plot-dark.png",
  "interactive_light_html": "https://storage.googleapis.com/anyplot-images/plots/waterfall-basic/javascript/highcharts/plot-light.html",
  "interactive_dark_html": "https://storage.googleapis.com/anyplot-images/plots/waterfall-basic/javascript/highcharts/plot-dark.html",
  "quality_score": 88.0,
  "license": "MIT",
  "guide": "https://anyplot.ai/llms.txt"
}
Part of Basic Waterfall Chart on anyplot.ai.