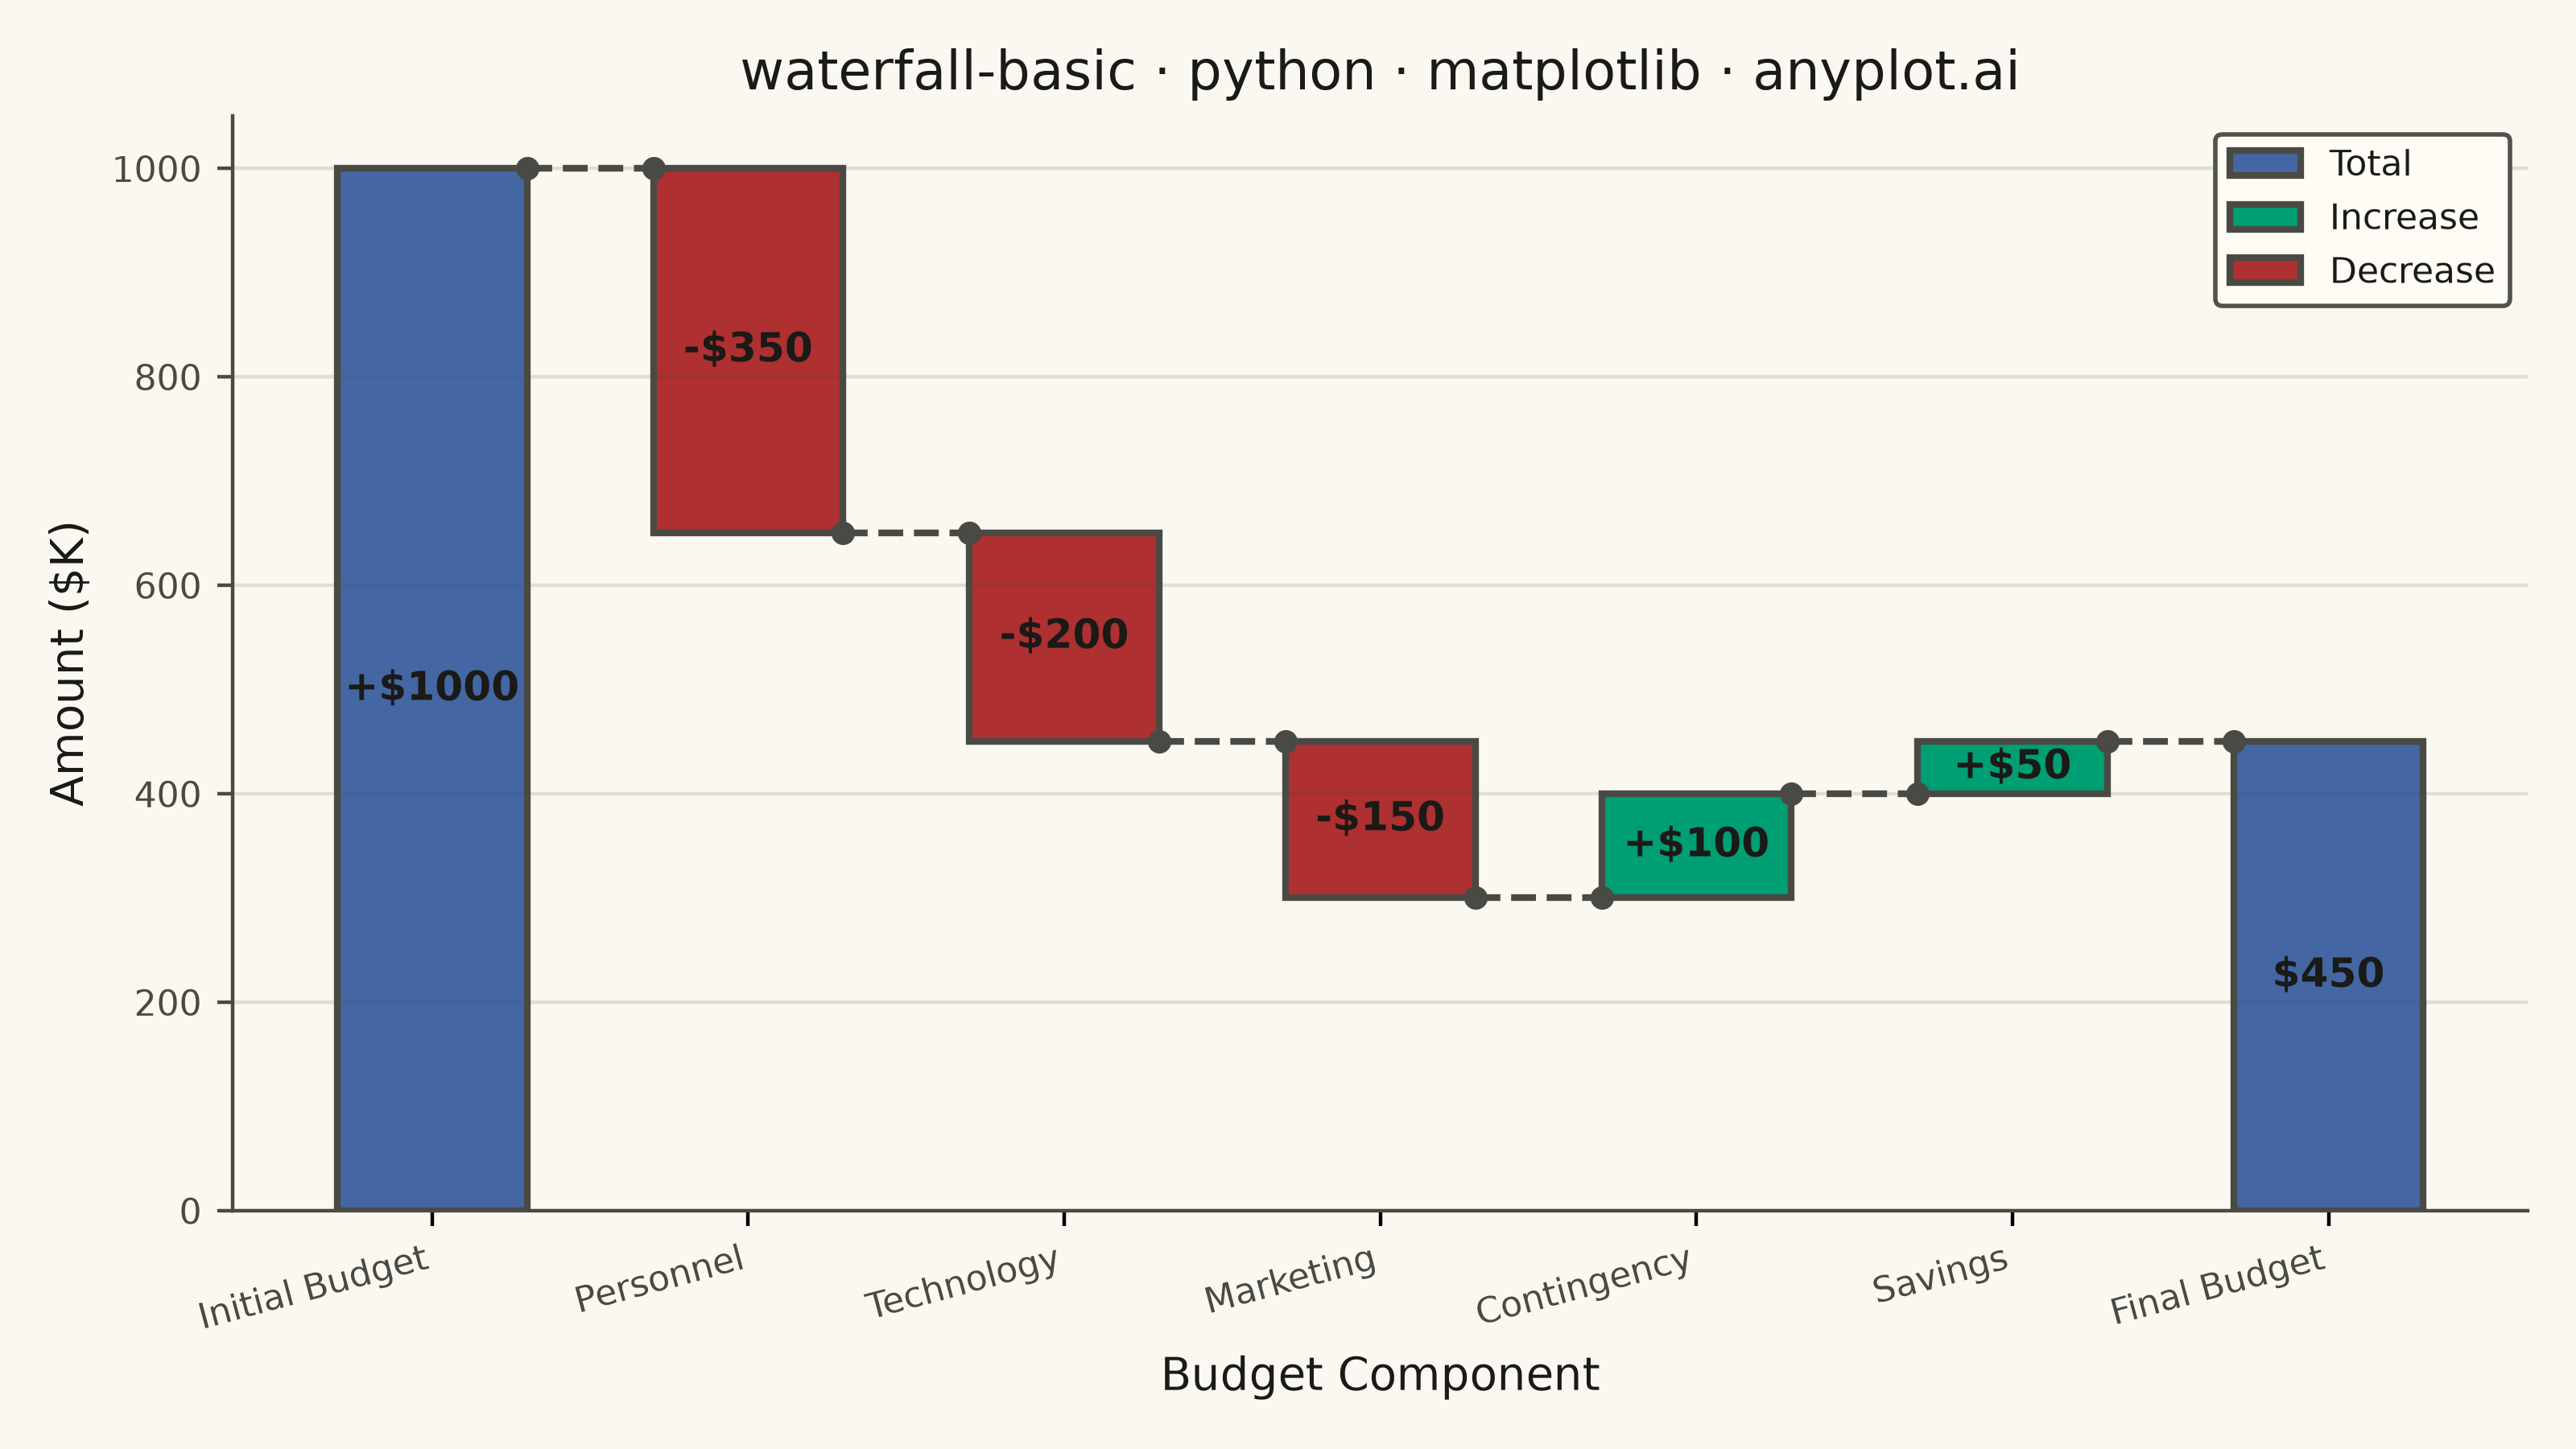
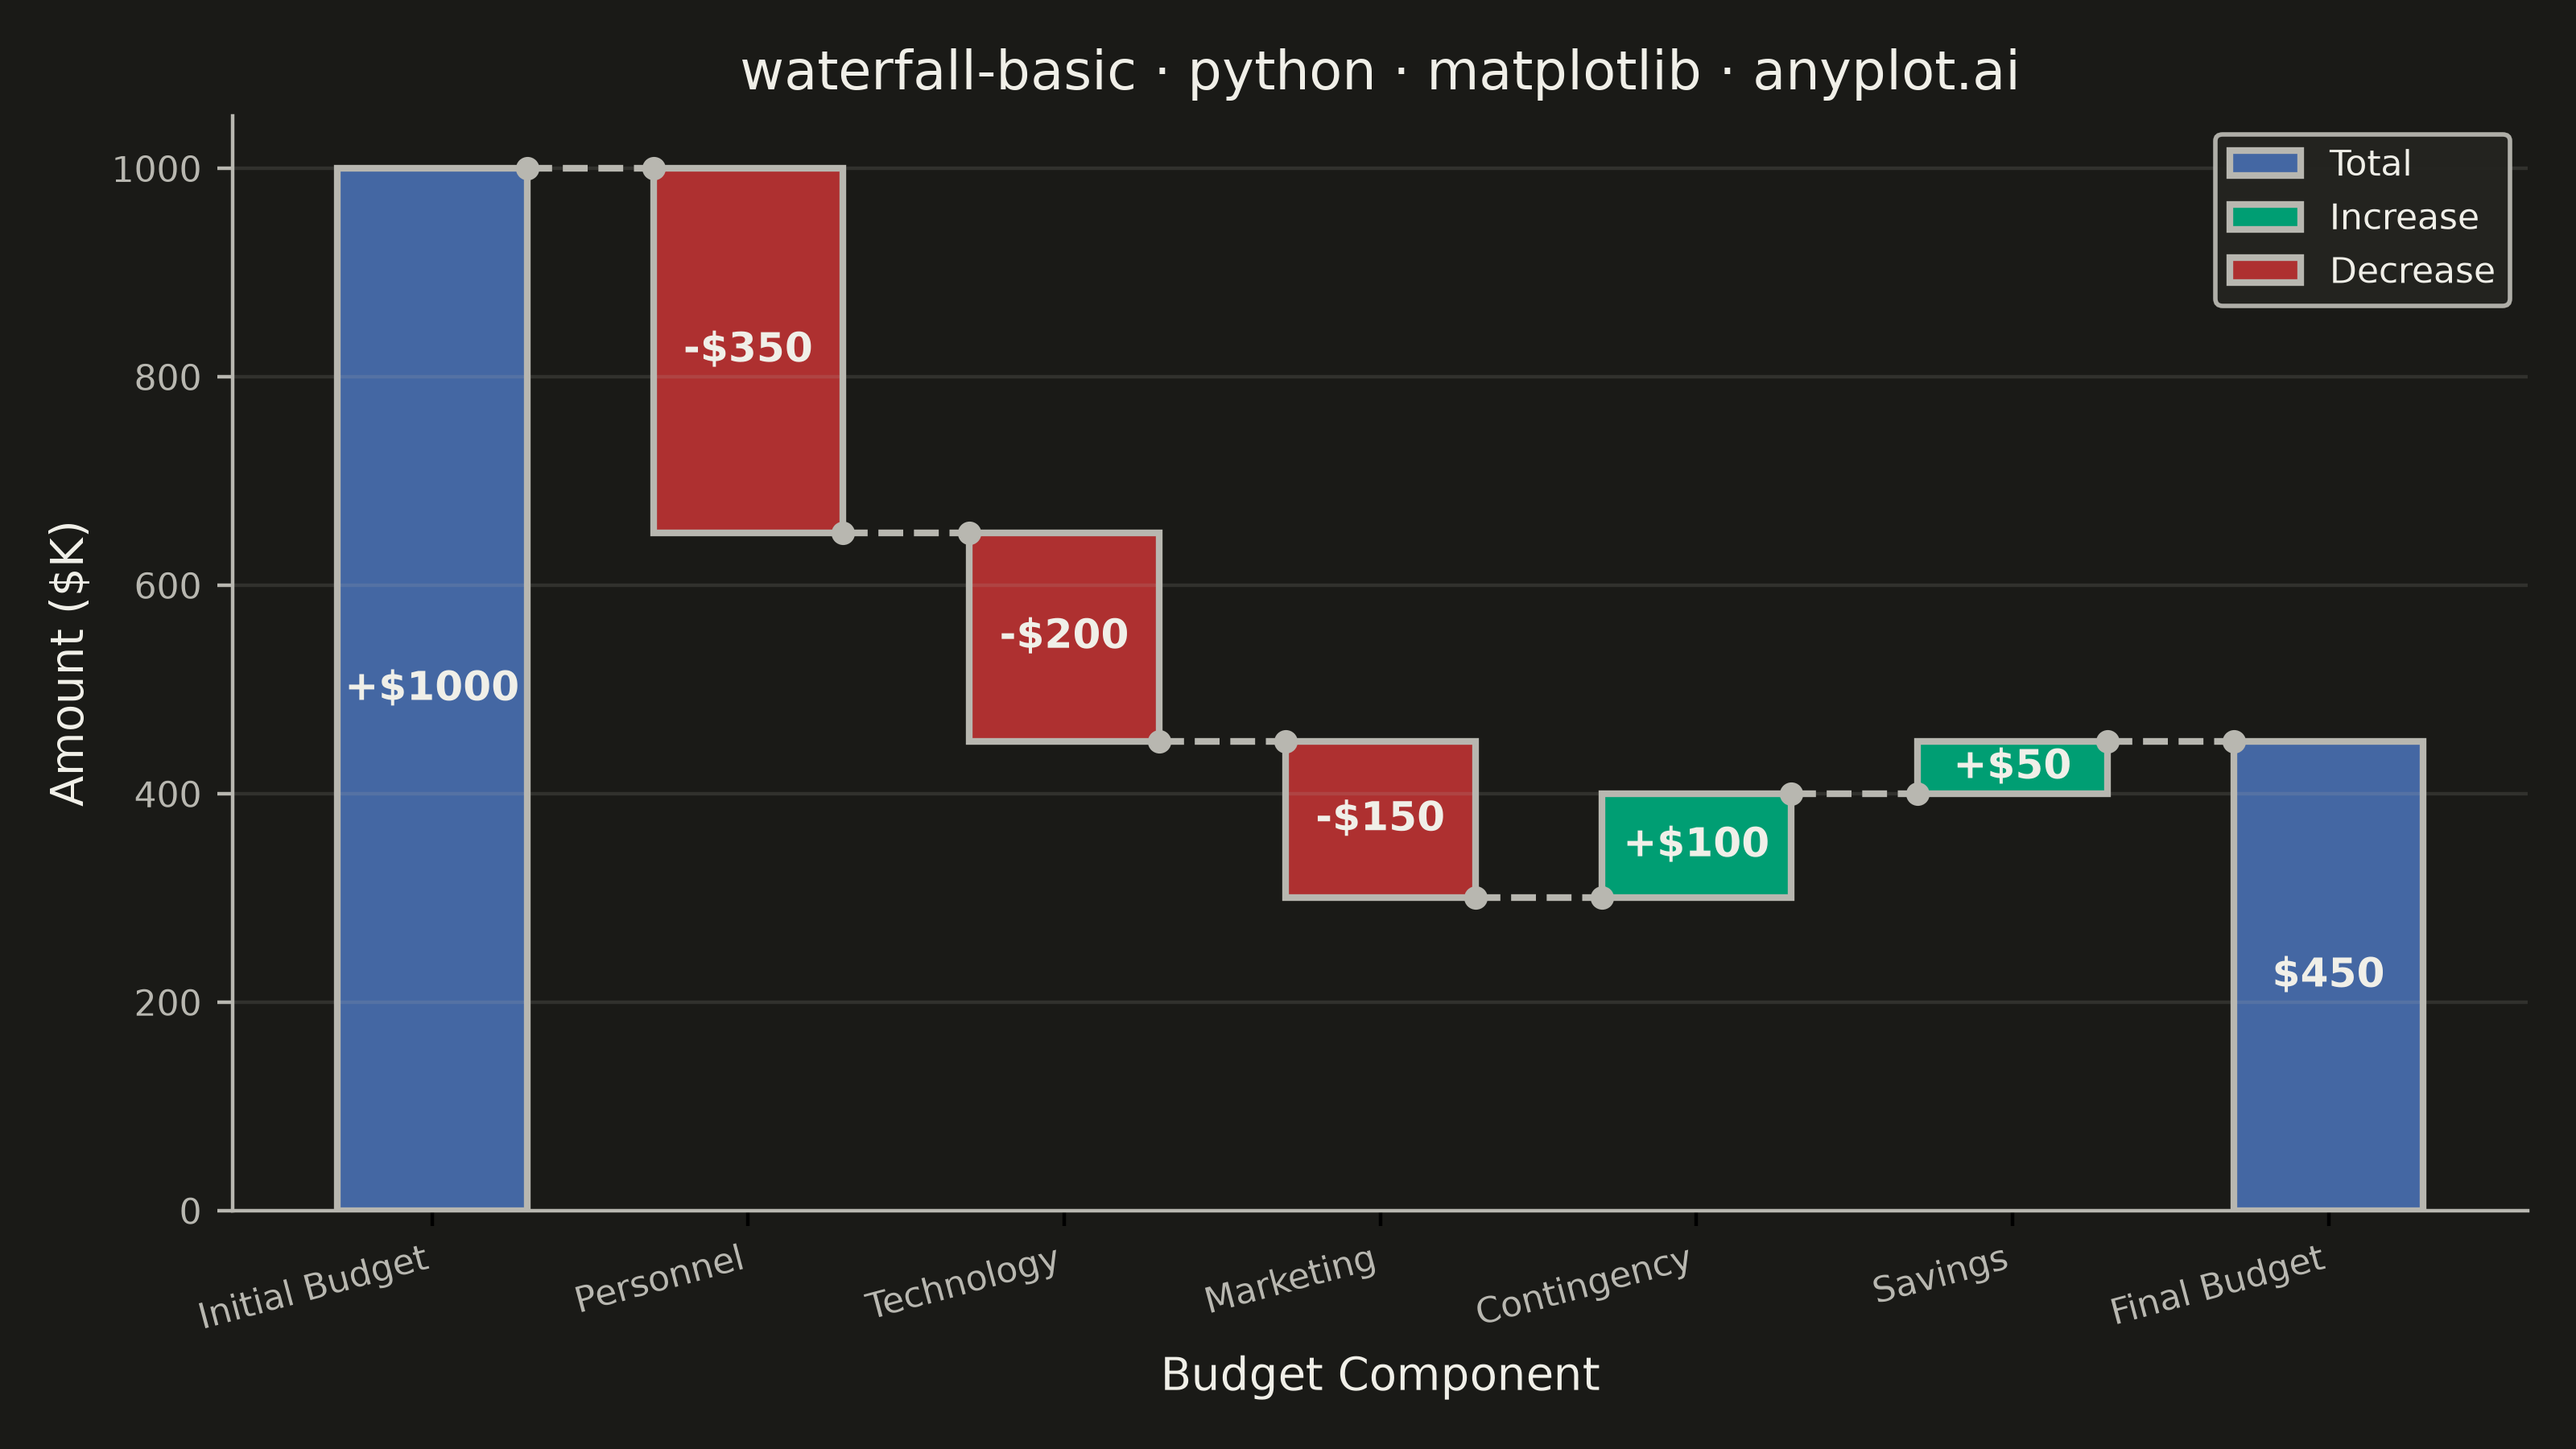
A waterfall chart visualizes how an initial value is affected by a series of intermediate positive or negative values, leading to a final value. Each bar represents a change from the previous cumulative total, with positive values extending upward and negative values extending downward. This chart type is essential for understanding cumulative effects and breaking down the components that contribute to a final result.
""" anyplot.ai
waterfall-basic: Basic Waterfall Chart
Library: matplotlib 3.11.1 | Python 3.13.14
Quality: 90/100 | Updated: 2026-08-04
"""

import os

import matplotlib.pyplot as plt
import numpy as np
from matplotlib.patches import Patch


# Theme tokens
THEME = os.getenv("ANYPLOT_THEME", "light")
PAGE_BG = "#FAF8F1" if THEME == "light" else "#1A1A17"
ELEVATED_BG = "#FFFDF6" if THEME == "light" else "#242420"
INK = "#1A1A17" if THEME == "light" else "#F0EFE8"
INK_SOFT = "#4A4A44" if THEME == "light" else "#B8B7B0"

# Imprint semantic anchors for waterfall categories
INCREASE_COLOR = "#009E73"  # green — increase
DECREASE_COLOR = "#AE3030"  # red — decrease
TOTAL_COLOR = "#4467A3"  # blue — total/baseline

# Data: Project Budget Allocation (from initial budget to final allocation)
# Different scenario from the original (avoiding Altair match)
categories = ["Initial Budget", "Personnel", "Technology", "Marketing", "Contingency", "Savings", "Final Budget"]
# Values: First and last are totals, middle values are changes (None = calculated totals)
values = [1000, -350, -200, -150, 100, 50, None]

# Calculate running totals and determine actual bar values
n = len(categories)
running_total = np.zeros(n)
bar_values = np.zeros(n)
bar_bottom = np.zeros(n)
bar_colors = []

running_total[0] = values[0]
bar_values[0] = values[0]
bar_bottom[0] = 0
bar_colors.append(TOTAL_COLOR)

current = values[0]
for i in range(1, n):
    if values[i] is None:
        # This is a subtotal bar (Final Budget)
        running_total[i] = current
        bar_values[i] = current
        bar_bottom[i] = 0
        bar_colors.append(TOTAL_COLOR)
    else:
        # This is a change bar
        running_total[i] = current + values[i]
        bar_values[i] = values[i]
        if values[i] >= 0:
            bar_bottom[i] = current
            bar_colors.append(INCREASE_COLOR)
        else:
            bar_bottom[i] = current + values[i]
            bar_colors.append(DECREASE_COLOR)
        current = running_total[i]

# Plot
fig, ax = plt.subplots(figsize=(8, 4.5), dpi=400, facecolor=PAGE_BG)
ax.set_facecolor(PAGE_BG)

x = np.arange(n)
bar_width = 0.6

# Draw bars
bars = ax.bar(
    x, np.abs(bar_values), width=bar_width, bottom=bar_bottom, color=bar_colors, edgecolor=INK_SOFT, linewidth=1.5
)

# Draw connecting lines between bars, with join markers to punctuate the running total
for i in range(n - 1):
    ax.plot(
        [x[i] + bar_width / 2, x[i + 1] - bar_width / 2],
        [running_total[i], running_total[i]],
        color=INK_SOFT,
        linestyle="--",
        linewidth=1.5,
        zorder=1,
    )
    ax.scatter(
        [x[i] + bar_width / 2, x[i + 1] - bar_width / 2],
        [running_total[i], running_total[i]],
        s=18,
        color=INK_SOFT,
        zorder=2,
    )

# Value labels, centered inside each bar via the native bar_label API
bar_labels = []
for i in range(n):
    if values[i] is None:
        bar_labels.append(f"${int(bar_values[i])}")
    elif values[i] >= 0:
        bar_labels.append(f"+${int(values[i])}")
    else:
        bar_labels.append(f"-${int(abs(values[i]))}")
ax.bar_label(bars, labels=bar_labels, label_type="center", fontsize=9, fontweight="bold", color=INK)

# Styling
ax.set_xlabel("Budget Component", fontsize=10, color=INK)
ax.set_ylabel("Amount ($K)", fontsize=10, color=INK)
ax.set_title("waterfall-basic · python · matplotlib · anyplot.ai", fontsize=12, fontweight="medium", color=INK)
ax.set_xticks(x)
ax.set_xticklabels(categories, fontsize=8, rotation=15, ha="right", color=INK_SOFT)
ax.tick_params(axis="y", labelsize=8, colors=INK_SOFT)

# Grid
ax.yaxis.grid(True, alpha=0.15, linewidth=0.8, color=INK_SOFT)

# Spines
ax.spines["top"].set_visible(False)
ax.spines["right"].set_visible(False)
for s in ("left", "bottom"):
    ax.spines[s].set_color(INK_SOFT)

# Set y-axis to start from 0
ax.set_ylim(bottom=0)

# Add legend for color meanings
legend_elements = [
    Patch(facecolor=TOTAL_COLOR, edgecolor=INK_SOFT, label="Total", linewidth=1.5),
    Patch(facecolor=INCREASE_COLOR, edgecolor=INK_SOFT, label="Increase", linewidth=1.5),
    Patch(facecolor=DECREASE_COLOR, edgecolor=INK_SOFT, label="Decrease", linewidth=1.5),
]
leg = ax.legend(handles=legend_elements, fontsize=8, loc="upper right", framealpha=0.95)
if leg:
    leg.get_frame().set_facecolor(ELEVATED_BG)
    leg.get_frame().set_edgecolor(INK_SOFT)
    plt.setp(leg.get_texts(), color=INK)

plt.tight_layout()
plt.savefig(f"plot-{THEME}.png", dpi=400, facecolor=PAGE_BG)
Runnable source as JSON, for any HTTP client: https://api.anyplot.ai/specs/waterfall-basic/matplotlib/code. Any spec id and library id listed in llms-full.txt fit the same URL shape; every URL below is complete and callable.
{
  "spec_id": "waterfall-basic",
  "language": "python",
  "library": "matplotlib",
  "page": "https://anyplot.ai/waterfall-basic/python/matplotlib",
  "hub": "https://anyplot.ai/waterfall-basic",
  "code_json": "https://api.anyplot.ai/specs/waterfall-basic/matplotlib/code",
  "spec_json": "https://api.anyplot.ai/specs/waterfall-basic",
  "render_light_png": "https://storage.googleapis.com/anyplot-images/plots/waterfall-basic/python/matplotlib/plot-light.png",
  "render_dark_png": "https://storage.googleapis.com/anyplot-images/plots/waterfall-basic/python/matplotlib/plot-dark.png",
  "quality_score": 90.0,
  "license": "MIT",
  "guide": "https://anyplot.ai/llms.txt"
}
Part of Basic Waterfall Chart on anyplot.ai.