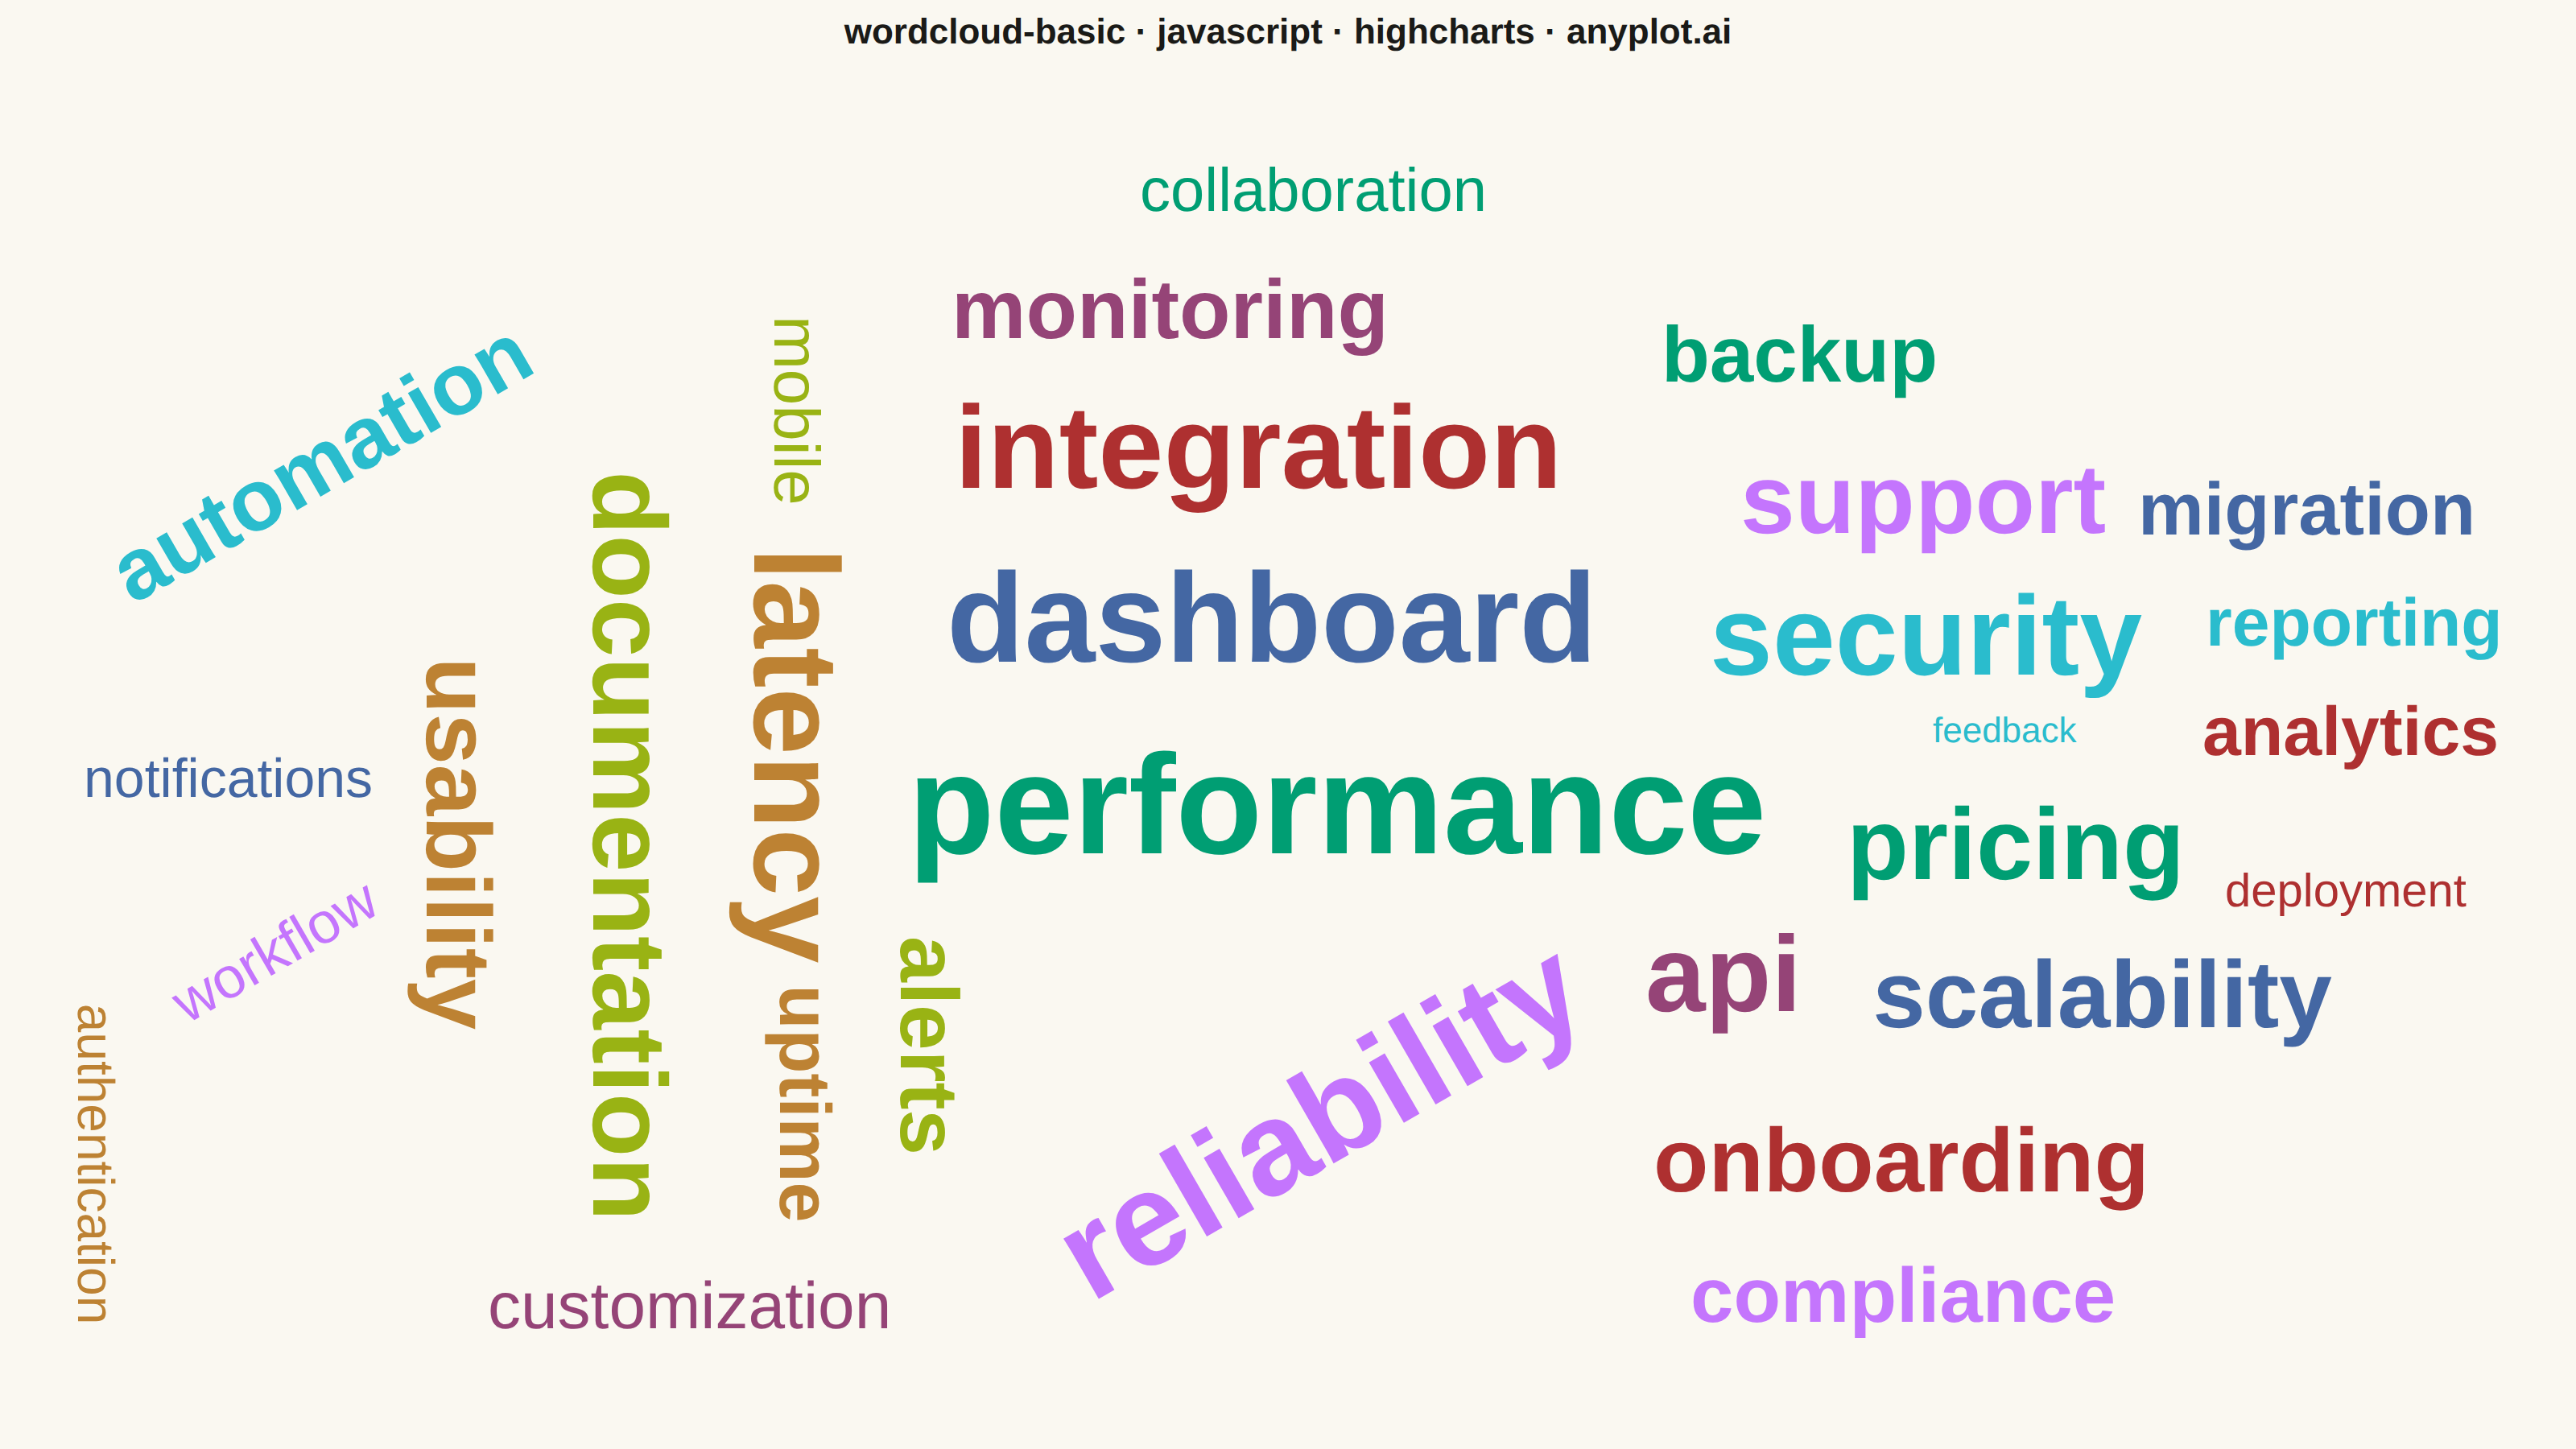
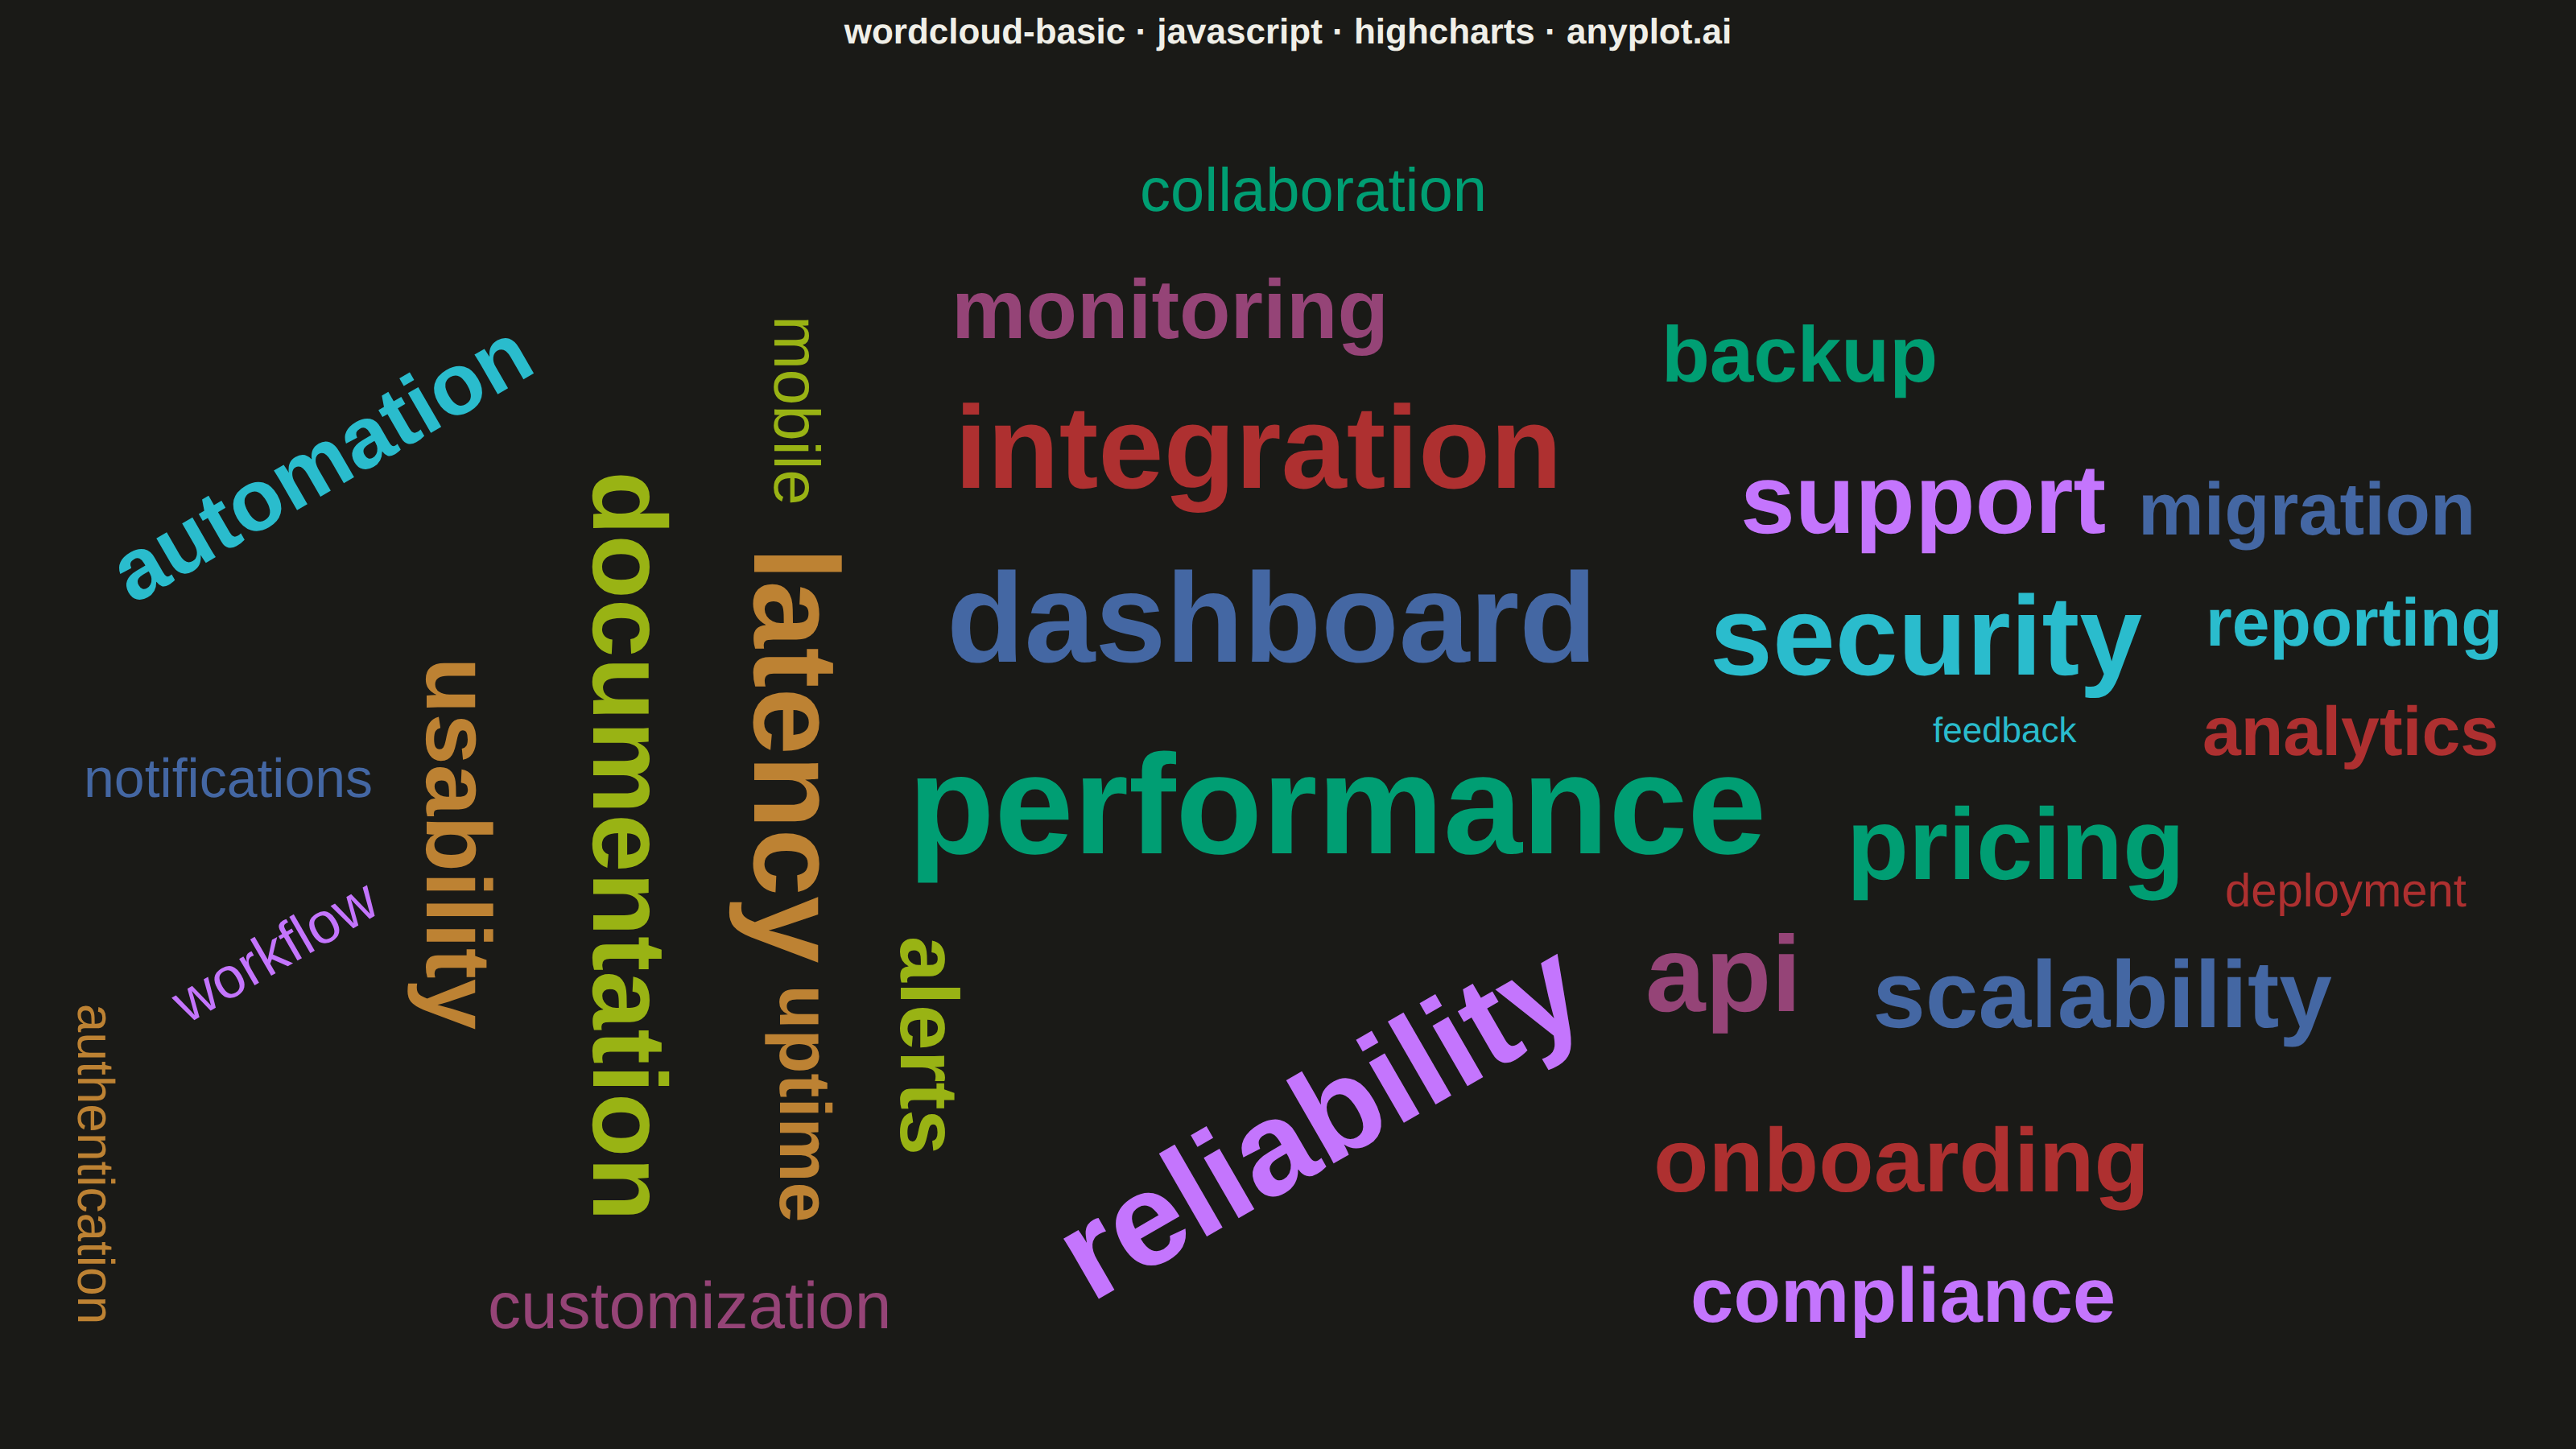
A word cloud displays text data where word size represents frequency or importance. Words are arranged to fill available space, creating a visual summary of text content that highlights prominent terms and patterns. This visualization is ideal for quickly identifying the most common themes or keywords in a body of text.
// anyplot.ai
// wordcloud-basic: Basic Word Cloud
// Library: highcharts 12.6.0 | JavaScript 22.23.1
// Quality: 88/100 | Created: 2026-08-04

// Only the core `highcharts` bundle is loaded — the `wordcloud` series type
// lives in modules/wordcloud.js, which is not vendored (see prompts/library/
// highcharts.md "No add-on modules"). Instead of NOT_FEASIBLE, this snippet
// builds the layout itself: an Archimedean spiral packer measures each word
// with canvas `measureText`, places it at the tightest non-overlapping spot,
// and renders the words as a plain scatter series (invisible markers, sized
// dataLabels) — a genuine word cloud, not a simulation of one.

const t = window.ANYPLOT_TOKENS;
const size = window.ANYPLOT_SIZE;

// --- Data (in-memory, deterministic) ----------------------------------------
// Term frequencies mined from customer-support tickets for a cloud analytics
// platform — a common word-cloud use case (spec: "survey responses ...
// feedback patterns").
const terms = [
  ["performance", 187],
  ["reliability", 156],
  ["dashboard", 142],
  ["latency", 128],
  ["integration", 119],
  ["security", 108],
  ["api", 97],
  ["documentation", 89],
  ["pricing", 82],
  ["support", 76],
  ["scalability", 71],
  ["usability", 66],
  ["onboarding", 61],
  ["automation", 57],
  ["monitoring", 53],
  ["alerts", 49],
  ["backup", 46],
  ["compliance", 43],
  ["migration", 40],
  ["uptime", 37],
  ["analytics", 35],
  ["reporting", 33],
  ["customization", 31],
  ["mobile", 29],
  ["collaboration", 27],
  ["workflow", 25],
  ["notifications", 23],
  ["authentication", 21],
  ["deployment", 19],
  ["feedback", 17],
];

// --- Layout: Archimedean spiral packer --------------------------------------
const MIN_FONT = 22;
const MAX_FONT = 88;
const FONT_STACK =
  '-apple-system, BlinkMacSystemFont, "Segoe UI", Roboto, Helvetica, Arial, sans-serif';

const marginTop = 76;
const marginBottom = 44;
const marginSide = 30;
const plotWidth = size.width - marginSide * 2;
const plotHeight = size.height - marginTop - marginBottom;

const freqs = terms.map((d) => d[1]);
const freqMin = Math.min(...freqs);
const freqMax = Math.max(...freqs);
const freqTotal = freqs.reduce((sum, f) => sum + f, 0);

const measureCtx = document.createElement("canvas").getContext("2d");

function fontSizeFor(freq) {
  const ratio = Math.sqrt((freq - freqMin) / (freqMax - freqMin));
  return Math.round(MIN_FONT + (MAX_FONT - MIN_FONT) * ratio);
}

function fontWeightFor(fontSize) {
  if (fontSize >= 65) return "700";
  if (fontSize >= 42) return "600";
  return "500";
}

// A handful of words tilt off-horizontal (a common word-cloud convention) so
// the cloud reads as organically packed rather than size-sorted; most stay
// horizontal for legibility.
function rotationFor(i) {
  if (i % 4 === 3) return 90;
  if (i % 6 === 1) return -30;
  return 0;
}

function rotatedBounds(w, h, rotationDeg) {
  const rad = (rotationDeg * Math.PI) / 180;
  return {
    w: Math.abs(w * Math.cos(rad)) + Math.abs(h * Math.sin(rad)),
    h: Math.abs(w * Math.sin(rad)) + Math.abs(h * Math.cos(rad)),
  };
}

function rectsOverlap(a, b, pad) {
  return (
    a.x - pad < b.x + b.w &&
    a.x + a.w + pad > b.x &&
    a.y - pad < b.y + b.h &&
    a.y + a.h + pad > b.y
  );
}

const placedBoxes = [];
const points = [];
// Spiral center nudged slightly down-right of plot-area center so the packer
// fills the lower-right quadrant as evenly as the rest of the canvas.
const cx = plotWidth * 0.52;
const cy = plotHeight * 0.55;

terms.forEach(([word, freq], i) => {
  const fontSize = fontSizeFor(freq);
  const fontWeight = fontWeightFor(fontSize);
  const rotation = rotationFor(i);
  measureCtx.font = `${fontWeight} ${fontSize}px ${FONT_STACK}`;
  const rawW = measureCtx.measureText(word).width * 1.06; // small safety margin
  const rawH = fontSize * 1.25;
  const { w, h } = rotatedBounds(rawW, rawH, rotation);

  let angle = 0;
  let radius = 0;
  let x = cx;
  let y = cy;
  let ok = false;

  for (let attempt = 0; attempt < 4000; attempt++) {
    const box = { x: x - w / 2, y: y - h / 2, w, h };
    const inBounds =
      box.x >= 2 && box.y >= 2 && box.x + w <= plotWidth - 2 && box.y + h <= plotHeight - 2;
    if (inBounds && !placedBoxes.some((b) => rectsOverlap(box, b, 3))) {
      placedBoxes.push(box);
      ok = true;
      break;
    }
    angle += 0.32;
    radius += 1.8;
    x = cx + radius * Math.cos(angle);
    y = cy + radius * Math.sin(angle) * (plotHeight / plotWidth);
  }

  if (ok) {
    points.push({
      x,
      y,
      name: word,
      freq,
      share: freq / freqTotal,
      color: t.palette[i % t.palette.length],
      dataLabels: {
        rotation,
        style: {
          fontSize: `${fontSize}px`,
          fontWeight,
          color: t.palette[i % t.palette.length],
        },
      },
    });
  }
});

// --- Chart -------------------------------------------------------------------
Highcharts.chart("container", {
  chart: {
    type: "scatter",
    backgroundColor: "transparent",
    animation: false,
    margin: [marginTop, marginSide, marginBottom, marginSide],
    style: { fontFamily: "inherit" },
  },
  credits: { enabled: false },
  colors: t.palette,
  title: {
    text: "wordcloud-basic · javascript · highcharts · anyplot.ai",
    style: { color: t.ink, fontSize: "22px", fontWeight: "600" },
  },
  xAxis: { min: 0, max: plotWidth, visible: false },
  yAxis: { min: 0, max: plotHeight, reversed: true, visible: false, title: { text: null } },
  legend: { enabled: false },
  tooltip: {
    backgroundColor: t.elevatedBg,
    style: { color: t.ink },
    formatter() {
      const pct = (this.point.share * 100).toFixed(1);
      return `<b>${this.point.name}</b>: ${this.point.freq} mentions (${pct}% of corpus)`;
    },
  },
  plotOptions: {
    series: { animation: false },
    scatter: {
      marker: { enabled: false, states: { hover: { enabled: false } } },
      dataLabels: {
        enabled: true,
        format: "{point.name}",
        align: "center",
        verticalAlign: "middle",
        allowOverlap: true,
        crop: false,
        overflow: "allow",
        style: { fontFamily: "inherit", textOutline: "none" },
      },
      states: { inactive: { opacity: 1 } },
      point: {
        events: {
          // Bring the hovered word's label above its spiral-packed neighbors
          // — an idiomatic use of Highcharts' SVGElement.toFront().
          mouseOver() {
            if (this.dataLabel) this.dataLabel.toFront();
          },
        },
      },
    },
  },
  series: [{ name: "Support ticket terms", data: points }],
});
Runnable source as JSON, for any HTTP client: https://api.anyplot.ai/specs/wordcloud-basic/highcharts/code. Any spec id and library id listed in llms-full.txt fit the same URL shape; every URL below is complete and callable.
{
  "spec_id": "wordcloud-basic",
  "language": "javascript",
  "library": "highcharts",
  "page": "https://anyplot.ai/wordcloud-basic/javascript/highcharts",
  "hub": "https://anyplot.ai/wordcloud-basic",
  "code_json": "https://api.anyplot.ai/specs/wordcloud-basic/highcharts/code",
  "spec_json": "https://api.anyplot.ai/specs/wordcloud-basic",
  "render_light_png": "https://storage.googleapis.com/anyplot-images/plots/wordcloud-basic/javascript/highcharts/plot-light.png",
  "render_dark_png": "https://storage.googleapis.com/anyplot-images/plots/wordcloud-basic/javascript/highcharts/plot-dark.png",
  "interactive_light_html": "https://storage.googleapis.com/anyplot-images/plots/wordcloud-basic/javascript/highcharts/plot-light.html",
  "interactive_dark_html": "https://storage.googleapis.com/anyplot-images/plots/wordcloud-basic/javascript/highcharts/plot-dark.html",
  "quality_score": 88.0,
  "license": "MIT",
  "guide": "https://anyplot.ai/llms.txt"
}
Part of Basic Word Cloud on anyplot.ai.