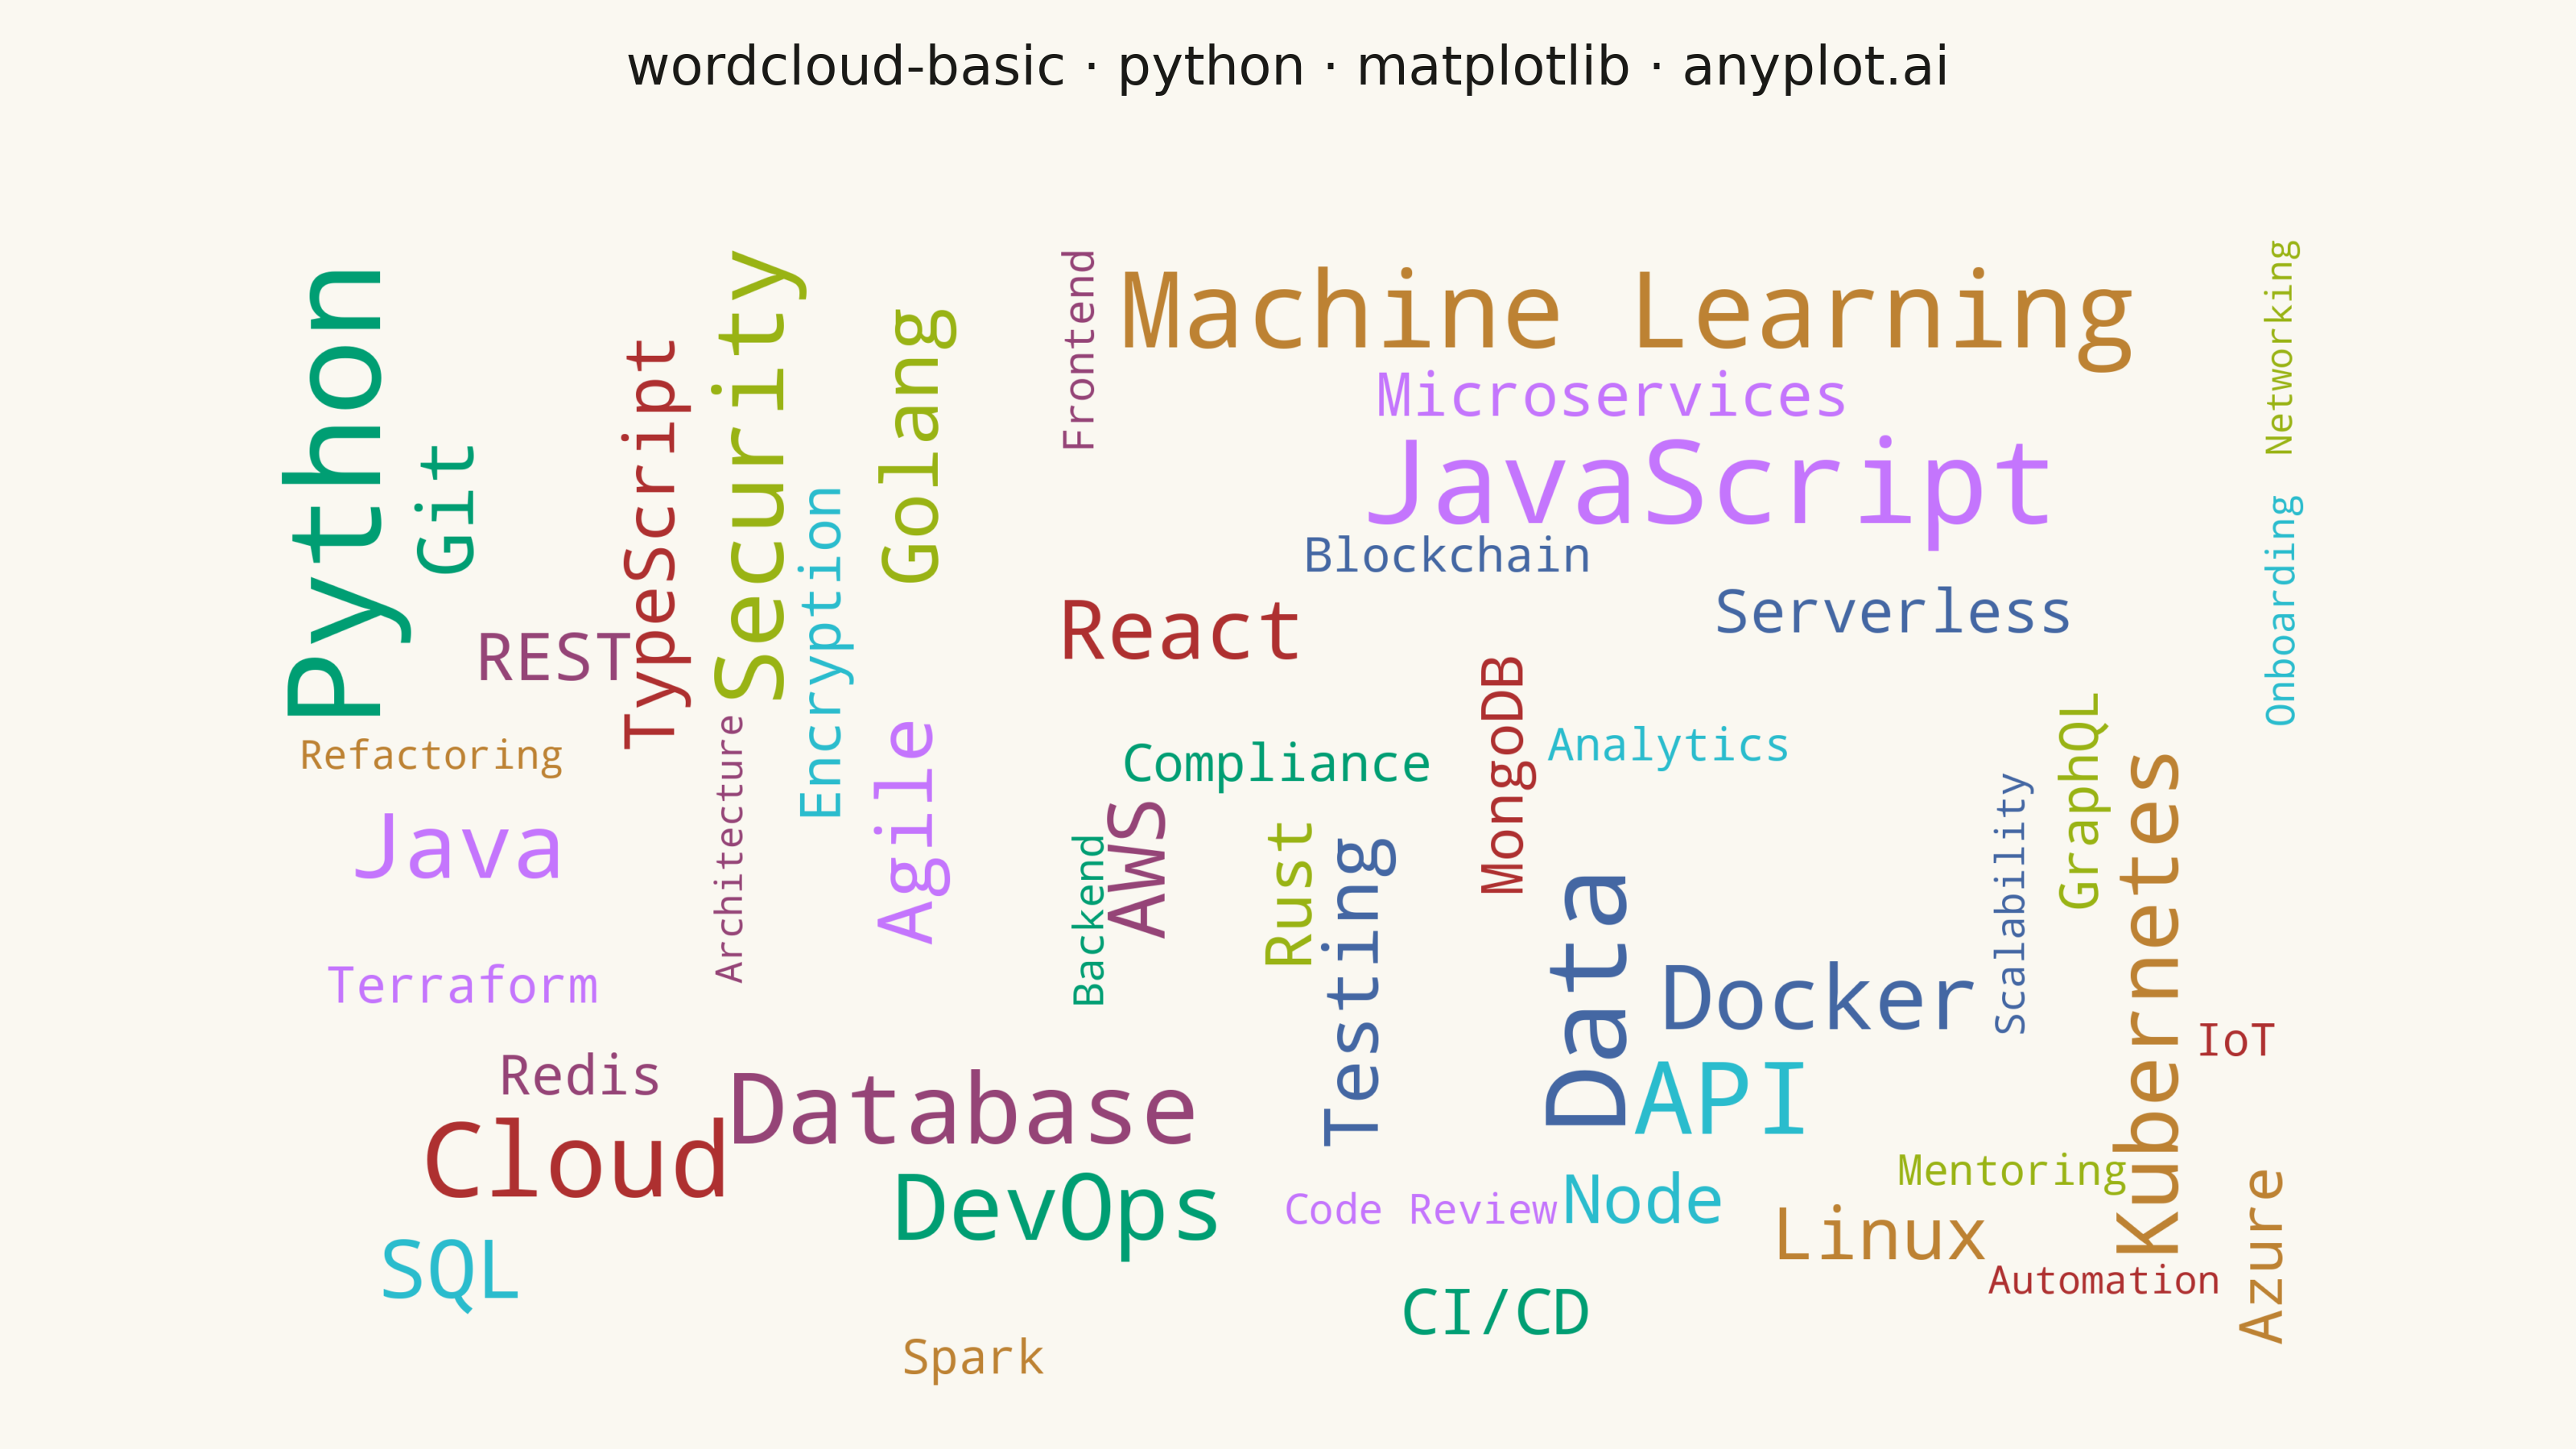
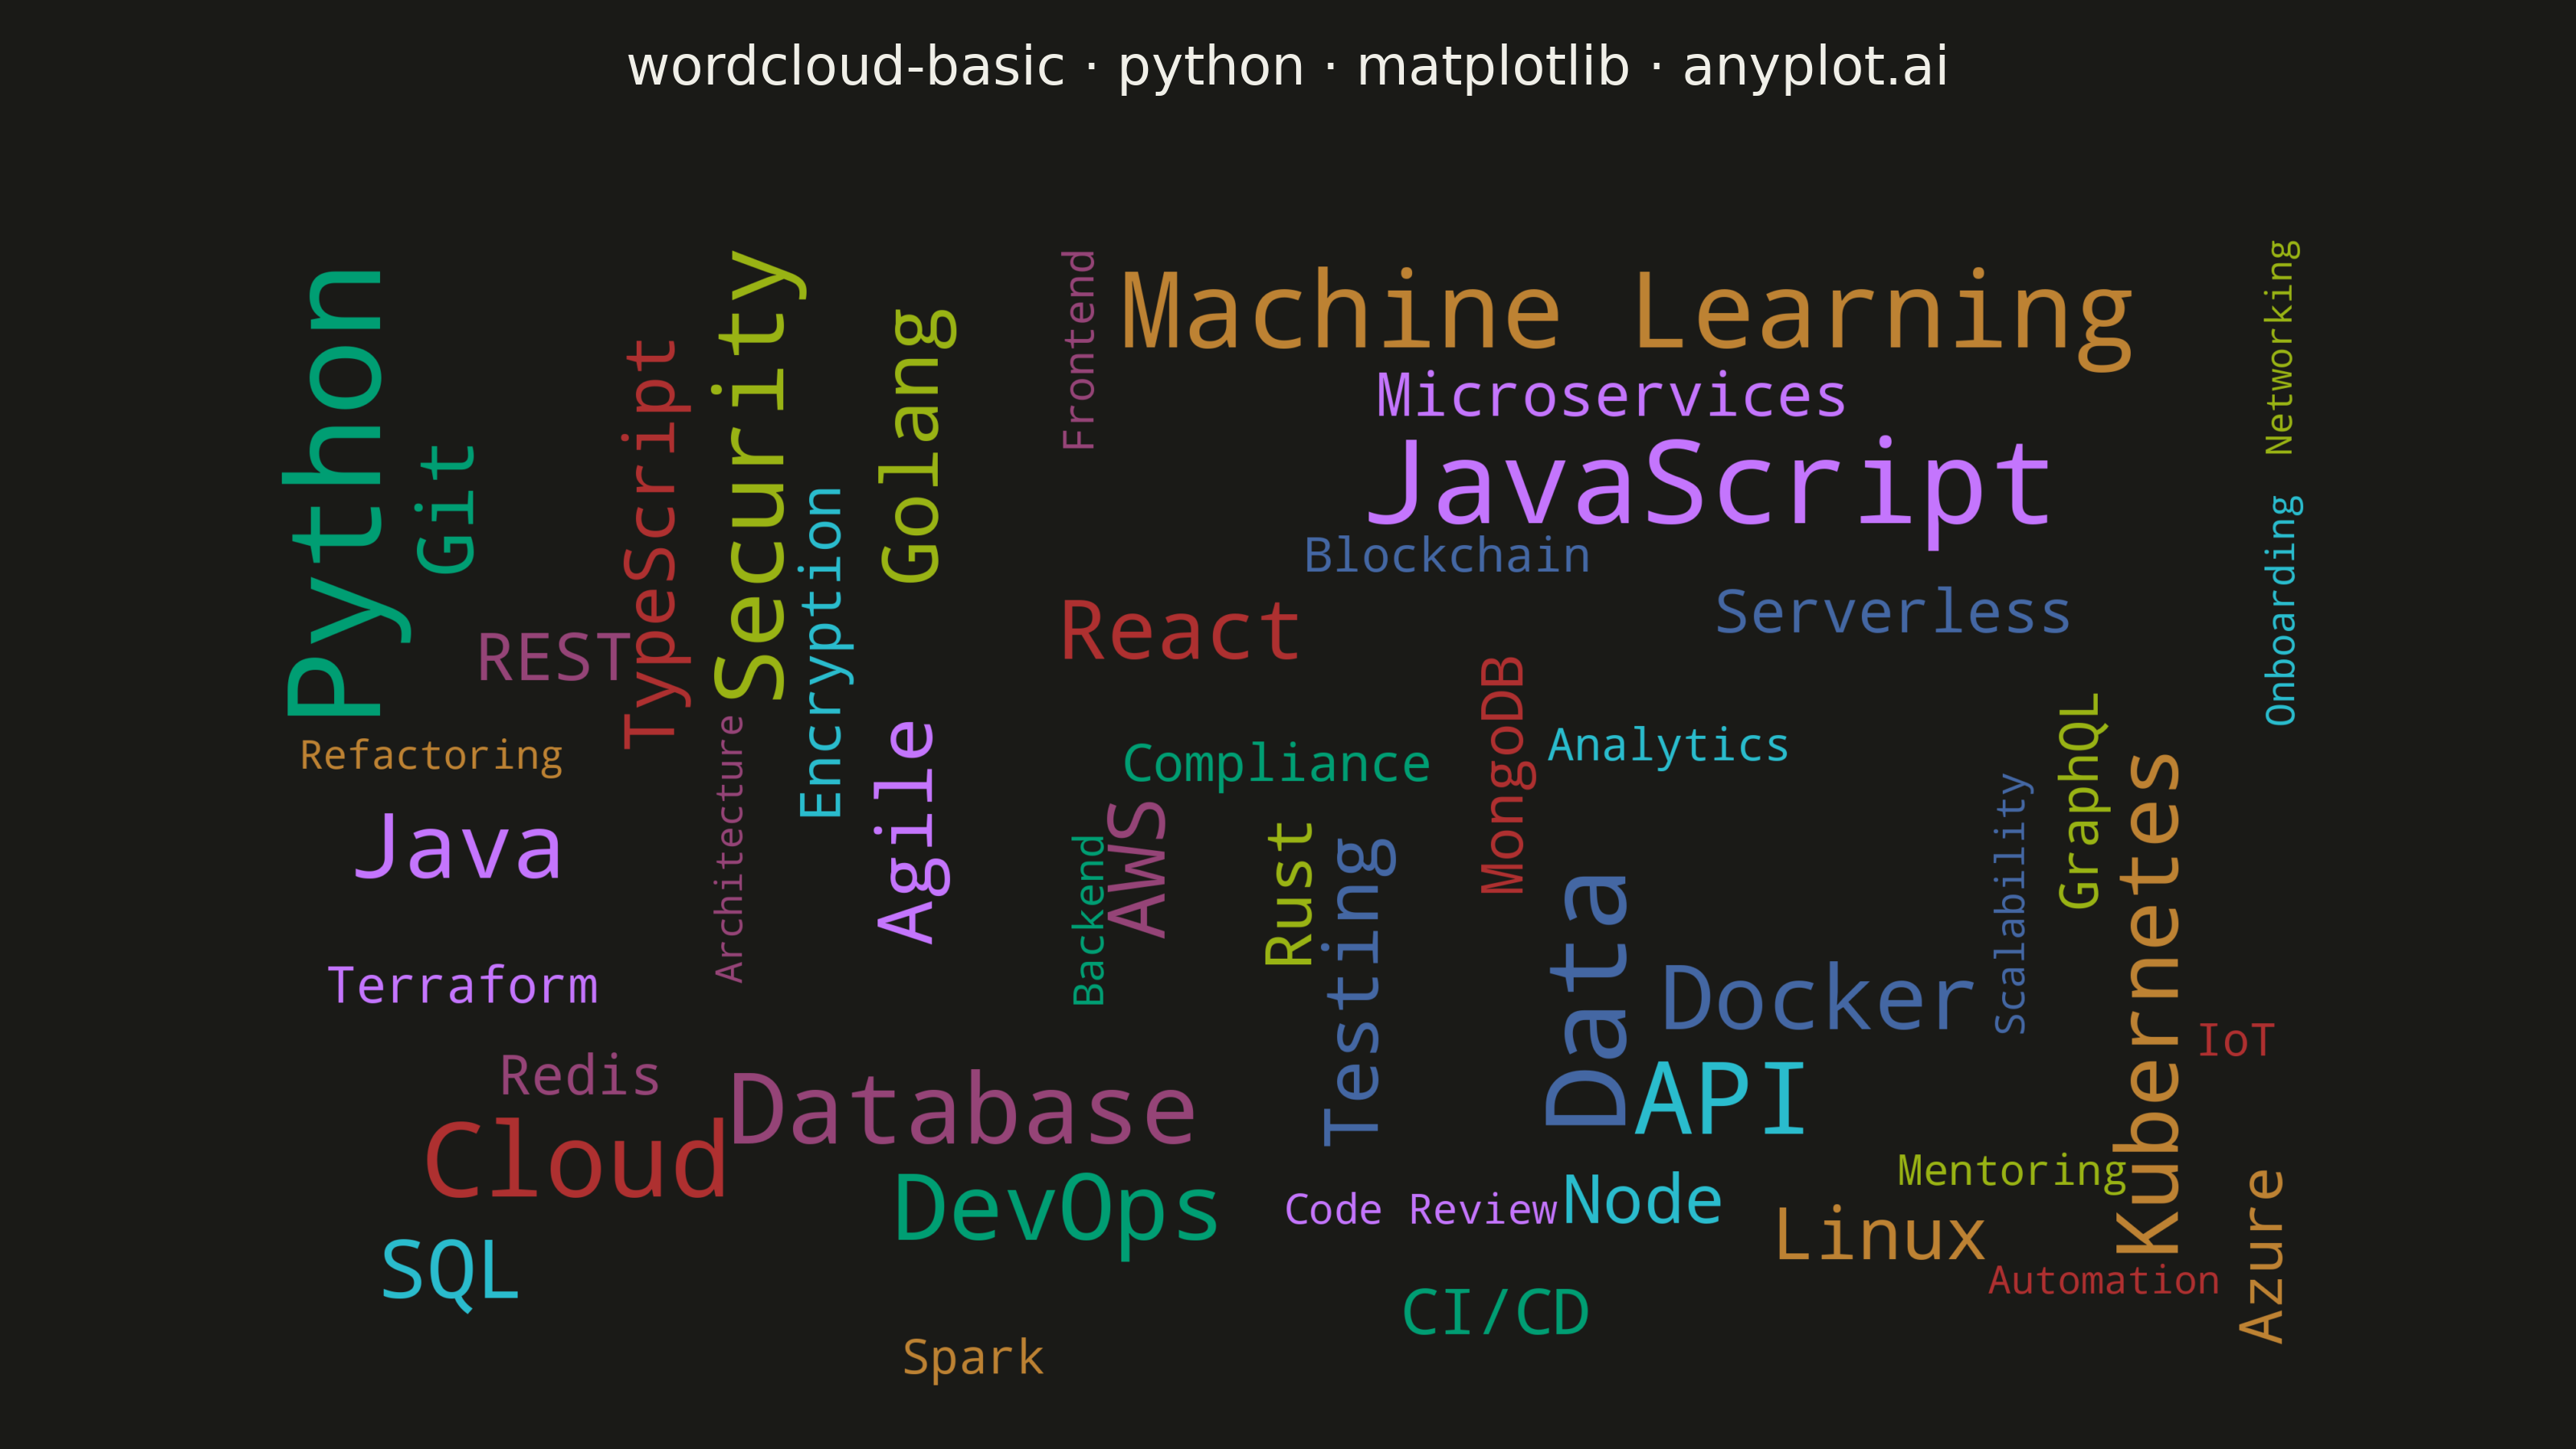
A word cloud displays text data where word size represents frequency or importance. Words are arranged to fill available space, creating a visual summary of text content that highlights prominent terms and patterns. This visualization is ideal for quickly identifying the most common themes or keywords in a body of text.
""" anyplot.ai
wordcloud-basic: Basic Word Cloud
Library: matplotlib 3.11.1 | Python 3.13.14
Quality: 89/100 | Updated: 2026-08-04
"""

import os

import matplotlib.pyplot as plt
from wordcloud import WordCloud


# Theme tokens (see prompts/default-style-guide.md "Background" + "Theme-adaptive Chrome")
THEME = os.getenv("ANYPLOT_THEME", "light")
PAGE_BG = "#FAF8F1" if THEME == "light" else "#1A1A17"
INK = "#1A1A17" if THEME == "light" else "#F0EFE8"

# Imprint palette — 8 hues, canonical order (see prompts/default-style-guide.md)
IMPRINT = ["#009E73", "#C475FD", "#4467A3", "#BD8233", "#AE3030", "#2ABCCD", "#954477", "#99B314"]

# Data - Tech industry survey responses about most valued skills
word_frequencies = {
    "Python": 150,
    "JavaScript": 120,
    "Data": 110,
    "Machine Learning": 100,
    "Cloud": 95,
    "API": 90,
    "Database": 85,
    "Security": 80,
    "DevOps": 75,
    "Java": 72,
    "Docker": 70,
    "Kubernetes": 65,
    "React": 60,
    "SQL": 58,
    "AWS": 55,
    "Golang": 53,
    "Git": 52,
    "Agile": 50,
    "Testing": 48,
    "Linux": 45,
    "TypeScript": 42,
    "Node": 40,
    "REST": 38,
    "Rust": 36,
    "CI/CD": 35,
    "Microservices": 32,
    "Serverless": 31,
    "Azure": 30,
    "MongoDB": 28,
    "Encryption": 27,
    "Redis": 26,
    "GraphQL": 24,
    "Compliance": 23,
    "Terraform": 22,
    "Blockchain": 20,
    "Spark": 20,
    "IoT": 18,
    "Analytics": 18,
    "Frontend": 16,
    "Mentoring": 16,
    "Backend": 15,
    "Code Review": 15,
    "Scalability": 14,
    "Refactoring": 14,
    "Automation": 13,
    "Onboarding": 13,
    "Architecture": 12,
    "Networking": 11,
}

# Assign Imprint hues by frequency rank (not by word hash) so color carries
# meaning: the most-valued skill is always brand green, the runner-up
# lavender, and so on — a deliberate hierarchy instead of an arbitrary bucket.
ranked_words = sorted(word_frequencies, key=word_frequencies.get, reverse=True)
rank_color = {word: IMPRINT[i % len(IMPRINT)] for i, word in enumerate(ranked_words)}


def color_func(word, font_size, position, orientation, random_state=None, **kwargs):
    return rank_color[word]


wc = WordCloud(
    width=3200,
    height=1800,
    background_color=PAGE_BG,
    max_words=100,
    min_font_size=18,
    max_font_size=200,
    random_state=42,
    prefer_horizontal=0.6,
    relative_scaling=0.5,
    margin=4,
).generate_from_frequencies(word_frequencies)
wc.recolor(color_func=color_func)

# Plot — see default-style-guide.md "Visual Sizing Defaults" for the canvas + sizing values
fig, ax = plt.subplots(figsize=(8, 4.5), dpi=400, facecolor=PAGE_BG)
ax.set_facecolor(PAGE_BG)
ax.imshow(wc, interpolation="bilinear")
ax.axis("off")

# Title
title = "wordcloud-basic · python · matplotlib · anyplot.ai"
title_fontsize = round(12 * 67 / len(title)) if len(title) > 67 else 12
fig.suptitle(title, fontsize=title_fontsize, fontweight="medium", color=INK, y=0.97)

fig.tight_layout(rect=[0, 0, 1, 0.94])
plt.savefig(f"plot-{THEME}.png", dpi=400, facecolor=PAGE_BG)  # bbox_inches MUST stay default (None)
Runnable source as JSON, for any HTTP client: https://api.anyplot.ai/specs/wordcloud-basic/matplotlib/code. Any spec id and library id listed in llms-full.txt fit the same URL shape; every URL below is complete and callable.
{
  "spec_id": "wordcloud-basic",
  "language": "python",
  "library": "matplotlib",
  "page": "https://anyplot.ai/wordcloud-basic/python/matplotlib",
  "hub": "https://anyplot.ai/wordcloud-basic",
  "code_json": "https://api.anyplot.ai/specs/wordcloud-basic/matplotlib/code",
  "spec_json": "https://api.anyplot.ai/specs/wordcloud-basic",
  "render_light_png": "https://storage.googleapis.com/anyplot-images/plots/wordcloud-basic/python/matplotlib/plot-light.png",
  "render_dark_png": "https://storage.googleapis.com/anyplot-images/plots/wordcloud-basic/python/matplotlib/plot-dark.png",
  "quality_score": 89.0,
  "license": "MIT",
  "guide": "https://anyplot.ai/llms.txt"
}
Part of Basic Word Cloud on anyplot.ai.