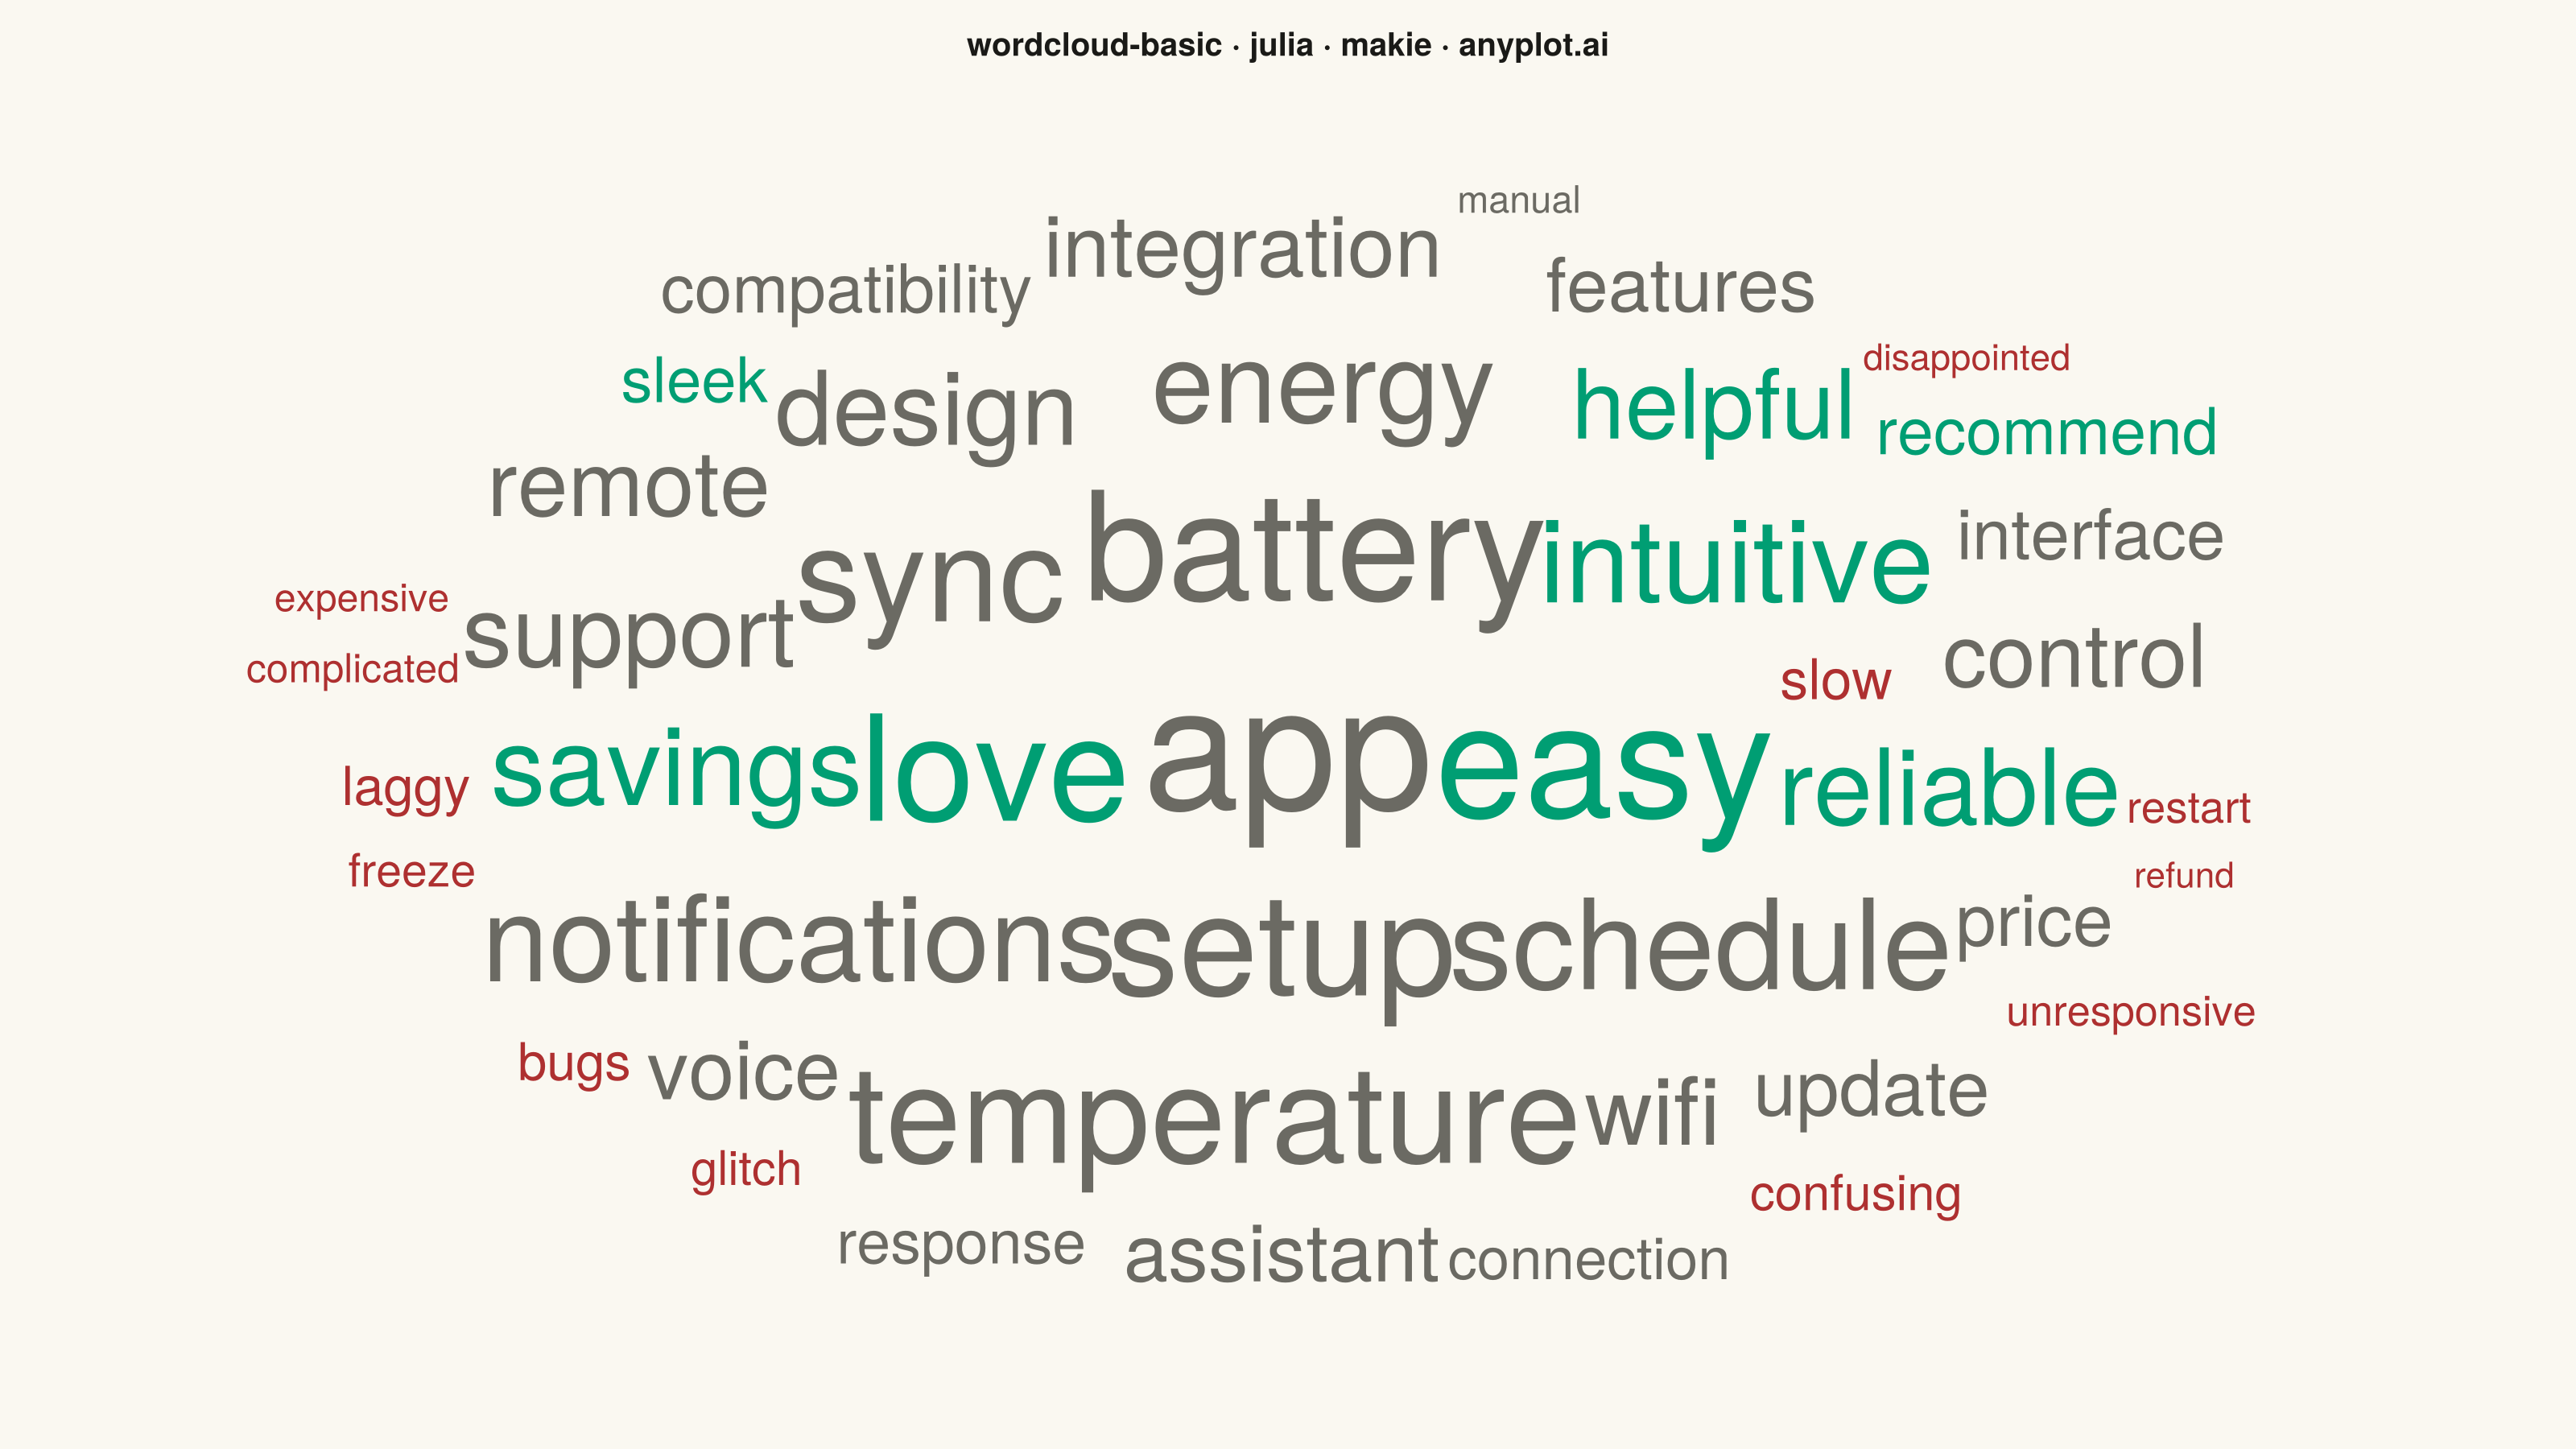
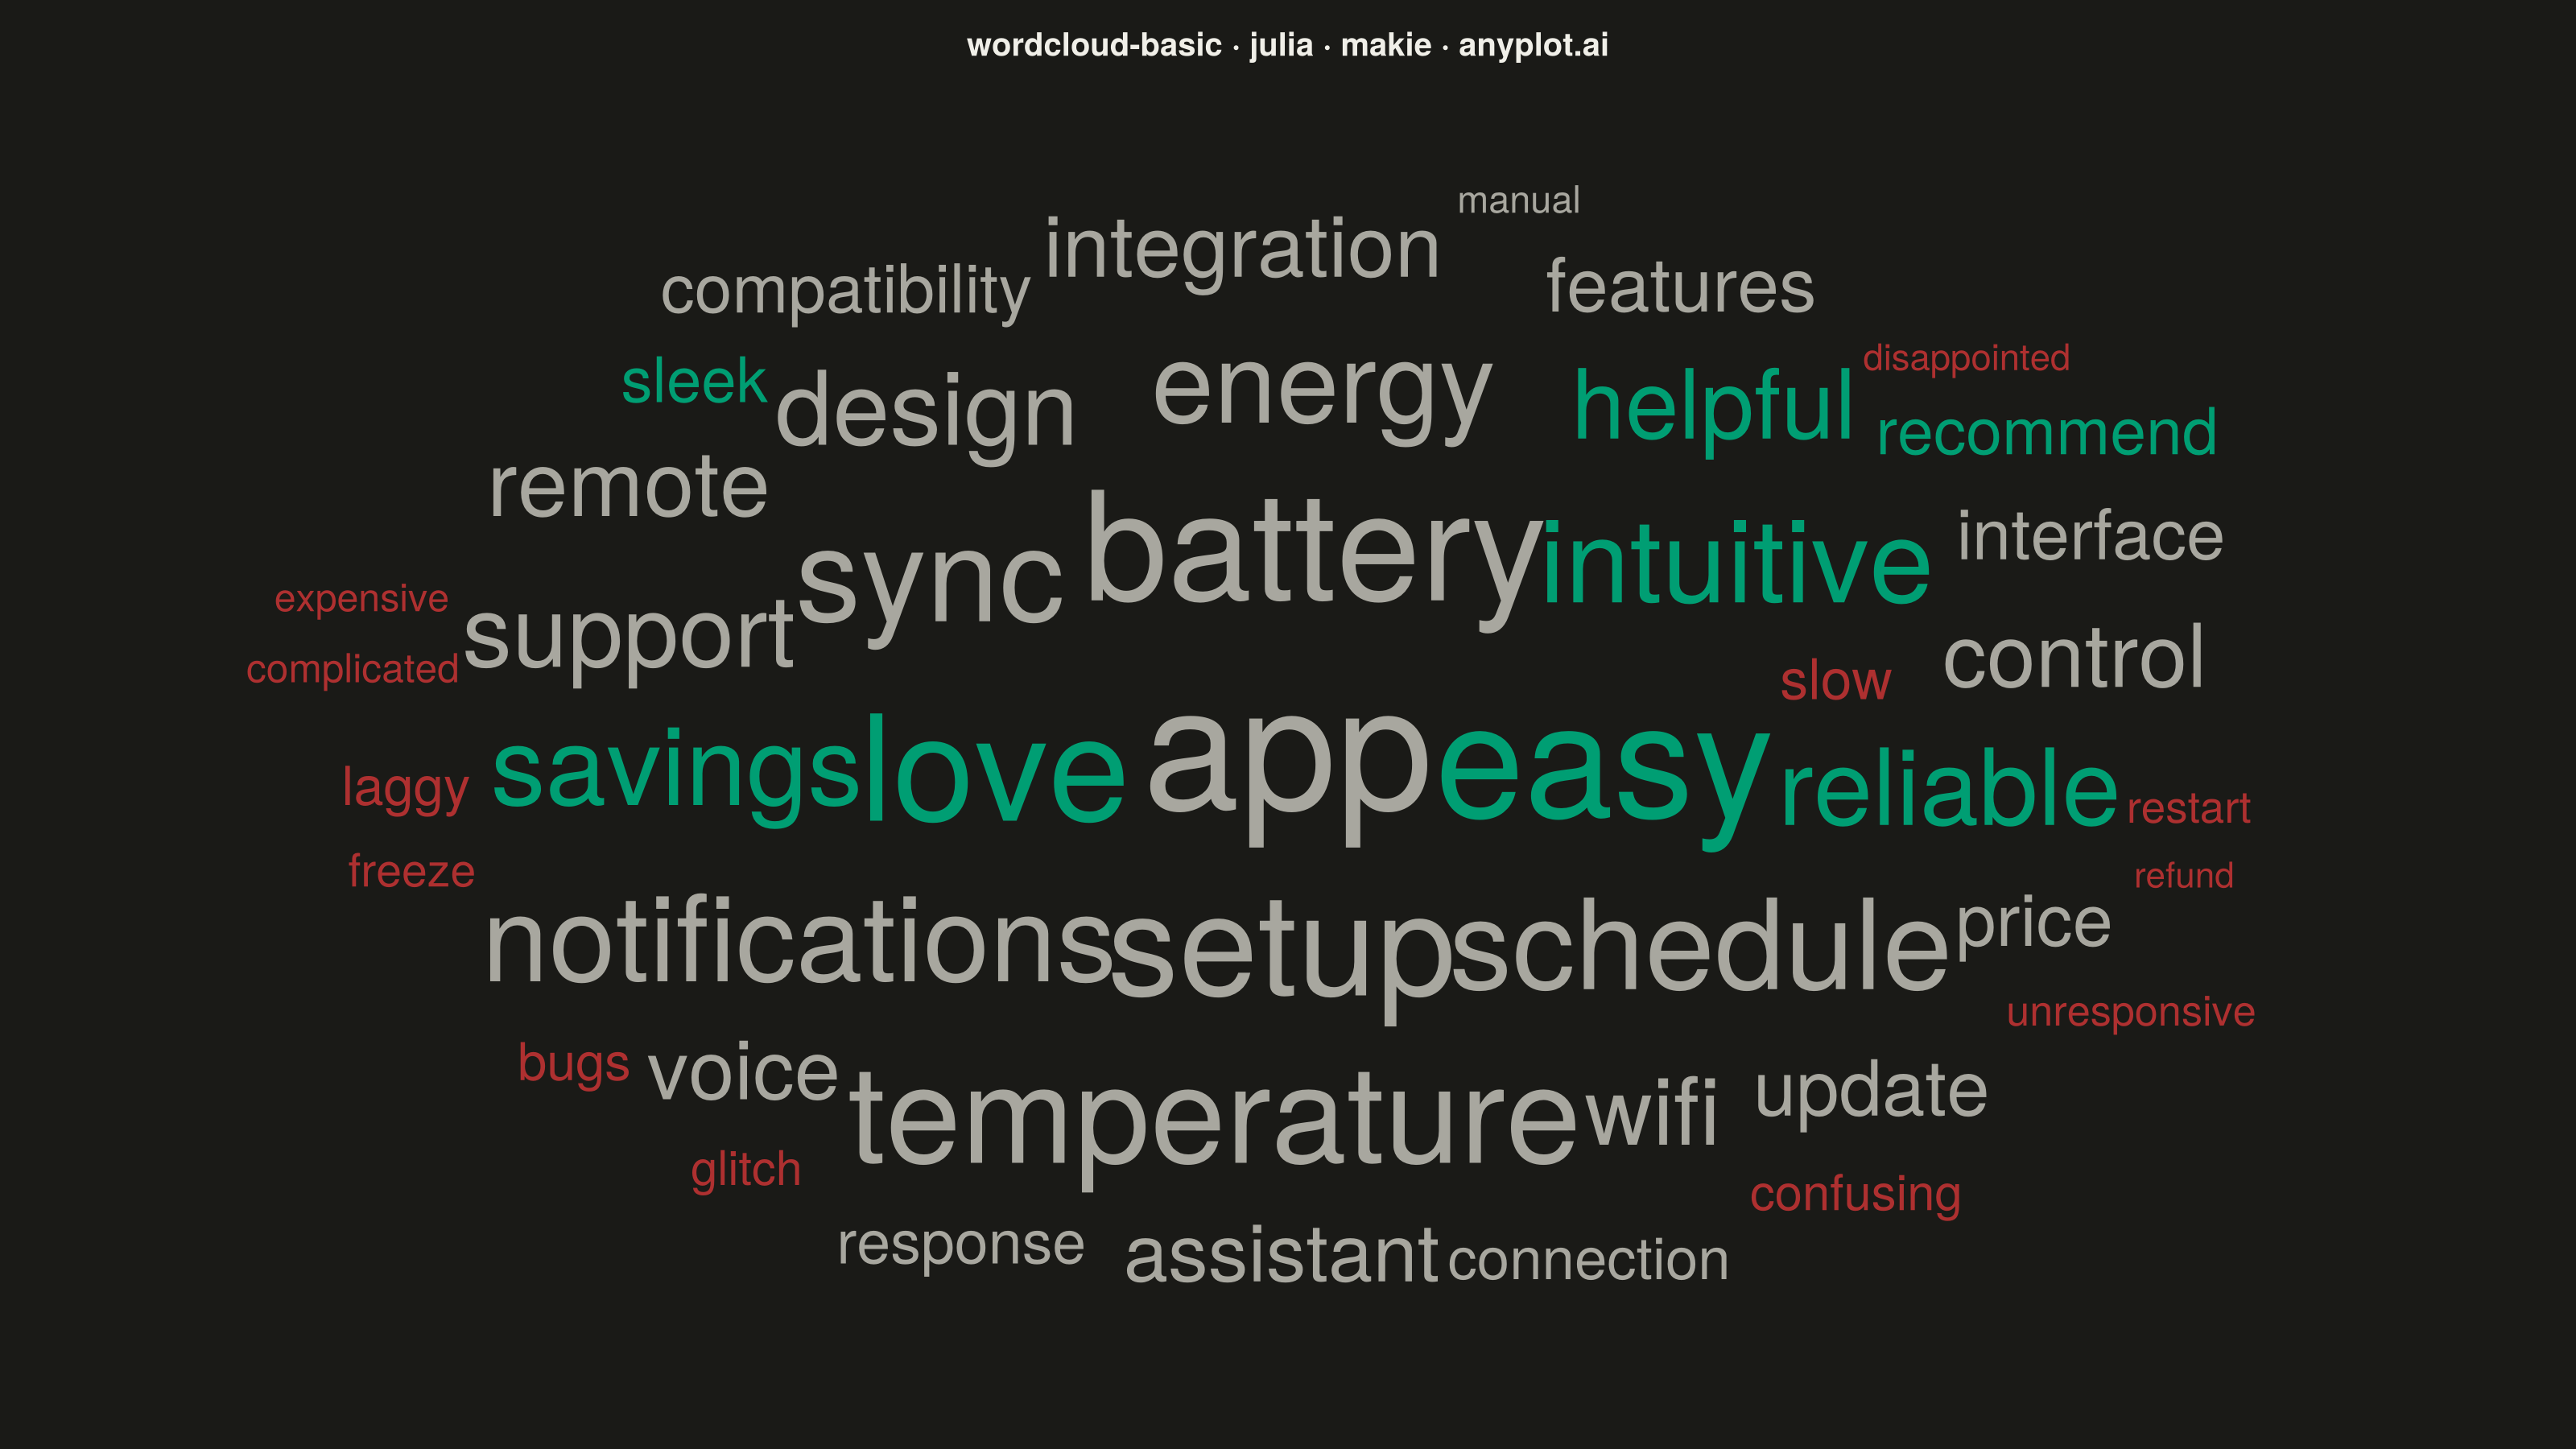
A word cloud displays text data where word size represents frequency or importance. Words are arranged to fill available space, creating a visual summary of text content that highlights prominent terms and patterns. This visualization is ideal for quickly identifying the most common themes or keywords in a body of text.
# anyplot.ai
# wordcloud-basic: Basic Word Cloud
# Library: makie 0.21.9 | Julia 1.11.9
# Quality: 88/100 | Created: 2026-08-04

using CairoMakie
using Makie
using Colors

# --- Theme tokens -----------------------------------------------------------
const THEME     = get(ENV, "ANYPLOT_THEME", "light")
const PAGE_BG   = THEME == "light" ? colorant"#FAF8F1" : colorant"#1A1A17"
const INK       = THEME == "light" ? colorant"#1A1A17" : colorant"#F0EFE8"
const INK_MUTED = THEME == "light" ? colorant"#6B6A63" : colorant"#A8A79F"
const IMPRINT_PALETTE = [
    colorant"#009E73", colorant"#C475FD", colorant"#4467A3", colorant"#BD8233",
    colorant"#AE3030", colorant"#2ABCCD", colorant"#954477", colorant"#99B314",
]

# --- Data: support-ticket term frequencies for a smart-thermostat app ------
words = [
    "app", "easy", "battery", "love", "setup", "temperature", "sync", "schedule",
    "notifications", "intuitive", "energy", "savings", "reliable", "design",
    "support", "helpful", "wifi", "remote", "control", "integration", "voice",
    "assistant", "update", "features", "price", "interface", "compatibility",
    "recommend", "sleek", "response", "connection", "slow", "laggy", "bugs",
    "confusing", "glitch", "freeze", "restart", "unresponsive", "complicated",
    "expensive", "manual", "disappointed", "refund",
]
frequencies = [
    340, 290, 260, 245, 230, 210, 195, 180,
    165, 155, 145, 138, 130, 122,
    115, 108, 102, 96, 90, 85, 80,
    75, 70, 66, 62, 58, 54,
    50, 47, 44, 41, 38, 35, 33,
    30, 28, 26, 24, 22, 20,
    19, 18, 17, 16,
]

order = sortperm(frequencies; rev = true)
words = words[order]
frequencies = Float64.(frequencies[order])

# Font size scaled by sqrt(frequency) so glyph AREA tracks word frequency
min_fs, max_fs = 22.0, 108.0
scaled = sqrt.(frequencies)
fontsizes = min_fs .+
    (scaled .- minimum(scaled)) ./ (maximum(scaled) - minimum(scaled)) .* (max_fs - min_fs)

# Color encodes sentiment polarity (not rank, which would just repeat the size
# signal): satisfaction terms -> brand green, complaint terms -> matte red,
# neutral/functional terms -> muted gray. This is the style guide's
# sentiment/polarity semantic exception.
positive_words = Set([
    "easy", "love", "intuitive", "savings", "reliable", "helpful", "recommend", "sleek",
])
negative_words = Set([
    "slow", "laggy", "bugs", "confusing", "glitch", "freeze", "restart",
    "unresponsive", "complicated", "expensive", "disappointed", "refund",
])
colors = [
    w in positive_words ? IMPRINT_PALETTE[1] :
    w in negative_words ? IMPRINT_PALETTE[5] :
    INK_MUTED
    for w in words
]

# --- Plot --------------------------------------------------------------------
fig = Figure(
    resolution      = (1600, 900),
    backgroundcolor = PAGE_BG,
)

ax = Axis(
    fig[1, 1];
    title           = "wordcloud-basic · julia · makie · anyplot.ai",
    titlesize       = 20,
    titlecolor      = INK,
    backgroundcolor = PAGE_BG,
    aspect          = DataAspect(),
)
hidedecorations!(ax)
hidespines!(ax)
xlims!(ax, -800, 800)
ylims!(ax, -450, 450)

# --- Word placement: Archimedean spiral search, no overlap ------------------
font = Makie.defaultfont()
pad = 6.0
x_bound, y_bound = 760.0, 400.0

placed = Tuple{Float64,Float64,Float64,Float64}[]  # (cx, cy, halfwidth, halfheight)

overlaps(cx, cy, hw, hh) = any(
    abs(cx - px) < hw + phw && abs(cy - py) < hh + phh
    for (px, py, phw, phh) in placed
)

for i in eachindex(words)
    wh = widths(Makie.text_bb(words[i], font, fontsizes[i]))
    hw, hh = wh[1] / 2 + pad, wh[2] / 2 + pad

    cx, cy = 0.0, 0.0
    if !isempty(placed)
        theta, radius = 0.0, 0.0
        step = 0.28
        tries = 0
        while true
            cx = radius * cos(theta)
            cy = radius * sin(theta) * 0.6
            fits_bounds = abs(cx) + hw <= x_bound && abs(cy) + hh <= y_bound
            tries += 1
            if (fits_bounds && !overlaps(cx, cy, hw, hh)) || tries >= 20000
                break
            end
            theta += step
            radius += 1.6 * step
        end
    end

    push!(placed, (cx, cy, hw, hh))
    text!(ax, cx, cy; text = words[i], fontsize = fontsizes[i],
          color = colors[i], font = font, align = (:center, :center))
end

# --- Save -------------------------------------------------------------------
save("plot-$(THEME).png", fig; px_per_unit = 2)
Runnable source as JSON, for any HTTP client: https://api.anyplot.ai/specs/wordcloud-basic/makie/code. Any spec id and library id listed in llms-full.txt fit the same URL shape; every URL below is complete and callable.
{
  "spec_id": "wordcloud-basic",
  "language": "julia",
  "library": "makie",
  "page": "https://anyplot.ai/wordcloud-basic/julia/makie",
  "hub": "https://anyplot.ai/wordcloud-basic",
  "code_json": "https://api.anyplot.ai/specs/wordcloud-basic/makie/code",
  "spec_json": "https://api.anyplot.ai/specs/wordcloud-basic",
  "render_light_png": "https://storage.googleapis.com/anyplot-images/plots/wordcloud-basic/julia/makie/plot-light.png",
  "render_dark_png": "https://storage.googleapis.com/anyplot-images/plots/wordcloud-basic/julia/makie/plot-dark.png",
  "quality_score": 88.0,
  "license": "MIT",
  "guide": "https://anyplot.ai/llms.txt"
}
Part of Basic Word Cloud on anyplot.ai.