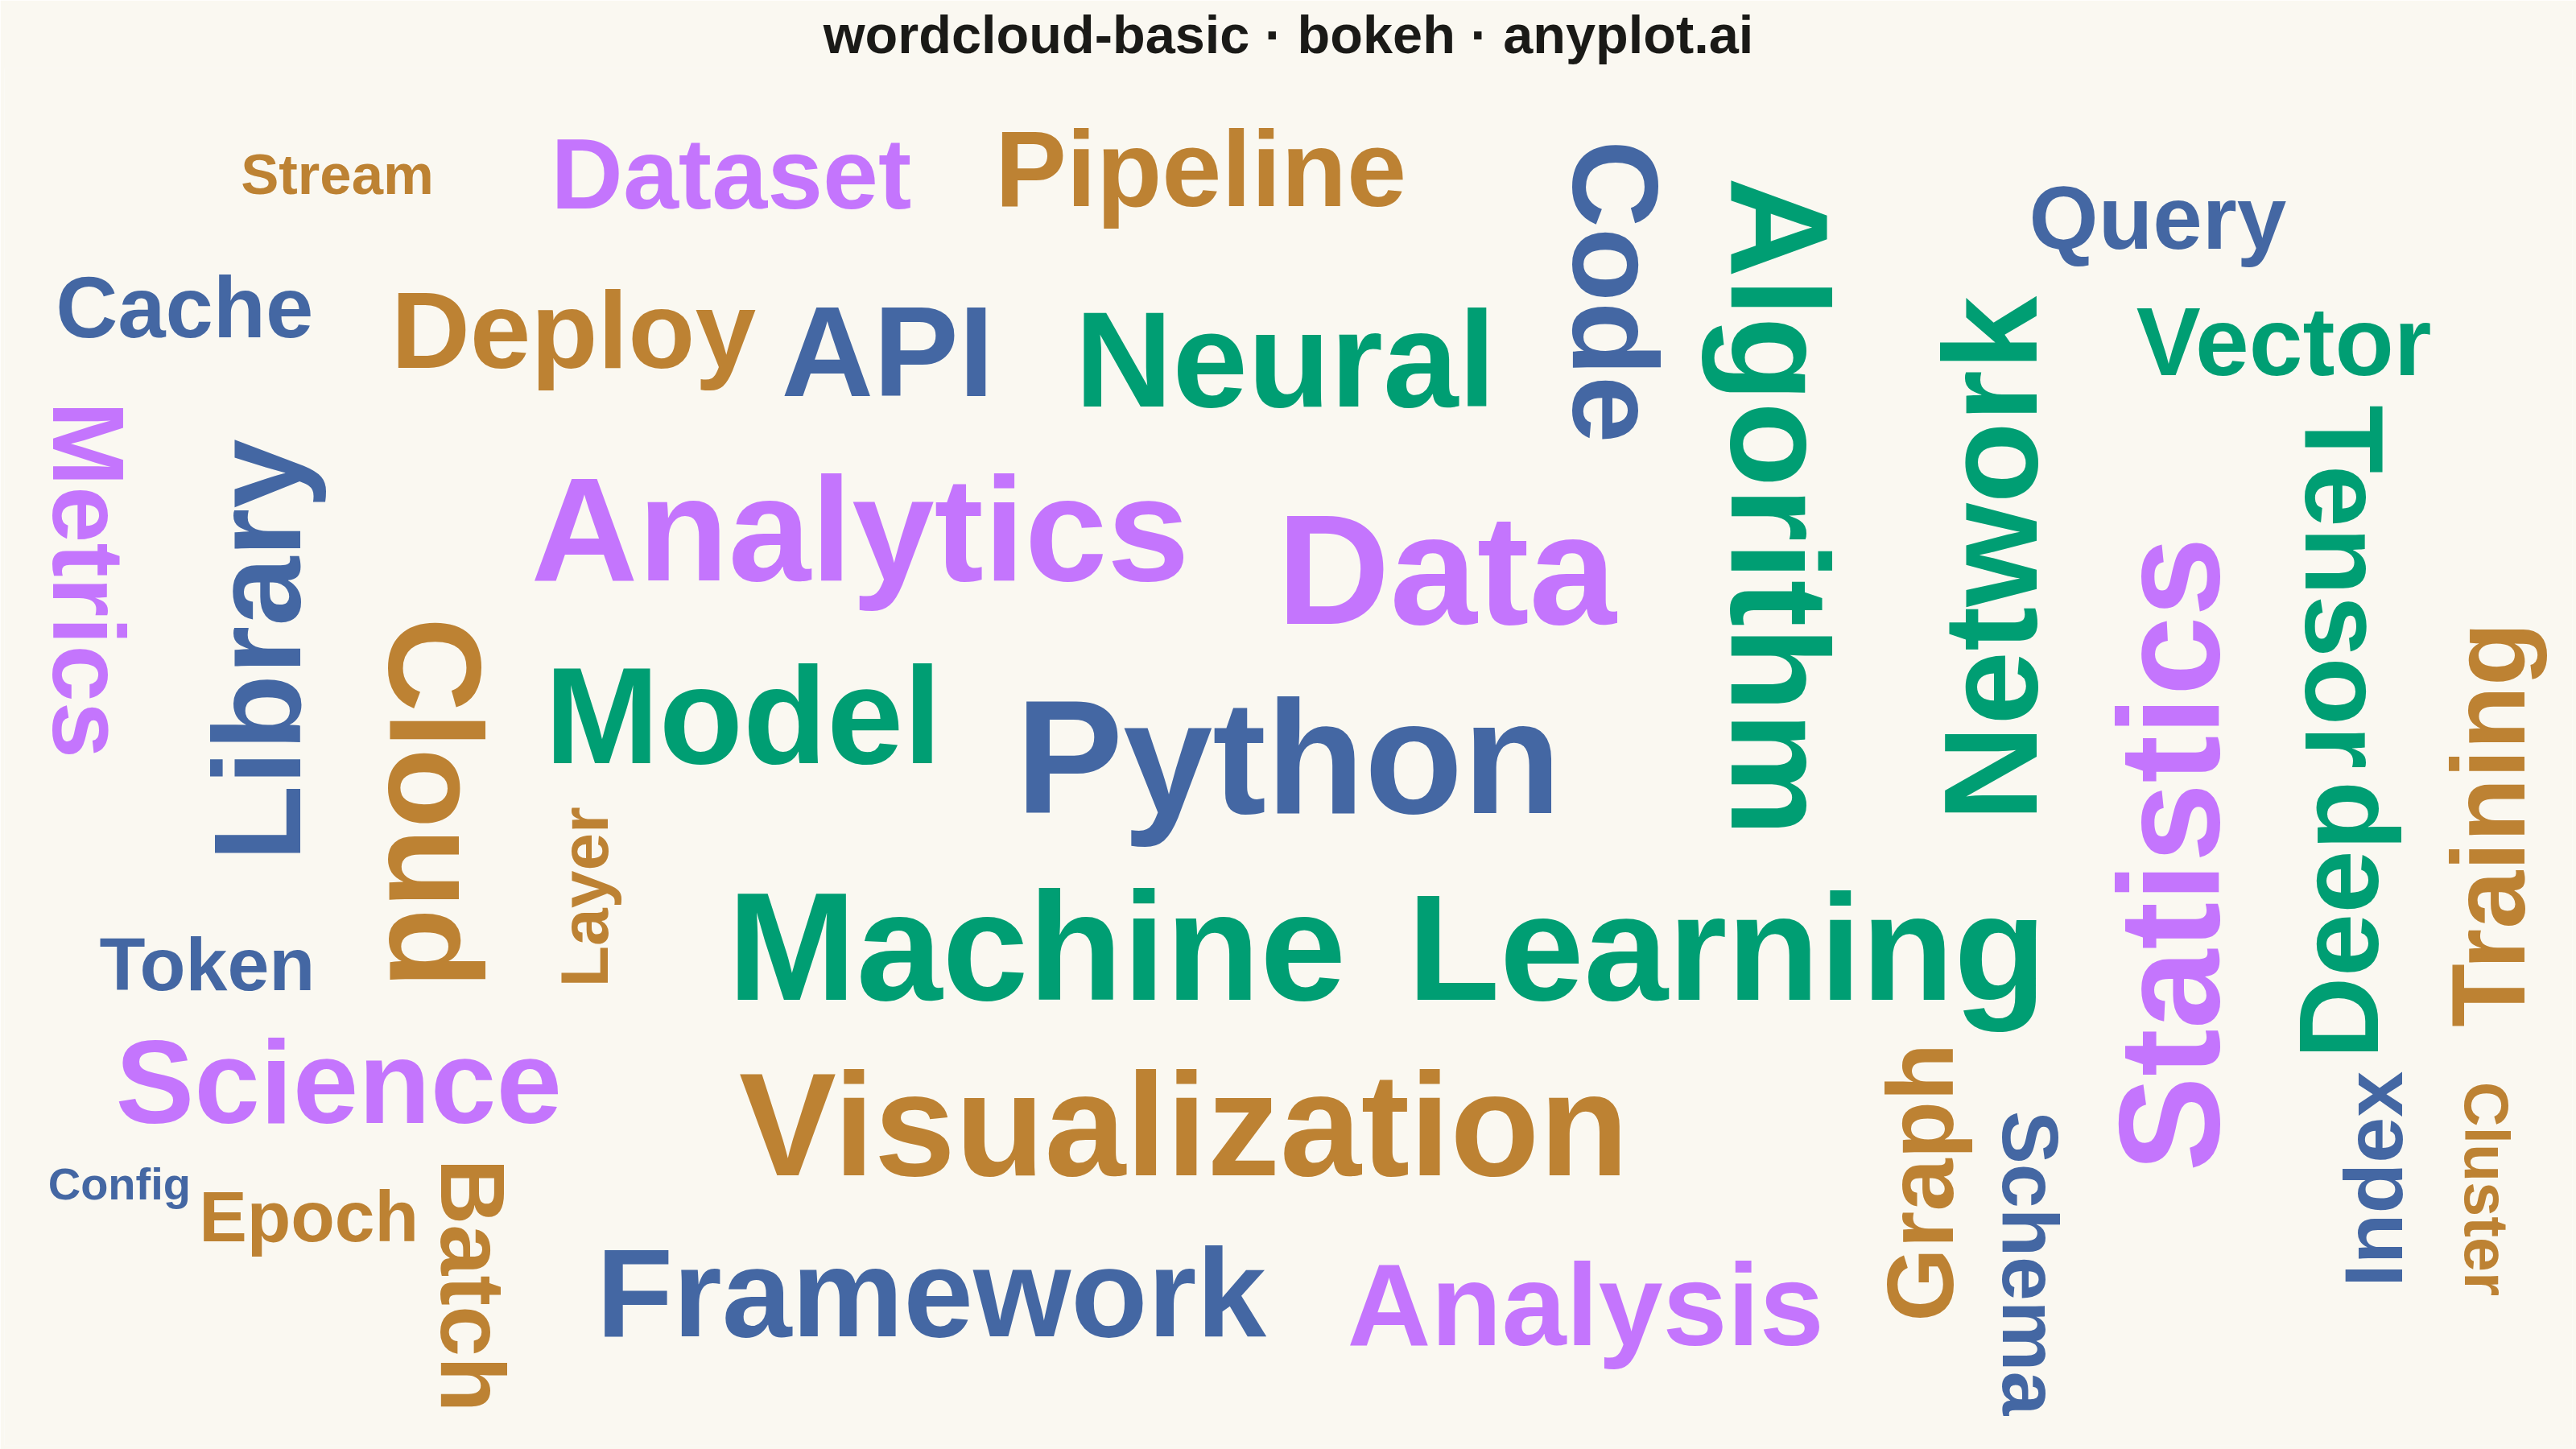
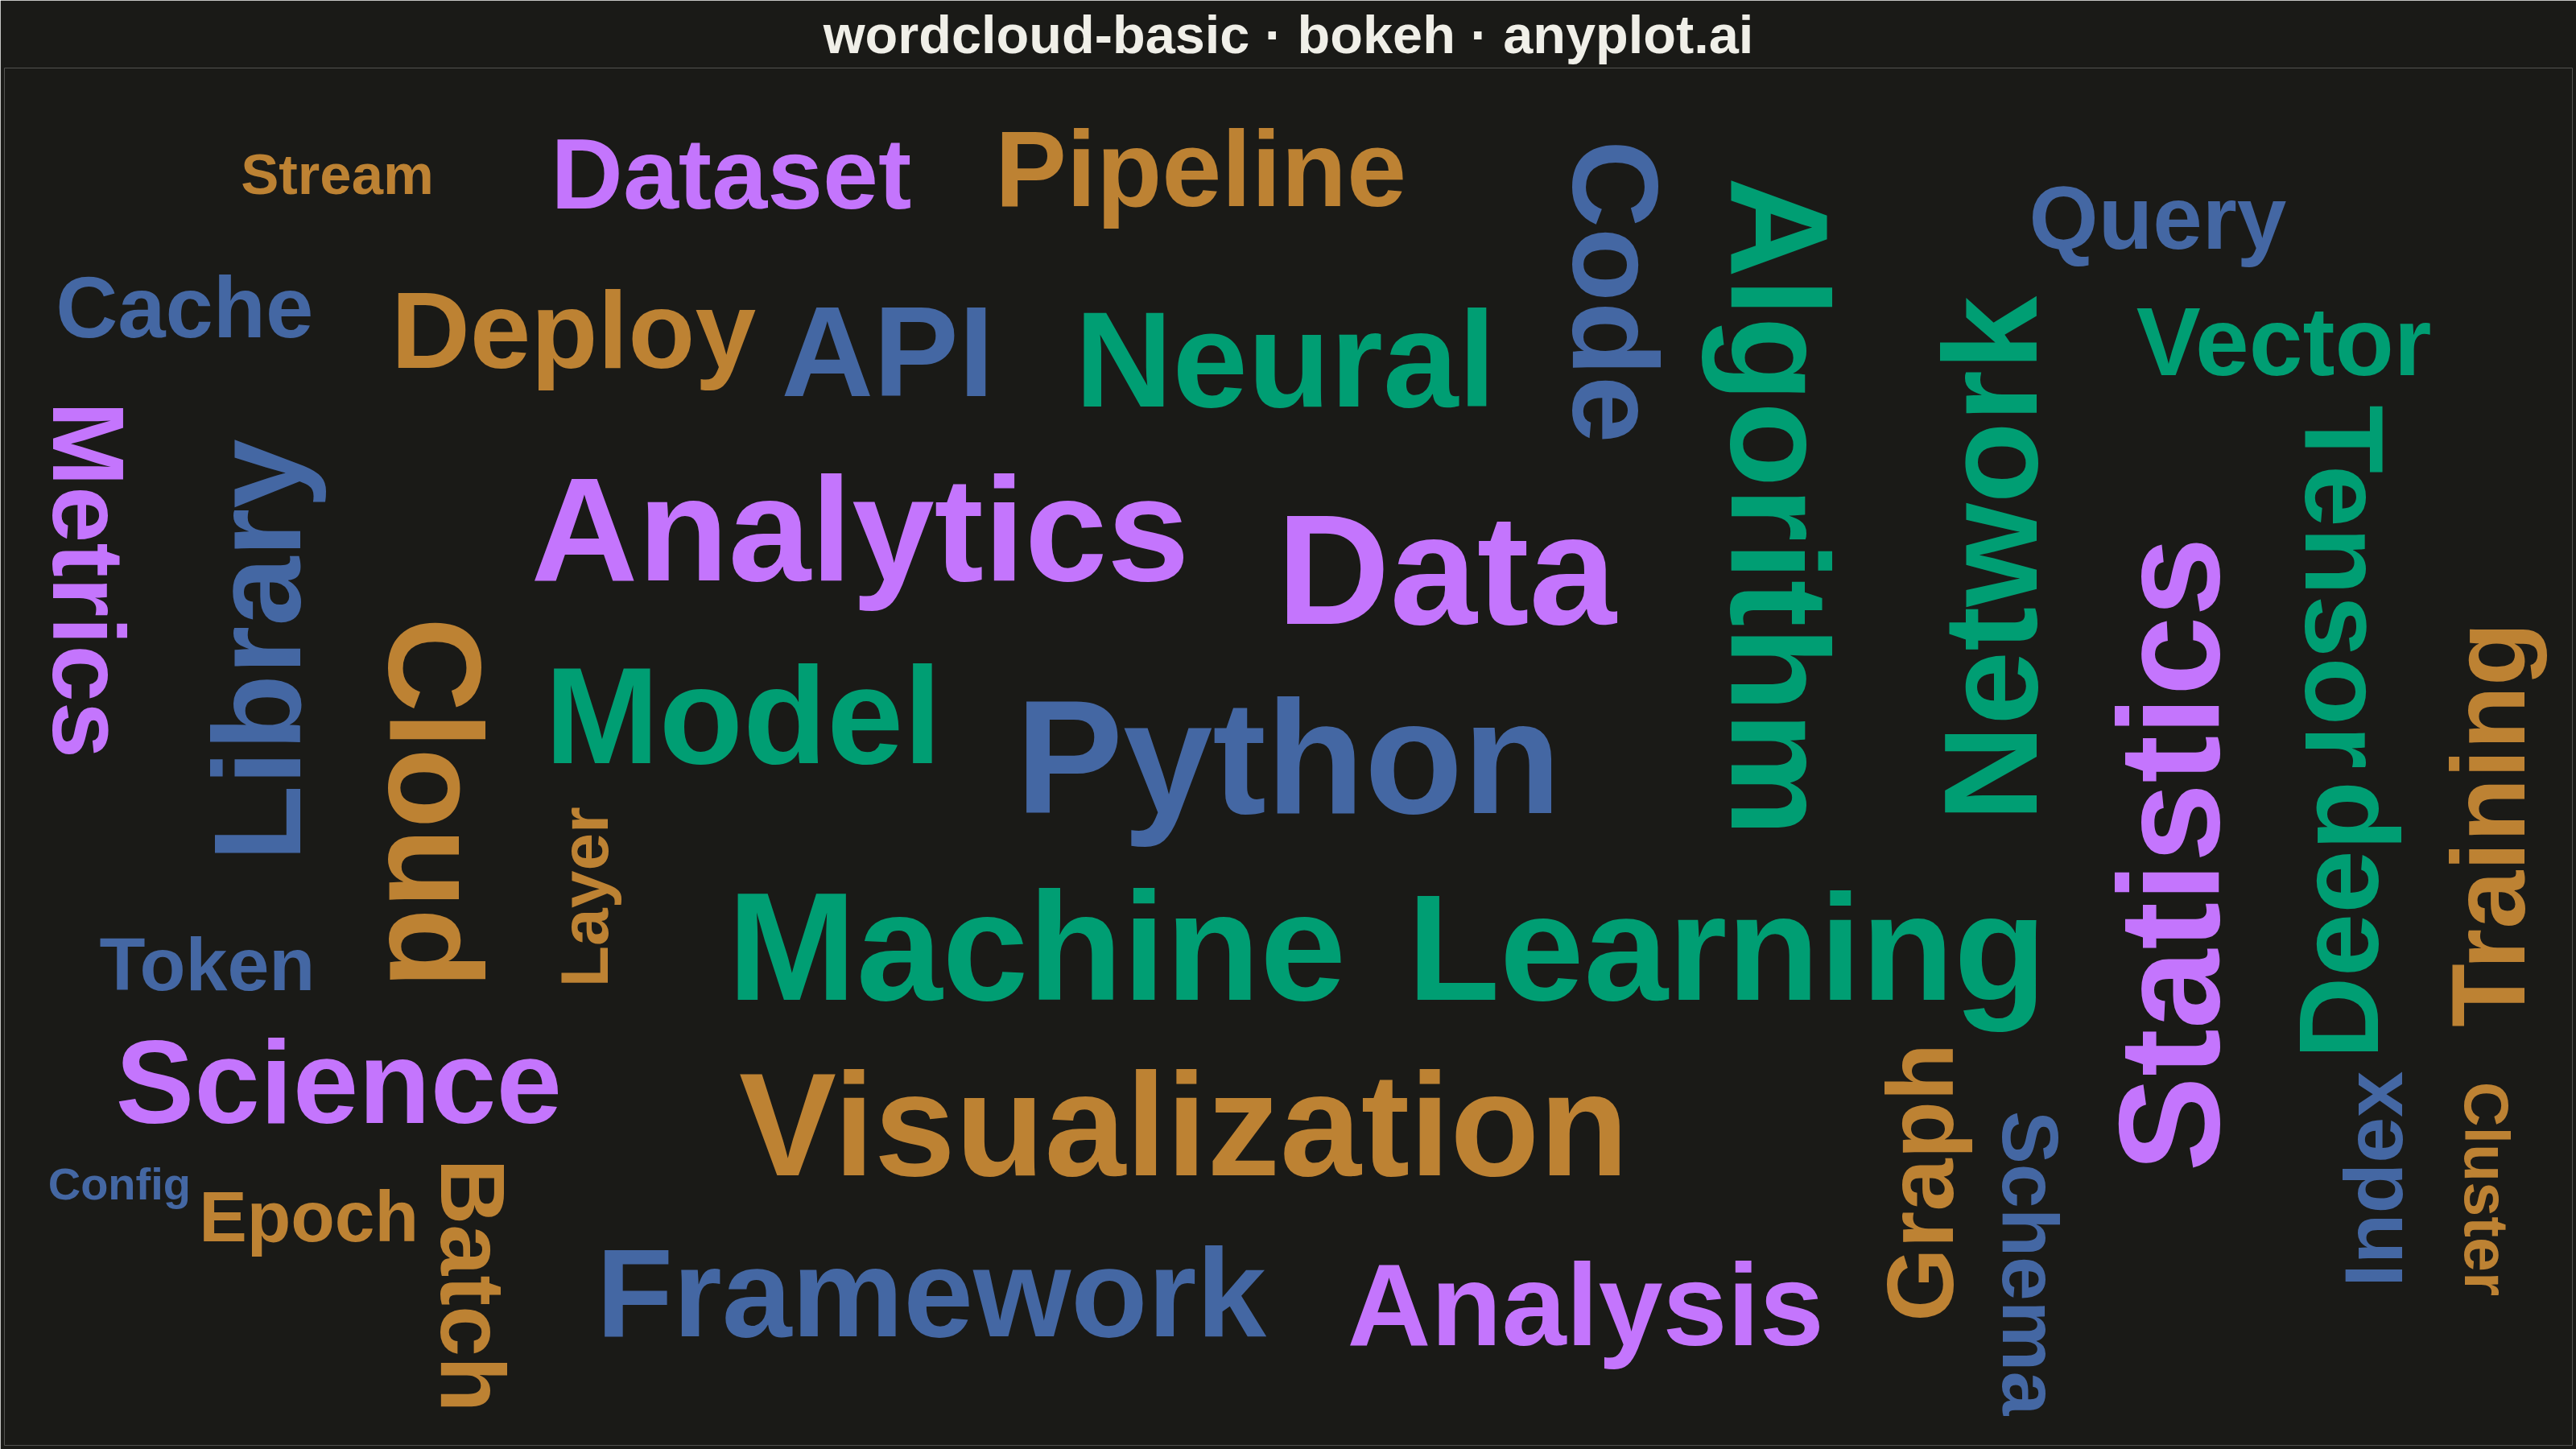
A word cloud displays text data where word size represents frequency or importance. Words are arranged to fill available space, creating a visual summary of text content that highlights prominent terms and patterns. This visualization is ideal for quickly identifying the most common themes or keywords in a body of text.
""" anyplot.ai
wordcloud-basic: Basic Word Cloud
Library: bokeh 3.9.2 | Python 3.13.14
Quality: 93/100 | Updated: 2026-08-04
"""

import os
import time
from pathlib import Path

import numpy as np
from bokeh.io import output_file, save
from bokeh.models import ColumnDataSource, HoverTool, LabelSet
from bokeh.plotting import figure
from selenium import webdriver
from selenium.webdriver.chrome.options import Options


THEME = os.getenv("ANYPLOT_THEME", "light")
PAGE_BG = "#FAF8F1" if THEME == "light" else "#1A1A17"
ELEVATED_BG = "#FFFDF6" if THEME == "light" else "#242420"
INK = "#1A1A17" if THEME == "light" else "#F0EFE8"
INK_SOFT = "#4A4A44" if THEME == "light" else "#B8B7B0"


# Color encodes topical category (a second, independent dimension) rather than
# frequency, which is already shown by size - a size+color double-encoding of
# the same variable was flagged as redundant in review. Each category gets one
# fixed Imprint categorical color (see prompts/library/bokeh.md IMPRINT_PALETTE).
CATEGORY_COLORS = {
    "ML & Algorithms": "#009E73",
    "Data & Analytics": "#C475FD",
    "Tools & Libraries": "#4467A3",
    "Infra & Pipeline": "#BD8233",
}

# Data: Technology terms with frequencies and topical category
words_data = [
    ("Python", 100, "Tools & Libraries"),
    ("Data", 95, "Data & Analytics"),
    ("Machine", 92, "ML & Algorithms"),
    ("Learning", 88, "ML & Algorithms"),
    ("Analytics", 85, "Data & Analytics"),
    ("Visualization", 82, "Infra & Pipeline"),
    ("Statistics", 78, "Data & Analytics"),
    ("Algorithm", 75, "ML & Algorithms"),
    ("Model", 72, "ML & Algorithms"),
    ("Neural", 70, "ML & Algorithms"),
    ("Network", 68, "ML & Algorithms"),
    ("Cloud", 65, "Infra & Pipeline"),
    ("API", 62, "Tools & Libraries"),
    ("Framework", 60, "Tools & Libraries"),
    ("Library", 58, "Tools & Libraries"),
    ("Code", 55, "Tools & Libraries"),
    ("Science", 52, "Data & Analytics"),
    ("Analysis", 50, "Data & Analytics"),
    ("Deep", 48, "ML & Algorithms"),
    ("Tensor", 46, "ML & Algorithms"),
    ("Deploy", 44, "Infra & Pipeline"),
    ("Pipeline", 42, "Infra & Pipeline"),
    ("Training", 40, "Infra & Pipeline"),
    ("Metrics", 38, "Data & Analytics"),
    ("Dataset", 36, "Data & Analytics"),
    ("Vector", 34, "ML & Algorithms"),
    ("Graph", 32, "Infra & Pipeline"),
    ("Batch", 30, "Infra & Pipeline"),
    ("Query", 28, "Tools & Libraries"),
    ("Cache", 26, "Tools & Libraries"),
    ("Index", 24, "Tools & Libraries"),
    ("Schema", 22, "Tools & Libraries"),
    ("Token", 20, "Tools & Libraries"),
    ("Epoch", 18, "Infra & Pipeline"),
    ("Layer", 16, "Infra & Pipeline"),
    ("Cluster", 14, "Infra & Pipeline"),
    ("Stream", 12, "Infra & Pipeline"),
    ("Config", 10, "Tools & Libraries"),
]

canvas_width = 3200
canvas_height = 1800

min_freq = min(f for _, f, _ in words_data)
max_freq = max(f for _, f, _ in words_data)
min_size, max_size = 42, 150

rotations = [0, 0, 90, -90]

words = []
x_pos = []
y_pos = []
sizes = []
colors = []
angles = []
frequencies = []
categories = []
placed_boxes = []

for i, (word, freq, category) in enumerate(words_data):
    # Sub-linear (power 0.6) curve on the normalized frequency raises the
    # size floor for the lowest-frequency words so they stay legible once
    # downscaled to a gallery thumbnail, while the highest-frequency words
    # still top out at max_size.
    freq_normalized = (freq - min_freq) / (max_freq - min_freq)
    size = int(min_size + freq_normalized**0.6 * (max_size - min_size))

    if i < 5:
        angle_deg = 0
    else:
        angle_deg = rotations[i % len(rotations)]
    angle_rad = np.radians(angle_deg)

    # bokeh text_font_size is set in CSS pt; headless Chrome renders pt at
    # 1pt ~= 1.333 source-px, so the pt value must be converted to px before
    # it's usable as a collision-box dimension.
    px_size = size * 1.333
    base_width = len(word) * px_size * 0.58
    base_height = px_size * 1.2
    if angle_deg != 0:
        word_width = base_height
        word_height = base_width
    else:
        word_width = base_width
        word_height = base_height

    cx, cy = canvas_width / 2, canvas_height / 2
    spiral_angle = 0
    radius = 0
    padding = 7
    found_x, found_y = cx, cy
    found_box = (cx - word_width / 2, cy - word_height / 2, word_width, word_height)

    for _ in range(25000):
        test_x = cx + radius * 2.0 * np.cos(spiral_angle) - word_width / 2
        test_y = cy + radius * np.sin(spiral_angle) - word_height / 2

        margin_x = 20
        margin_y = 35
        if (
            margin_x < test_x < canvas_width - word_width - margin_x
            and margin_y < test_y < canvas_height - word_height - margin_y
        ):
            test_box = (test_x, test_y, word_width, word_height)

            overlap = False
            for pb in placed_boxes:
                px, py, pw, ph = pb
                if not (
                    test_x + word_width + padding < px
                    or px + pw + padding < test_x
                    or test_y + word_height + padding < py
                    or py + ph + padding < test_y
                ):
                    overlap = True
                    break

            if not overlap:
                found_x = test_x + word_width / 2
                found_y = test_y + word_height / 2
                found_box = test_box
                break

        spiral_angle += 0.08
        radius += 0.8

    placed_boxes.append(found_box)
    words.append(word)
    x_pos.append(found_x)
    y_pos.append(found_y)
    sizes.append(size)
    angles.append(angle_rad)
    frequencies.append(freq)
    categories.append(category)
    colors.append(CATEGORY_COLORS[category])

p = figure(
    width=canvas_width,
    height=canvas_height,
    title="wordcloud-basic · bokeh · anyplot.ai",
    x_range=(0, canvas_width),
    y_range=(0, canvas_height),
    tools="hover",
    toolbar_location=None,
)

hit_sizes = [s * 0.8 for s in sizes]

source = ColumnDataSource(
    data={
        "x": x_pos,
        "y": y_pos,
        "text": words,
        "size": sizes,
        "hit_size": hit_sizes,
        "color": colors,
        "angle": angles,
        "frequency": frequencies,
        "category": categories,
    }
)

p.scatter(x="x", y="y", size="hit_size", source=source, fill_alpha=0, line_alpha=0)

hover = p.select_one(HoverTool)
hover.tooltips = [("Word", "@text"), ("Frequency", "@frequency"), ("Category", "@category")]
hover.mode = "mouse"

source.data["size"] = [f"{s}pt" for s in sizes]

labels = LabelSet(
    x="x",
    y="y",
    text="text",
    text_font_size="size",
    text_color="color",
    text_align="center",
    text_baseline="middle",
    text_font_style="bold",
    angle="angle",
    source=source,
)
p.add_layout(labels)

p.axis.visible = False
p.grid.visible = False
p.outline_line_color = None

p.title.text_font_size = "50pt"
p.title.text_color = INK
p.title.align = "center"

p.background_fill_color = PAGE_BG
p.border_fill_color = PAGE_BG

output_file(f"plot-{THEME}.html")
save(p)

W, H = canvas_width, canvas_height
opts = Options()
for arg in (
    "--headless=new",
    "--no-sandbox",
    "--disable-dev-shm-usage",
    "--disable-gpu",
    f"--window-size={W},{H}",
    "--hide-scrollbars",
):
    opts.add_argument(arg)
driver = webdriver.Chrome(options=opts)
driver.set_window_size(W, H)
driver.get(f"file://{Path(f'plot-{THEME}.html').resolve()}")
driver.execute_cdp_cmd(
    "Emulation.setDeviceMetricsOverride", {"width": W, "height": H, "deviceScaleFactor": 1, "mobile": False}
)
time.sleep(3)
driver.save_screenshot(f"plot-{THEME}.png")
driver.quit()
Runnable source as JSON, for any HTTP client: https://api.anyplot.ai/specs/wordcloud-basic/bokeh/code. Any spec id and library id listed in llms-full.txt fit the same URL shape; every URL below is complete and callable.
{
  "spec_id": "wordcloud-basic",
  "language": "python",
  "library": "bokeh",
  "page": "https://anyplot.ai/wordcloud-basic/python/bokeh",
  "hub": "https://anyplot.ai/wordcloud-basic",
  "code_json": "https://api.anyplot.ai/specs/wordcloud-basic/bokeh/code",
  "spec_json": "https://api.anyplot.ai/specs/wordcloud-basic",
  "render_light_png": "https://storage.googleapis.com/anyplot-images/plots/wordcloud-basic/python/bokeh/plot-light.png",
  "render_dark_png": "https://storage.googleapis.com/anyplot-images/plots/wordcloud-basic/python/bokeh/plot-dark.png",
  "interactive_light_html": "https://storage.googleapis.com/anyplot-images/plots/wordcloud-basic/python/bokeh/plot-light.html",
  "interactive_dark_html": "https://storage.googleapis.com/anyplot-images/plots/wordcloud-basic/python/bokeh/plot-dark.html",
  "quality_score": 93.0,
  "license": "MIT",
  "guide": "https://anyplot.ai/llms.txt"
}
Part of Basic Word Cloud on anyplot.ai.