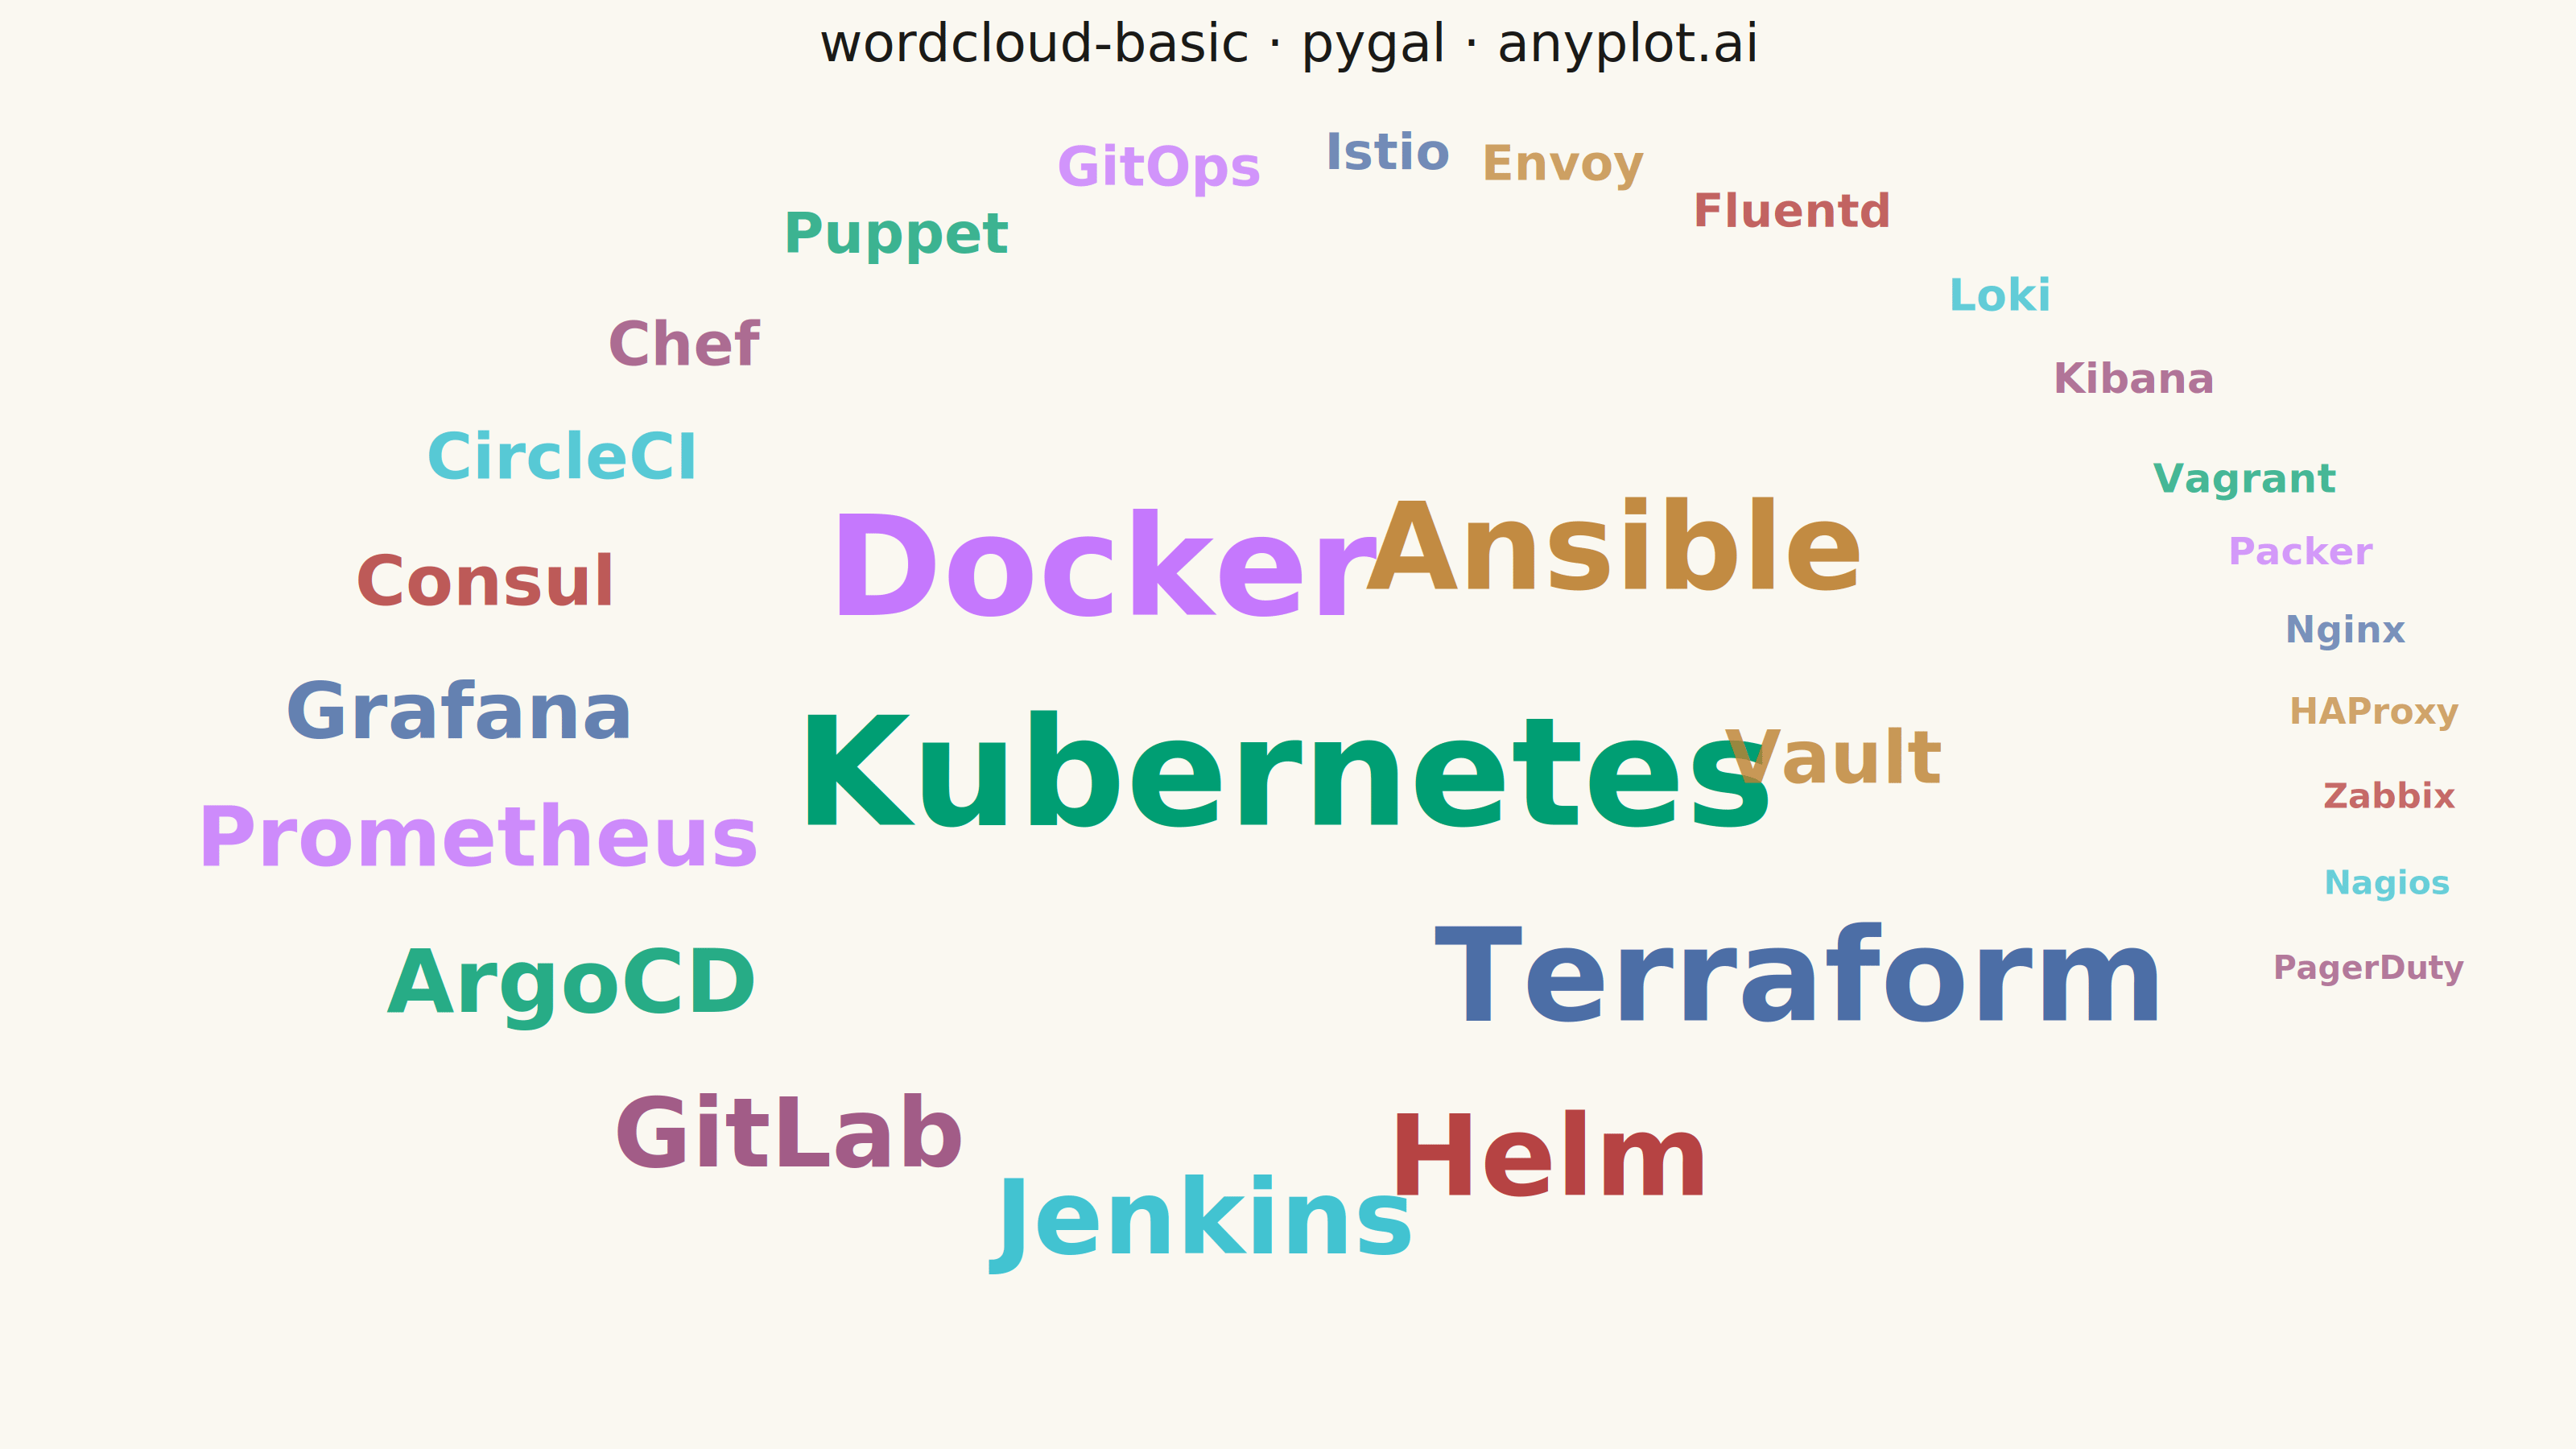
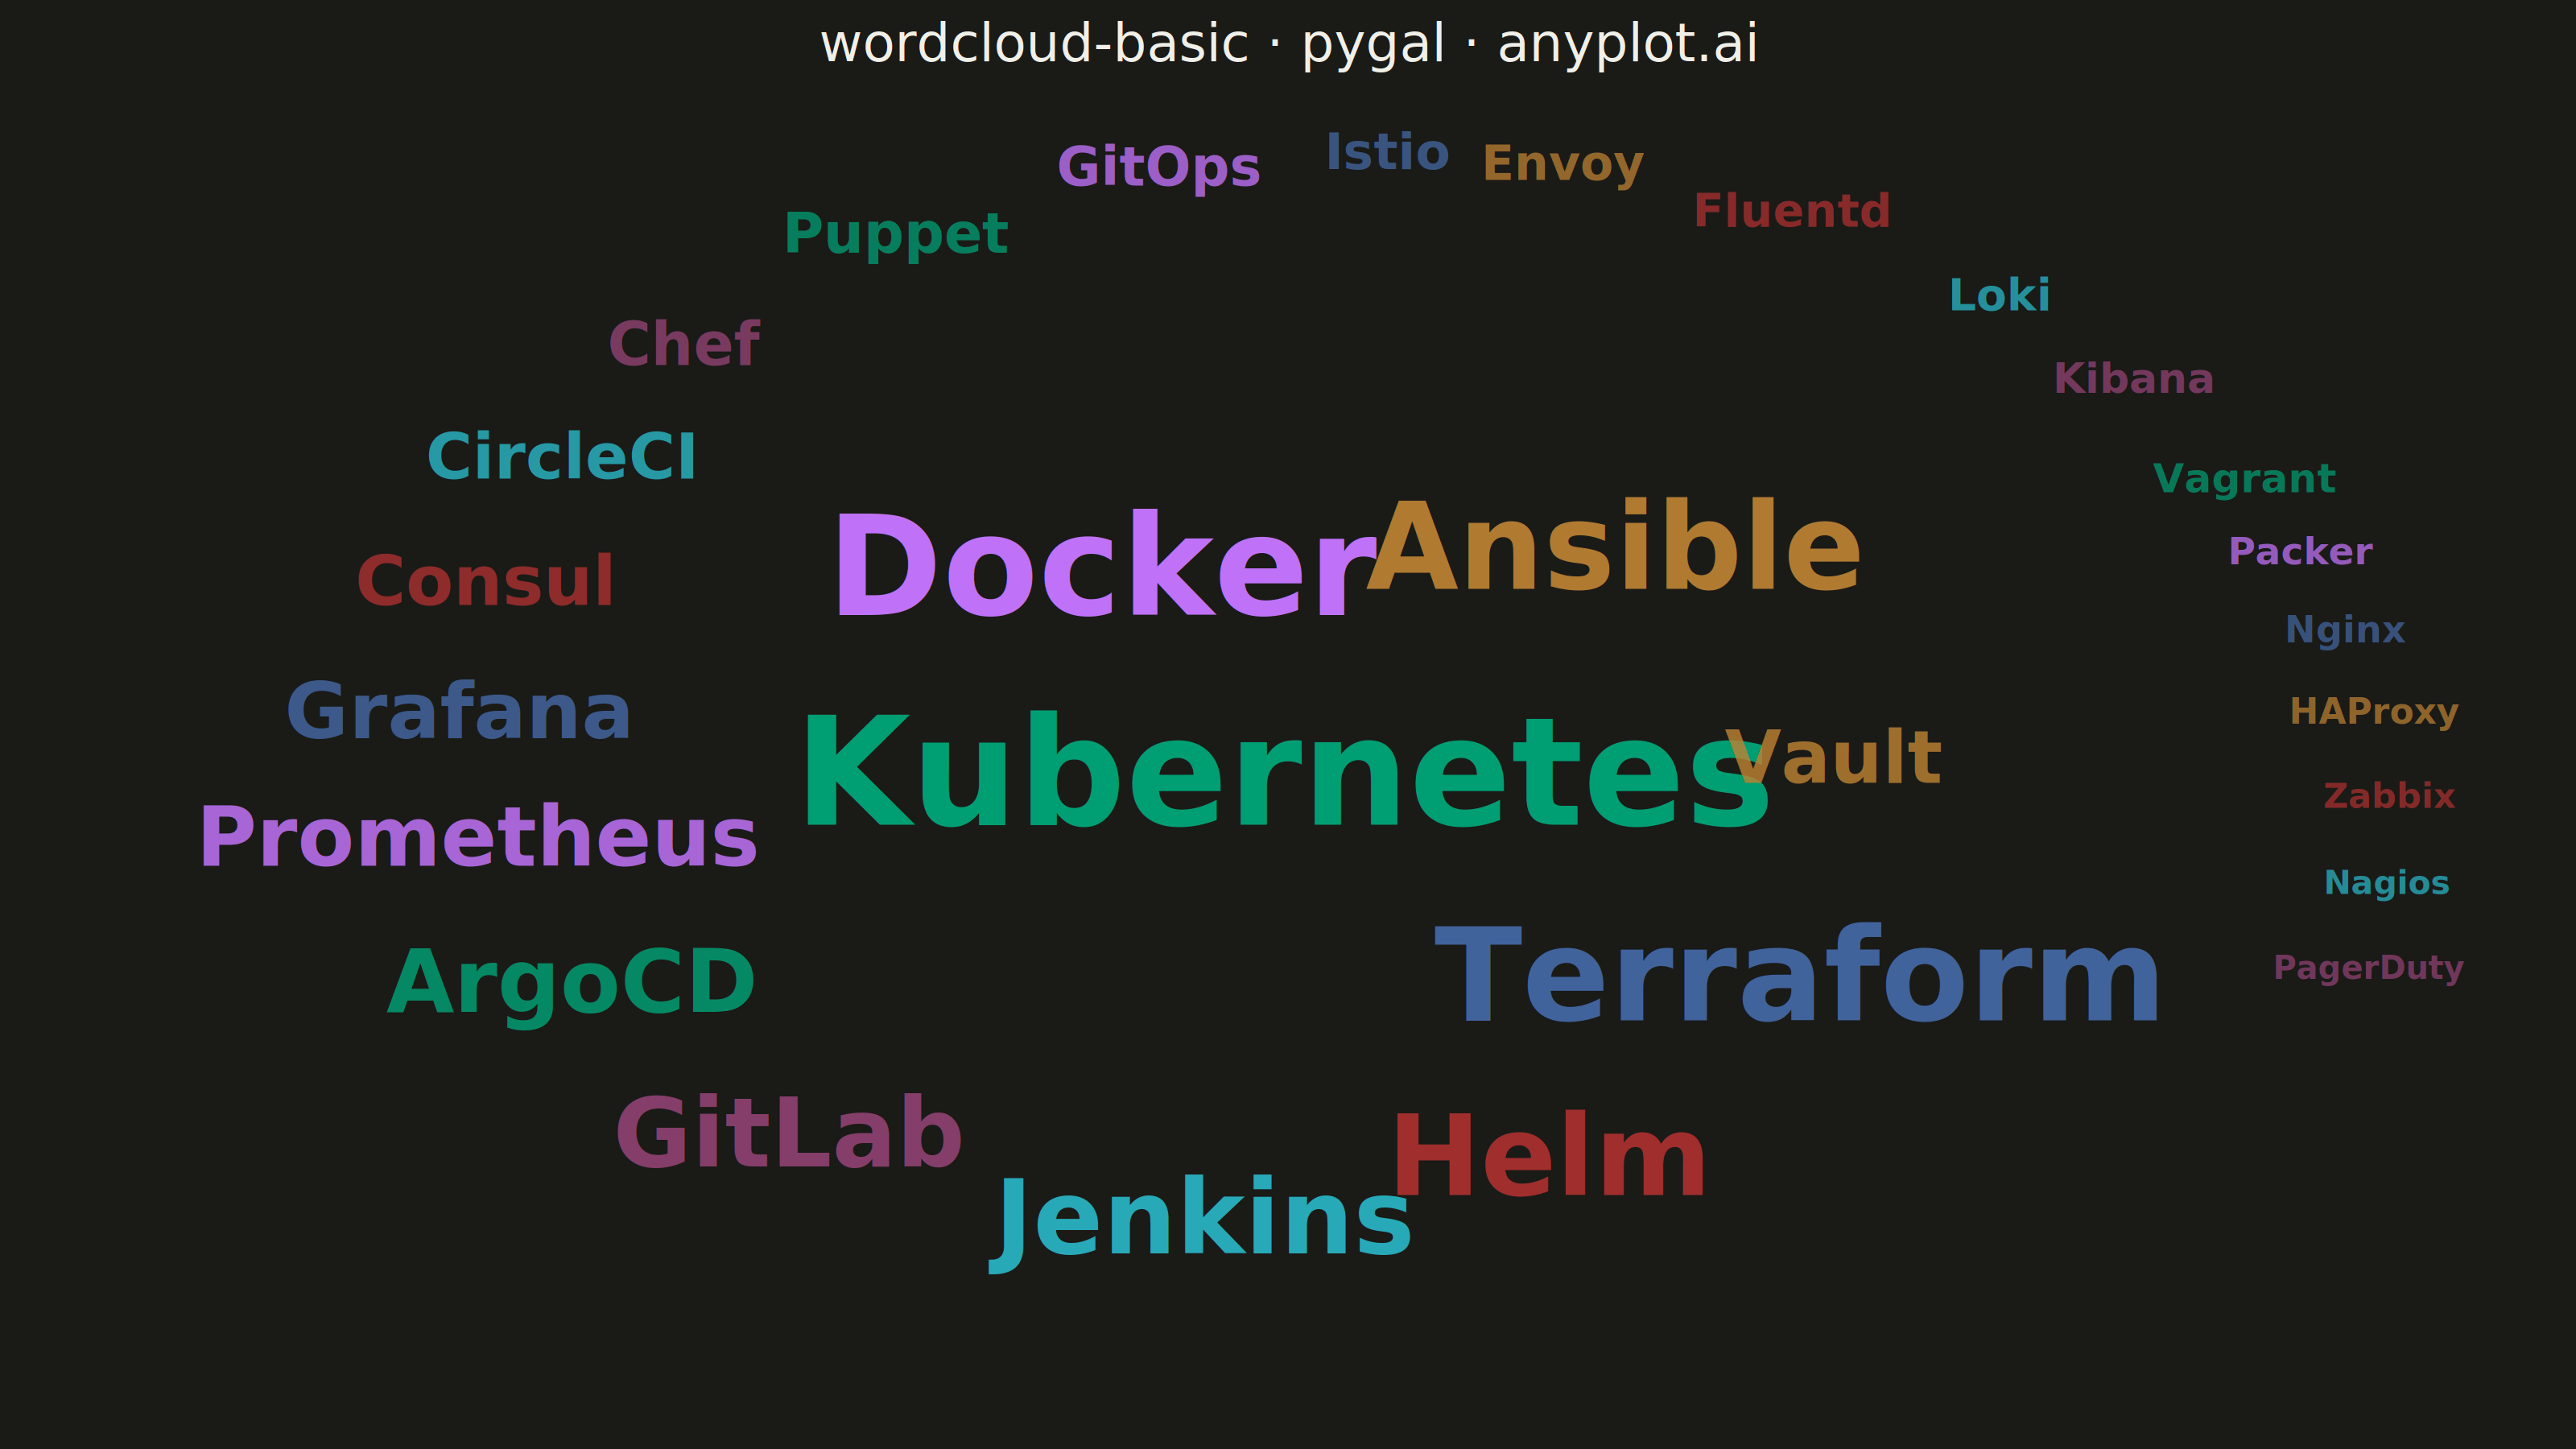
A word cloud displays text data where word size represents frequency or importance. Words are arranged to fill available space, creating a visual summary of text content that highlights prominent terms and patterns. This visualization is ideal for quickly identifying the most common themes or keywords in a body of text.
""" anyplot.ai
wordcloud-basic: Basic Word Cloud
Library: pygal 3.1.3 | Python 3.13.14
Quality: 77/100 | Updated: 2026-08-04
"""

import os
import sys
import xml.etree.ElementTree as ET


# Avoid naming conflict with pygal.py script name
# Remove current directory from path temporarily
cwd = os.getcwd()
sys.path = [p for p in sys.path if p not in ("", ".", cwd)]

import cairosvg
import numpy as np
import pygal
from pygal.style import Style


# Theme tokens
THEME = os.getenv("ANYPLOT_THEME", "light")
PAGE_BG = "#FAF8F1" if THEME == "light" else "#1A1A17"
INK = "#1A1A17" if THEME == "light" else "#F0EFE8"

# Imprint palette (first series = #009E73)
IMPRINT = ("#009E73", "#C475FD", "#4467A3", "#BD8233", "#AE3030", "#2ABCCD", "#954477", "#99B314")

# Data: DevOps tooling adoption survey - term frequencies from a platform-engineering survey
word_frequencies = {
    "Kubernetes": 195,
    "Docker": 178,
    "Terraform": 162,
    "Ansible": 148,
    "Helm": 135,
    "Jenkins": 122,
    "GitLab": 110,
    "ArgoCD": 98,
    "Prometheus": 90,
    "Grafana": 82,
    "Vault": 75,
    "Consul": 68,
    "CircleCI": 60,
    "Chef": 54,
    "Puppet": 48,
    "GitOps": 44,
    "Istio": 40,
    "Envoy": 36,
    "Fluentd": 32,
    "Loki": 29,
    "Kibana": 26,
    "Vagrant": 23,
    "Packer": 20,
    "Nginx": 18,
    "HAProxy": 16,
    "Zabbix": 14,
    "Nagios": 12,
    "PagerDuty": 10,
}

# Canvas dimensions (canonical landscape)
canvas_w = 3200
canvas_h = 1800

# Scale frequencies to font sizes
min_freq = min(word_frequencies.values())
max_freq = max(word_frequencies.values())
min_size = 50
max_size = 187

# Sort by frequency (largest first for better placement)
sorted_words = sorted(word_frequencies.items(), key=lambda x: x[1], reverse=True)
n_words = len(sorted_words)

# Build word positions using spiral algorithm; opacity tiers by frequency add a
# secondary depth cue beyond size alone (top tier fully opaque, tail eases back)
word_data = []
placed_boxes = []

for i, (word, freq) in enumerate(sorted_words):
    # Scale frequency to font size
    size = int(min_size + (freq - min_freq) / (max_freq - min_freq) * (max_size - min_size))
    opacity = round(0.7 + 0.3 * (freq - min_freq) / (max_freq - min_freq), 2)

    # Estimate dimensions (generous width factor so bold glyphs keep a visible gap)
    w = len(word) * size * 0.62
    h = size * 1.2

    # Spiral placement - centered with balanced distribution, biased below the title band
    cx, cy = canvas_w / 2, canvas_h / 2 + 60

    # Ellipse ratio narrows from wide (matches the 16:9 canvas for early, large
    # words) toward near-circular for the tail, so late/small words reach the
    # top-right/bottom-right voids instead of stacking against the horizontal bound
    progress = i / max(n_words - 1, 1)
    ellipse_x = 2.8 - 1.2 * progress
    ellipse_y = 1.8 - 0.2 * progress

    # Stagger each word's starting angle by the golden angle so consecutive
    # spirals fan out in different directions instead of retracing the same
    # path and piling into whichever gap opens first along it
    angle = i * 2.399963
    radius = 0
    x, y = cx, cy
    box = (cx - w / 2, cy - h / 2, w, h)

    for _ in range(50000):
        # Elliptical spiral
        test_x = cx + radius * ellipse_x * np.cos(angle) - w / 2
        test_y = cy + radius * ellipse_y * np.sin(angle) - h / 2

        # Check bounds with margins for title and edges
        if 67 < test_x < canvas_w - w - 67 and 150 < test_y < canvas_h - h - 67:
            test_box = (test_x, test_y, w, h)
            # Check for overlap with placed words
            overlap = False
            for pb in placed_boxes:
                x1, y1, w1, h1 = test_box
                x2, y2, w2, h2 = pb
                padding = 40  # Padding to prevent clustering / guarantee a visible gap
                if not (
                    x1 + w1 + padding < x2 or x2 + w2 + padding < x1 or y1 + h1 + padding < y2 or y2 + h2 + padding < y1
                ):
                    overlap = True
                    break
            if not overlap:
                x = test_x + w / 2
                y = test_y + h / 2
                box = test_box
                break

        angle += 0.06  # Slower angle progression for better spacing
        radius += 2.33  # Moderate radius growth

    placed_boxes.append(box)
    word_data.append(
        {"word": word, "x": x, "y": y, "size": size, "opacity": opacity, "color": IMPRINT[i % len(IMPRINT)]}
    )

# Recenter the whole cloud within the safe canvas area: the spiral settles
# wherever overlap checks first succeed, which tends to drift the bounding
# box off-center (e.g. a large left-side void with words crowded right).
# Shifting every word by the same offset preserves all relative spacing and
# the zero-overlap guarantee while balancing the leftover whitespace.
safe_left, safe_right = 67, canvas_w - 67
safe_top, safe_bottom = 150, canvas_h - 67
box_min_x = min(b[0] for b in placed_boxes)
box_max_x = max(b[0] + b[2] for b in placed_boxes)
box_min_y = min(b[1] for b in placed_boxes)
box_max_y = max(b[1] + b[3] for b in placed_boxes)
shift_x = (safe_left + safe_right) / 2 - (box_min_x + box_max_x) / 2
shift_y = (safe_top + safe_bottom) / 2 - (box_min_y + box_max_y) / 2
for item in word_data:
    item["x"] += shift_x
    item["y"] += shift_y

# Minimal pygal chart as canvas, using pygal's own title rendering (idiomatic
# high-level API) instead of hand-drawn SVG text; only the word placement below
# needs manual SVG injection since pygal has no word-cloud primitive.
custom_style = Style(
    background=PAGE_BG,
    plot_background=PAGE_BG,
    foreground=INK,
    foreground_strong=INK,
    title_font_size=66,
    title_font_family="sans-serif",  # match the bold sans-serif word text below
)

chart = pygal.XY(
    style=custom_style,
    width=canvas_w,
    height=canvas_h,
    title="wordcloud-basic · pygal · anyplot.ai",
    show_legend=False,
    show_x_labels=False,
    show_y_labels=False,
    show_x_guides=False,
    show_y_guides=False,
    show_dots=False,
    stroke=False,
    margin=0,
)

# Add dummy data (required for chart to render)
chart.add("", [(0, 0)])

# Render SVG and manually inject the word cloud text elements (no pygal
# primitive exists for freeform-positioned, variably-sized text)
svg_string = chart.render(is_unicode=True)
root = ET.fromstring(svg_string)

for item in word_data:
    text_elem = ET.SubElement(root, "text")
    text_elem.set("x", str(int(item["x"])))
    text_elem.set("y", str(int(item["y"])))
    text_elem.set("font-size", str(item["size"]))
    text_elem.set("font-weight", "bold")
    text_elem.set("fill", item["color"])
    text_elem.set("fill-opacity", str(item["opacity"]))
    text_elem.set("text-anchor", "middle")
    text_elem.set("dominant-baseline", "middle")
    text_elem.set("font-family", "sans-serif")
    text_elem.text = item["word"]

# Write modified SVG
modified_svg = ET.tostring(root, encoding="unicode")
with open(f"plot-{THEME}.svg", "w") as f:
    f.write(modified_svg)

# Render PNG using cairosvg
cairosvg.svg2png(bytestring=modified_svg.encode(), write_to=f"plot-{THEME}.png")

# Save as HTML for interactive viewing
with open(f"plot-{THEME}.html", "w") as f:
    f.write(
        f"""<!DOCTYPE html>
<html>
<head>
    <title>wordcloud-basic · pygal · anyplot.ai</title>
    <style>
        body {{ margin: 0; display: flex; justify-content: center; align-items: center; min-height: 100vh; background: {PAGE_BG}; }}
        svg {{ max-width: 100%; height: auto; }}
    </style>
</head>
<body>
{modified_svg}
</body>
</html>"""
    )
Runnable source as JSON, for any HTTP client: https://api.anyplot.ai/specs/wordcloud-basic/pygal/code. Any spec id and library id listed in llms-full.txt fit the same URL shape; every URL below is complete and callable.
{
  "spec_id": "wordcloud-basic",
  "language": "python",
  "library": "pygal",
  "page": "https://anyplot.ai/wordcloud-basic/python/pygal",
  "hub": "https://anyplot.ai/wordcloud-basic",
  "code_json": "https://api.anyplot.ai/specs/wordcloud-basic/pygal/code",
  "spec_json": "https://api.anyplot.ai/specs/wordcloud-basic",
  "render_light_png": "https://storage.googleapis.com/anyplot-images/plots/wordcloud-basic/python/pygal/plot-light.png",
  "render_dark_png": "https://storage.googleapis.com/anyplot-images/plots/wordcloud-basic/python/pygal/plot-dark.png",
  "interactive_light_html": "https://storage.googleapis.com/anyplot-images/plots/wordcloud-basic/python/pygal/plot-light.html",
  "interactive_dark_html": "https://storage.googleapis.com/anyplot-images/plots/wordcloud-basic/python/pygal/plot-dark.html",
  "quality_score": 77.0,
  "license": "MIT",
  "guide": "https://anyplot.ai/llms.txt"
}
Part of Basic Word Cloud on anyplot.ai.