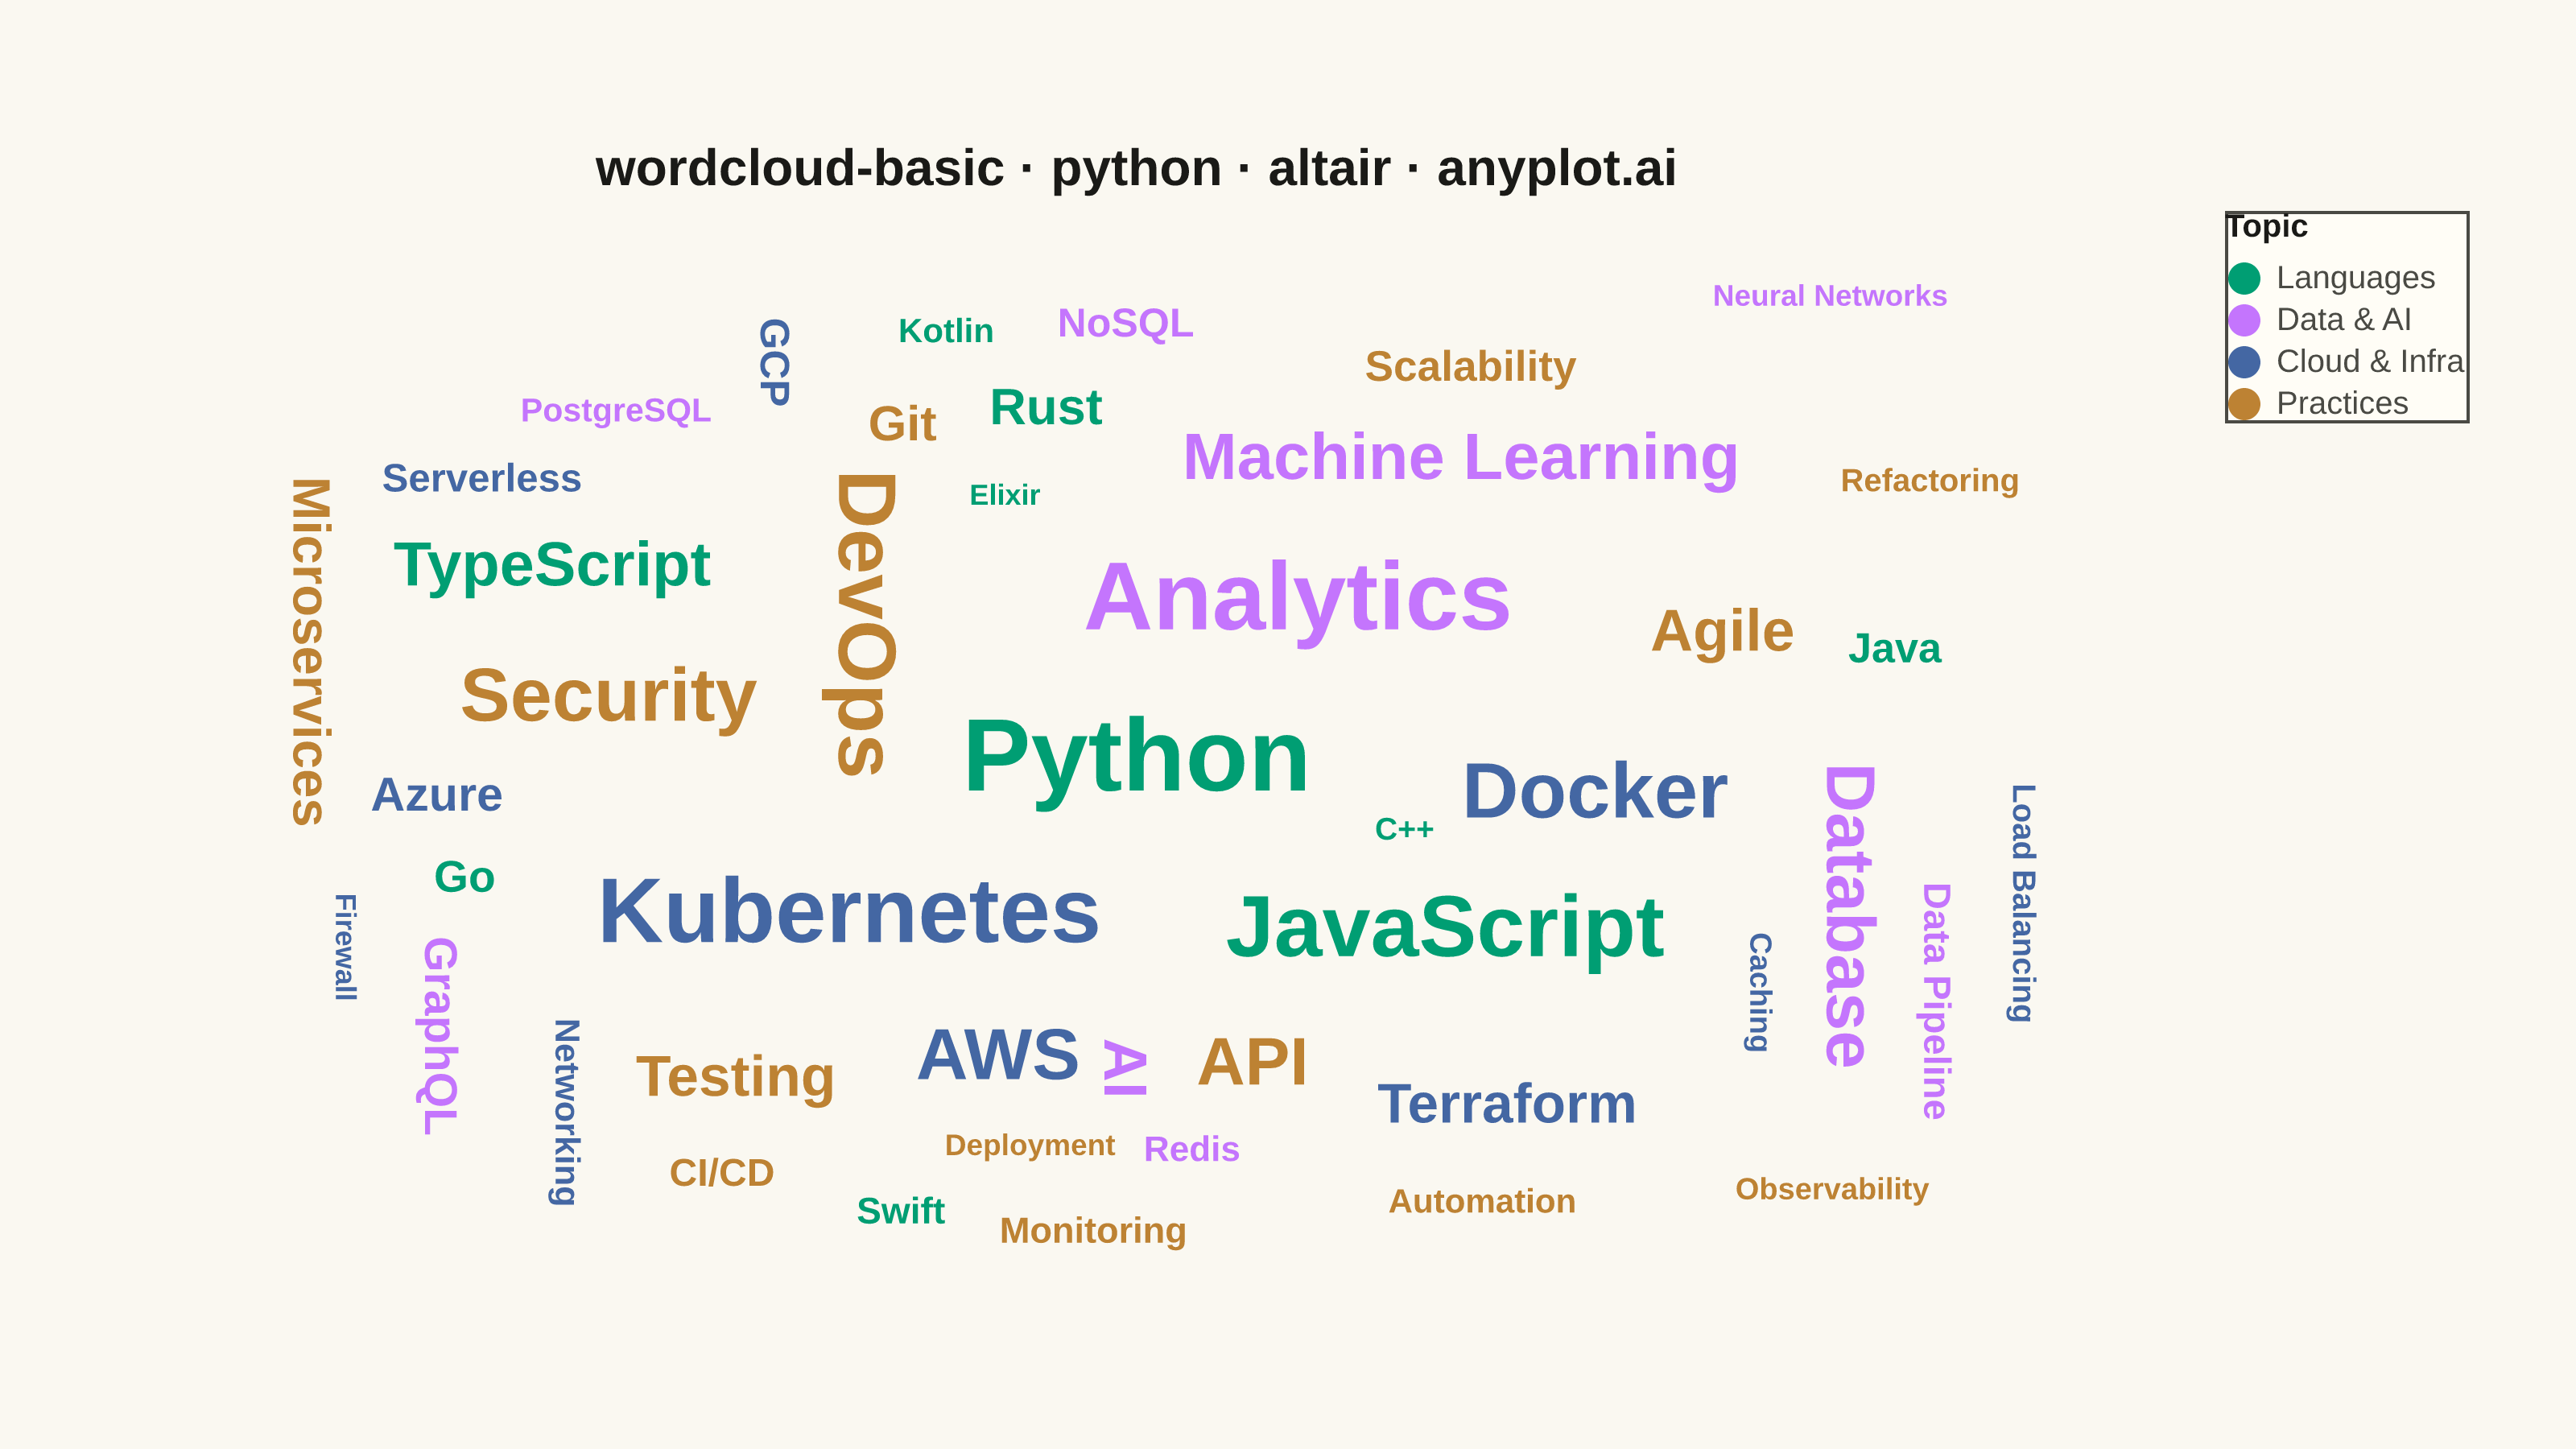
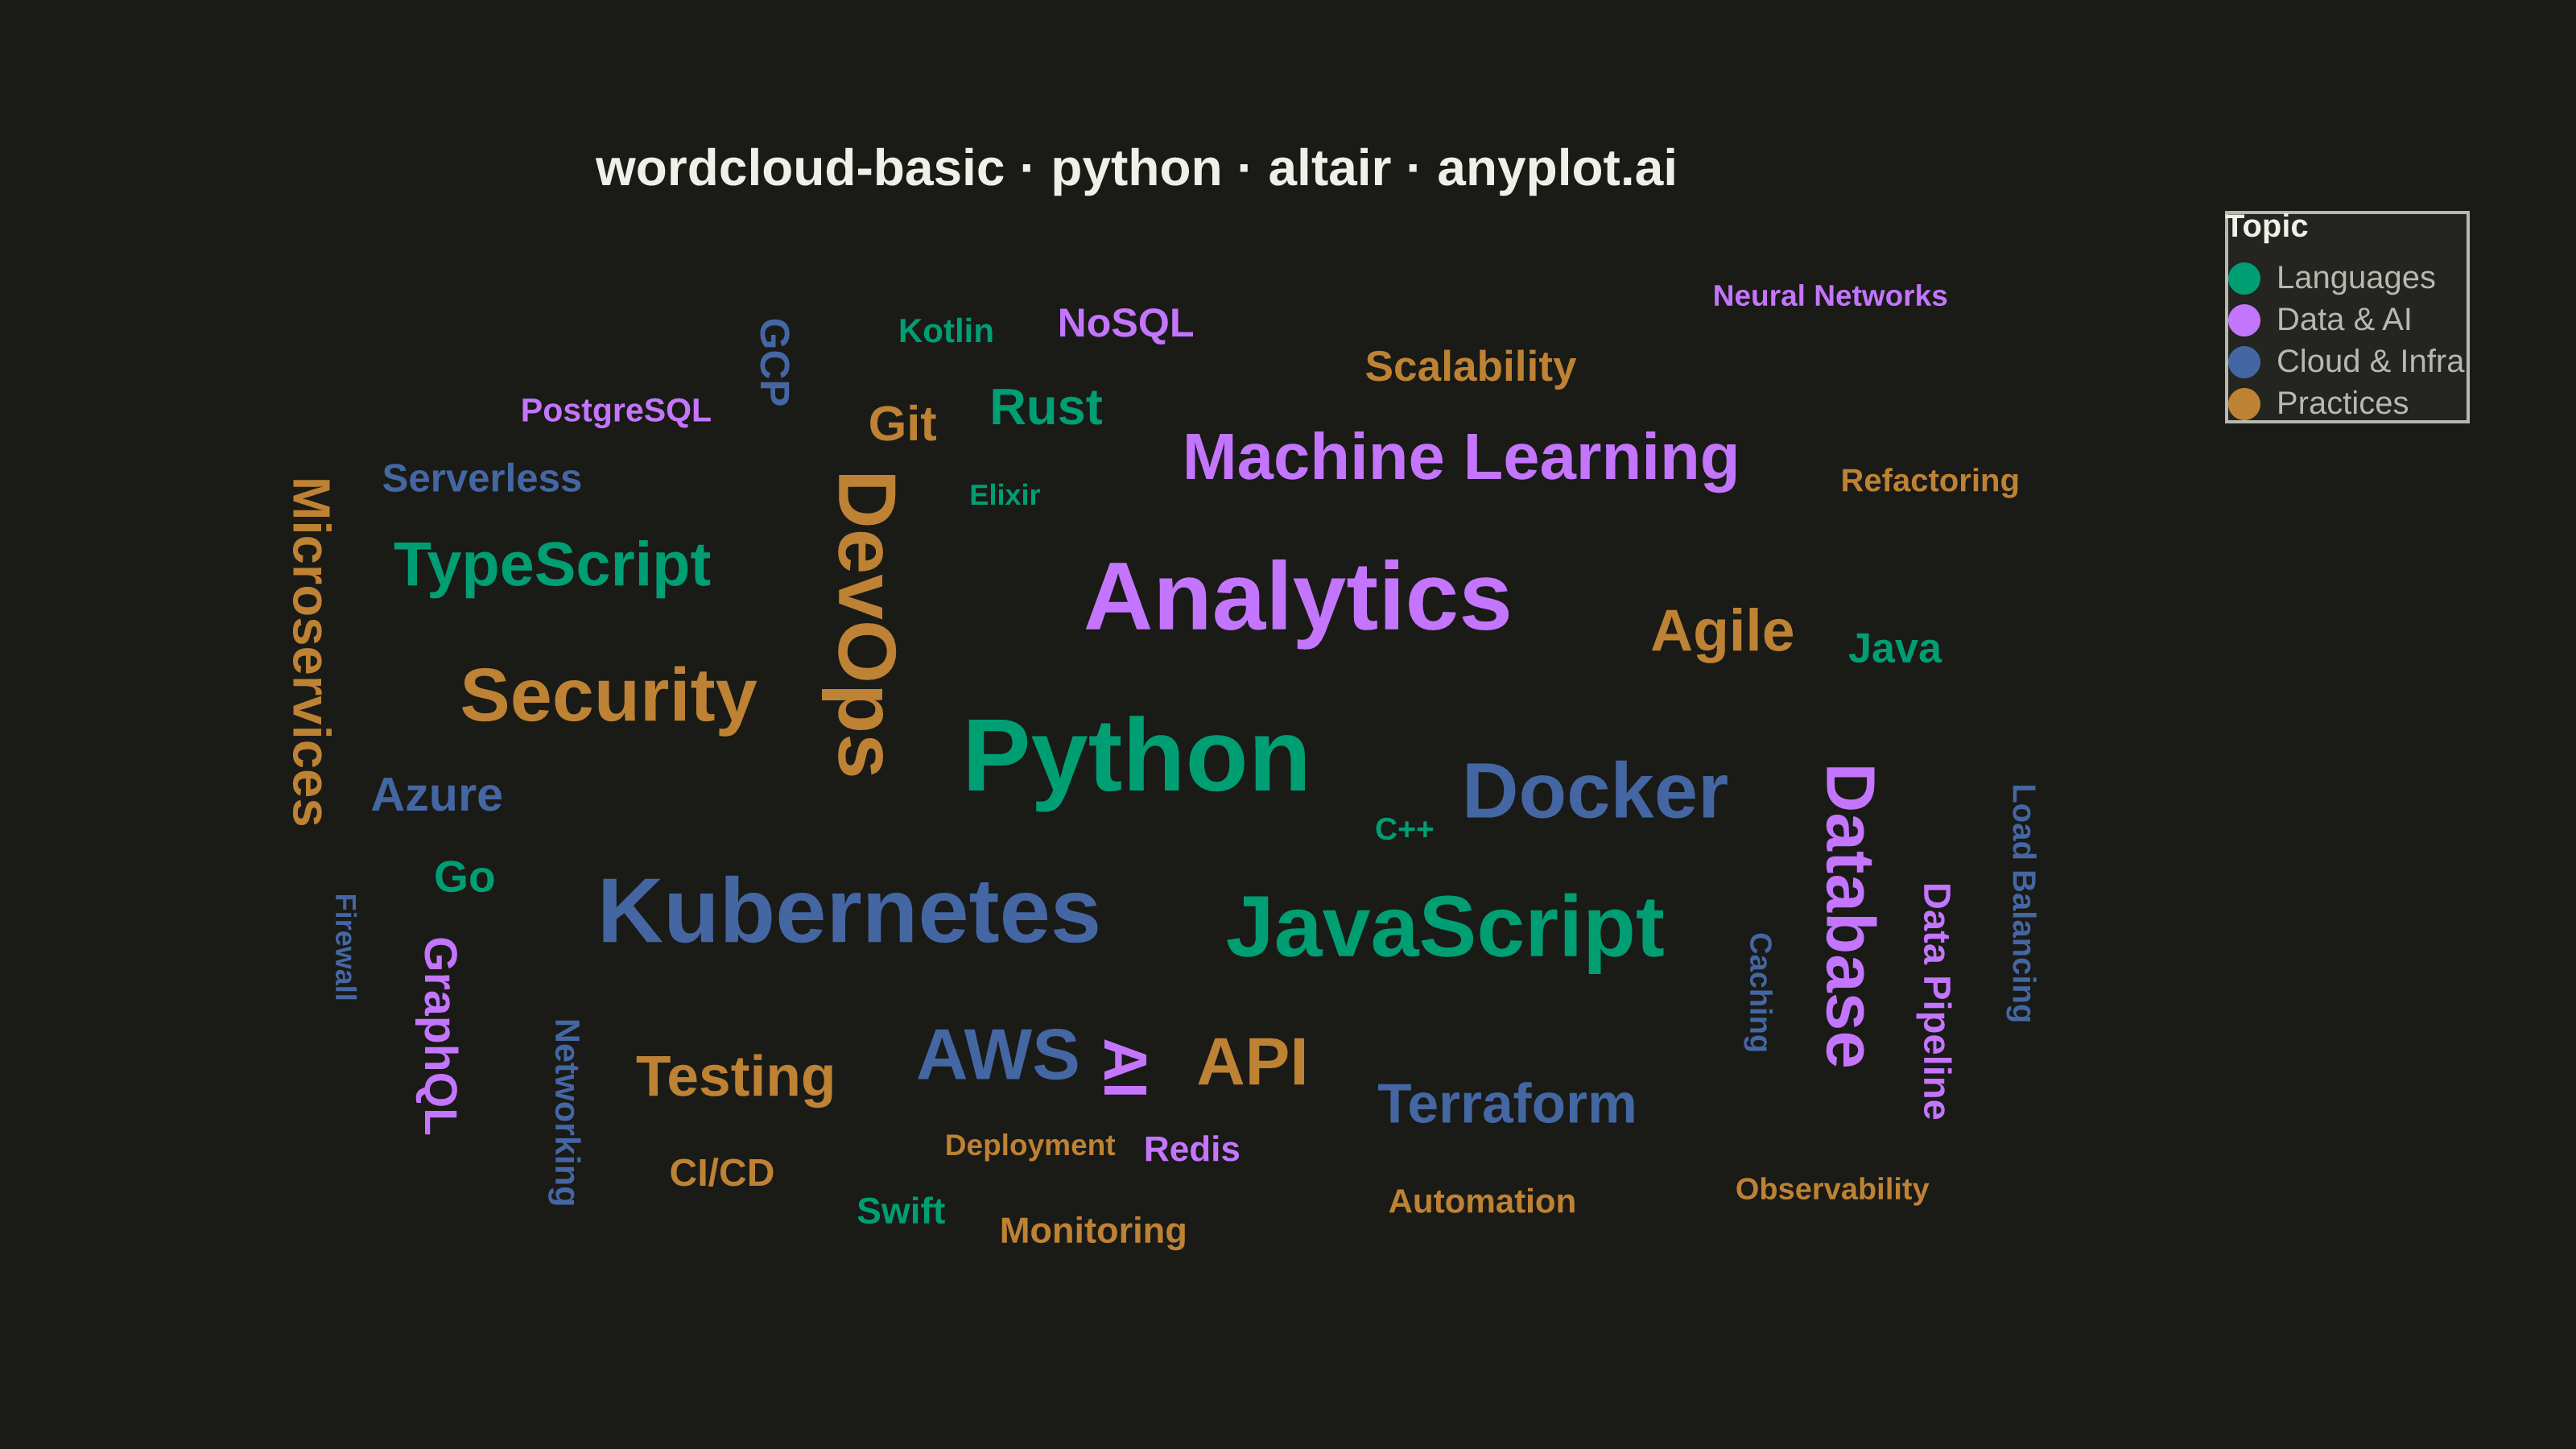
A word cloud displays text data where word size represents frequency or importance. Words are arranged to fill available space, creating a visual summary of text content that highlights prominent terms and patterns. This visualization is ideal for quickly identifying the most common themes or keywords in a body of text.
""" anyplot.ai
wordcloud-basic: Basic Word Cloud
Library: altair 6.2.2 | Python 3.13.14
Quality: 85/100 | Updated: 2026-08-04
"""

import os
import sys


# Prevent local file from shadowing the altair package
script_dir = os.path.dirname(os.path.abspath(__file__)) if __file__ else os.getcwd()
if script_dir in sys.path:
    sys.path.remove(script_dir)

import altair as alt
import numpy as np
import pandas as pd
from PIL import Image


# Theme tokens (see prompts/default-style-guide.md "Background" + "Theme-adaptive Chrome")
THEME = os.getenv("ANYPLOT_THEME", "light")
PAGE_BG = "#FAF8F1" if THEME == "light" else "#1A1A17"
ELEVATED_BG = "#FFFDF6" if THEME == "light" else "#242420"
INK = "#1A1A17" if THEME == "light" else "#F0EFE8"
INK_SOFT = "#4A4A44" if THEME == "light" else "#B8B7B0"

# Imprint palette — color encodes topic, not ordinal position (see style guide)
CATEGORY_COLORS = {"Languages": "#009E73", "Data & AI": "#C475FD", "Cloud & Infra": "#4467A3", "Practices": "#BD8233"}

# Data: terms mined from developer conference talk titles, grouped by topic
word_data = [
    ("Python", 100, "Languages"),
    ("Analytics", 92, "Data & AI"),
    ("Kubernetes", 86, "Cloud & Infra"),
    ("JavaScript", 80, "Languages"),
    ("DevOps", 74, "Practices"),
    ("Docker", 70, "Cloud & Infra"),
    ("Security", 66, "Practices"),
    ("AWS", 62, "Cloud & Infra"),
    ("Database", 58, "Data & AI"),
    ("API", 56, "Practices"),
    ("Machine Learning", 54, "Data & AI"),
    ("TypeScript", 50, "Languages"),
    ("AI", 48, "Data & AI"),
    ("Agile", 46, "Practices"),
    ("Testing", 44, "Practices"),
    ("Terraform", 42, "Cloud & Infra"),
    ("Microservices", 38, "Practices"),
    ("Rust", 36, "Languages"),
    ("Git", 34, "Practices"),
    ("Azure", 32, "Cloud & Infra"),
    ("GraphQL", 30, "Data & AI"),
    ("Go", 28, "Languages"),
    ("Scalability", 26, "Practices"),
    ("Java", 25, "Languages"),
    ("GCP", 24, "Cloud & Infra"),
    ("NoSQL", 23, "Data & AI"),
    ("Serverless", 22, "Cloud & Infra"),
    ("CI/CD", 21, "Practices"),
    ("Data Pipeline", 20, "Data & AI"),
    ("Swift", 19, "Languages"),
    ("Monitoring", 18, "Practices"),
    ("Redis", 17, "Data & AI"),
    ("Networking", 16, "Cloud & Infra"),
    ("Kotlin", 15, "Languages"),
    ("Automation", 15, "Practices"),
    ("PostgreSQL", 14, "Data & AI"),
    ("Load Balancing", 13, "Cloud & Infra"),
    ("Refactoring", 13, "Practices"),
    ("C++", 12, "Languages"),
    ("Observability", 11, "Practices"),
    ("Caching", 11, "Cloud & Infra"),
    ("Neural Networks", 10, "Data & AI"),
    ("Deployment", 10, "Practices"),
    ("Elixir", 9, "Languages"),
    ("Firewall", 9, "Cloud & Infra"),
]

# Canvas — altair inner-view dims tuned within the library prompt's ±20px
# allowance to leave more spiral-packing room (prompts/library/altair.md "Canvas")
canvas_w = 640
canvas_h = 340

# Scale frequencies to font sizes
frequencies = [freq for _, freq, _ in word_data]
min_freq, max_freq = min(frequencies), max(frequencies)
min_size, max_size = 9, 32

# Build data with spiral positioning; a handful of lower-frequency words
# rotate 90° (a classic word-cloud technique) to fill the vertical gaps a
# purely horizontal layout leaves behind
words_list = []
x_positions = []
y_positions = []
font_sizes = []
categories = []
angles = []
placed_boxes = []

sorted_words = sorted(word_data, key=lambda w: w[1], reverse=True)
aspect = canvas_w / canvas_h

for i, (word, freq, category) in enumerate(sorted_words):
    size = min_size + (freq - min_freq) / (max_freq - min_freq) * (max_size - min_size)
    rotate = i >= 3 and i % 4 == 0
    angle = 90 if rotate else 0

    text_w = len(word) * size * 0.6
    text_h = size * 1.3
    box_w, box_h = (text_h, text_w) if rotate else (text_w, text_h)
    padding = 6

    cx, cy = canvas_w / 2, canvas_h / 2
    theta = 0.0
    radius = 0.0
    found_x, found_y = cx, cy
    found_box = (cx - box_w / 2, cy - box_h / 2, box_w, box_h)

    for _ in range(8000):
        # Elliptical spiral matching the inner-view aspect ratio
        x = cx + radius * aspect * np.cos(theta) - box_w / 2
        y = cy + radius * np.sin(theta) - box_h / 2

        if 15 < x < canvas_w - box_w - 15 and 15 < y < canvas_h - box_h - 15:
            box = (x, y, box_w, box_h)

            has_overlap = False
            for px, py, pw, ph in placed_boxes:
                if not (
                    x + box_w + padding < px
                    or px + pw + padding < x
                    or y + box_h + padding < py
                    or py + ph + padding < y
                ):
                    has_overlap = True
                    break

            if not has_overlap:
                found_x = x + box_w / 2
                found_y = y + box_h / 2
                found_box = box
                break

        theta += 0.22
        radius += 0.9

    placed_boxes.append(found_box)
    words_list.append(word)
    x_positions.append(found_x)
    y_positions.append(found_y)
    font_sizes.append(size)
    categories.append(category)
    angles.append(angle)

# Assemble data
df = pd.DataFrame(
    {
        "word": words_list,
        "x": x_positions,
        "y": y_positions,
        "size": font_sizes,
        "category": categories,
        "angle": angles,
    }
)
category_order = list(CATEGORY_COLORS.keys())
category_range = list(CATEGORY_COLORS.values())

# Title — mandated format, fontsize scaled off the 67-char baseline
title_text = "wordcloud-basic · python · altair · anyplot.ai"
title_ratio = 67 / len(title_text) if len(title_text) > 67 else 1.0
title_fontsize = max(11, round(16 * title_ratio))

# Chart — text marks sized by frequency, colored by topic, some rotated
chart = (
    alt.Chart(df)
    .mark_text(fontWeight="bold", align="center", baseline="middle")
    .encode(
        x=alt.X("x:Q", scale=alt.Scale(domain=[0, canvas_w]), axis=None),
        y=alt.Y("y:Q", scale=alt.Scale(domain=[0, canvas_h]), axis=None),
        text="word:N",
        size=alt.Size("size:Q", scale=None, legend=None),
        angle=alt.Angle("angle:Q", scale=None),
        color=alt.Color(
            "category:N", scale=alt.Scale(domain=category_order, range=category_range), legend=alt.Legend(title="Topic")
        ),
        tooltip=["word:N", "category:N", alt.Tooltip("size:Q", title="Font size (freq-scaled)")],
    )
    .properties(
        width=canvas_w,
        height=canvas_h,
        padding={"left": 0, "right": 0, "top": 0, "bottom": 0},
        background=PAGE_BG,
        title=alt.Title(title_text, fontSize=title_fontsize, anchor="middle", color=INK),
    )
    .configure_view(fill=PAGE_BG, strokeWidth=0, continuousWidth=canvas_w, continuousHeight=canvas_h)
    .configure_title(color=INK)
    .configure_legend(
        fillColor=ELEVATED_BG,
        strokeColor=INK_SOFT,
        labelColor=INK_SOFT,
        titleColor=INK,
        labelFontSize=10,
        titleFontSize=10,
    )
)

# Save — pad (never crop) up to the exact canonical target (prompts/library/altair.md "Canvas")
chart.save(f"plot-{THEME}.png", scale_factor=4.0)

TARGET_W, TARGET_H = 3200, 1800
img = Image.open(f"plot-{THEME}.png").convert("RGB")
w, h = img.size
if w > TARGET_W or h > TARGET_H:
    raise SystemExit(
        f"altair vl-convert produced {w}x{h}, exceeds target {TARGET_W}x{TARGET_H}. "
        f"Shrink chart .properties(width=, height=) values and re-render."
    )
if w < TARGET_W or h < TARGET_H:
    canvas = Image.new("RGB", (TARGET_W, TARGET_H), PAGE_BG)
    canvas.paste(img, ((TARGET_W - w) // 2, (TARGET_H - h) // 2))
    canvas.save(f"plot-{THEME}.png")

chart.save(f"plot-{THEME}.html")
Runnable source as JSON, for any HTTP client: https://api.anyplot.ai/specs/wordcloud-basic/altair/code. Any spec id and library id listed in llms-full.txt fit the same URL shape; every URL below is complete and callable.
{
  "spec_id": "wordcloud-basic",
  "language": "python",
  "library": "altair",
  "page": "https://anyplot.ai/wordcloud-basic/python/altair",
  "hub": "https://anyplot.ai/wordcloud-basic",
  "code_json": "https://api.anyplot.ai/specs/wordcloud-basic/altair/code",
  "spec_json": "https://api.anyplot.ai/specs/wordcloud-basic",
  "render_light_png": "https://storage.googleapis.com/anyplot-images/plots/wordcloud-basic/python/altair/plot-light.png",
  "render_dark_png": "https://storage.googleapis.com/anyplot-images/plots/wordcloud-basic/python/altair/plot-dark.png",
  "interactive_light_html": "https://storage.googleapis.com/anyplot-images/plots/wordcloud-basic/python/altair/plot-light.html",
  "interactive_dark_html": "https://storage.googleapis.com/anyplot-images/plots/wordcloud-basic/python/altair/plot-dark.html",
  "quality_score": 85.0,
  "license": "MIT",
  "guide": "https://anyplot.ai/llms.txt"
}
Part of Basic Word Cloud on anyplot.ai.