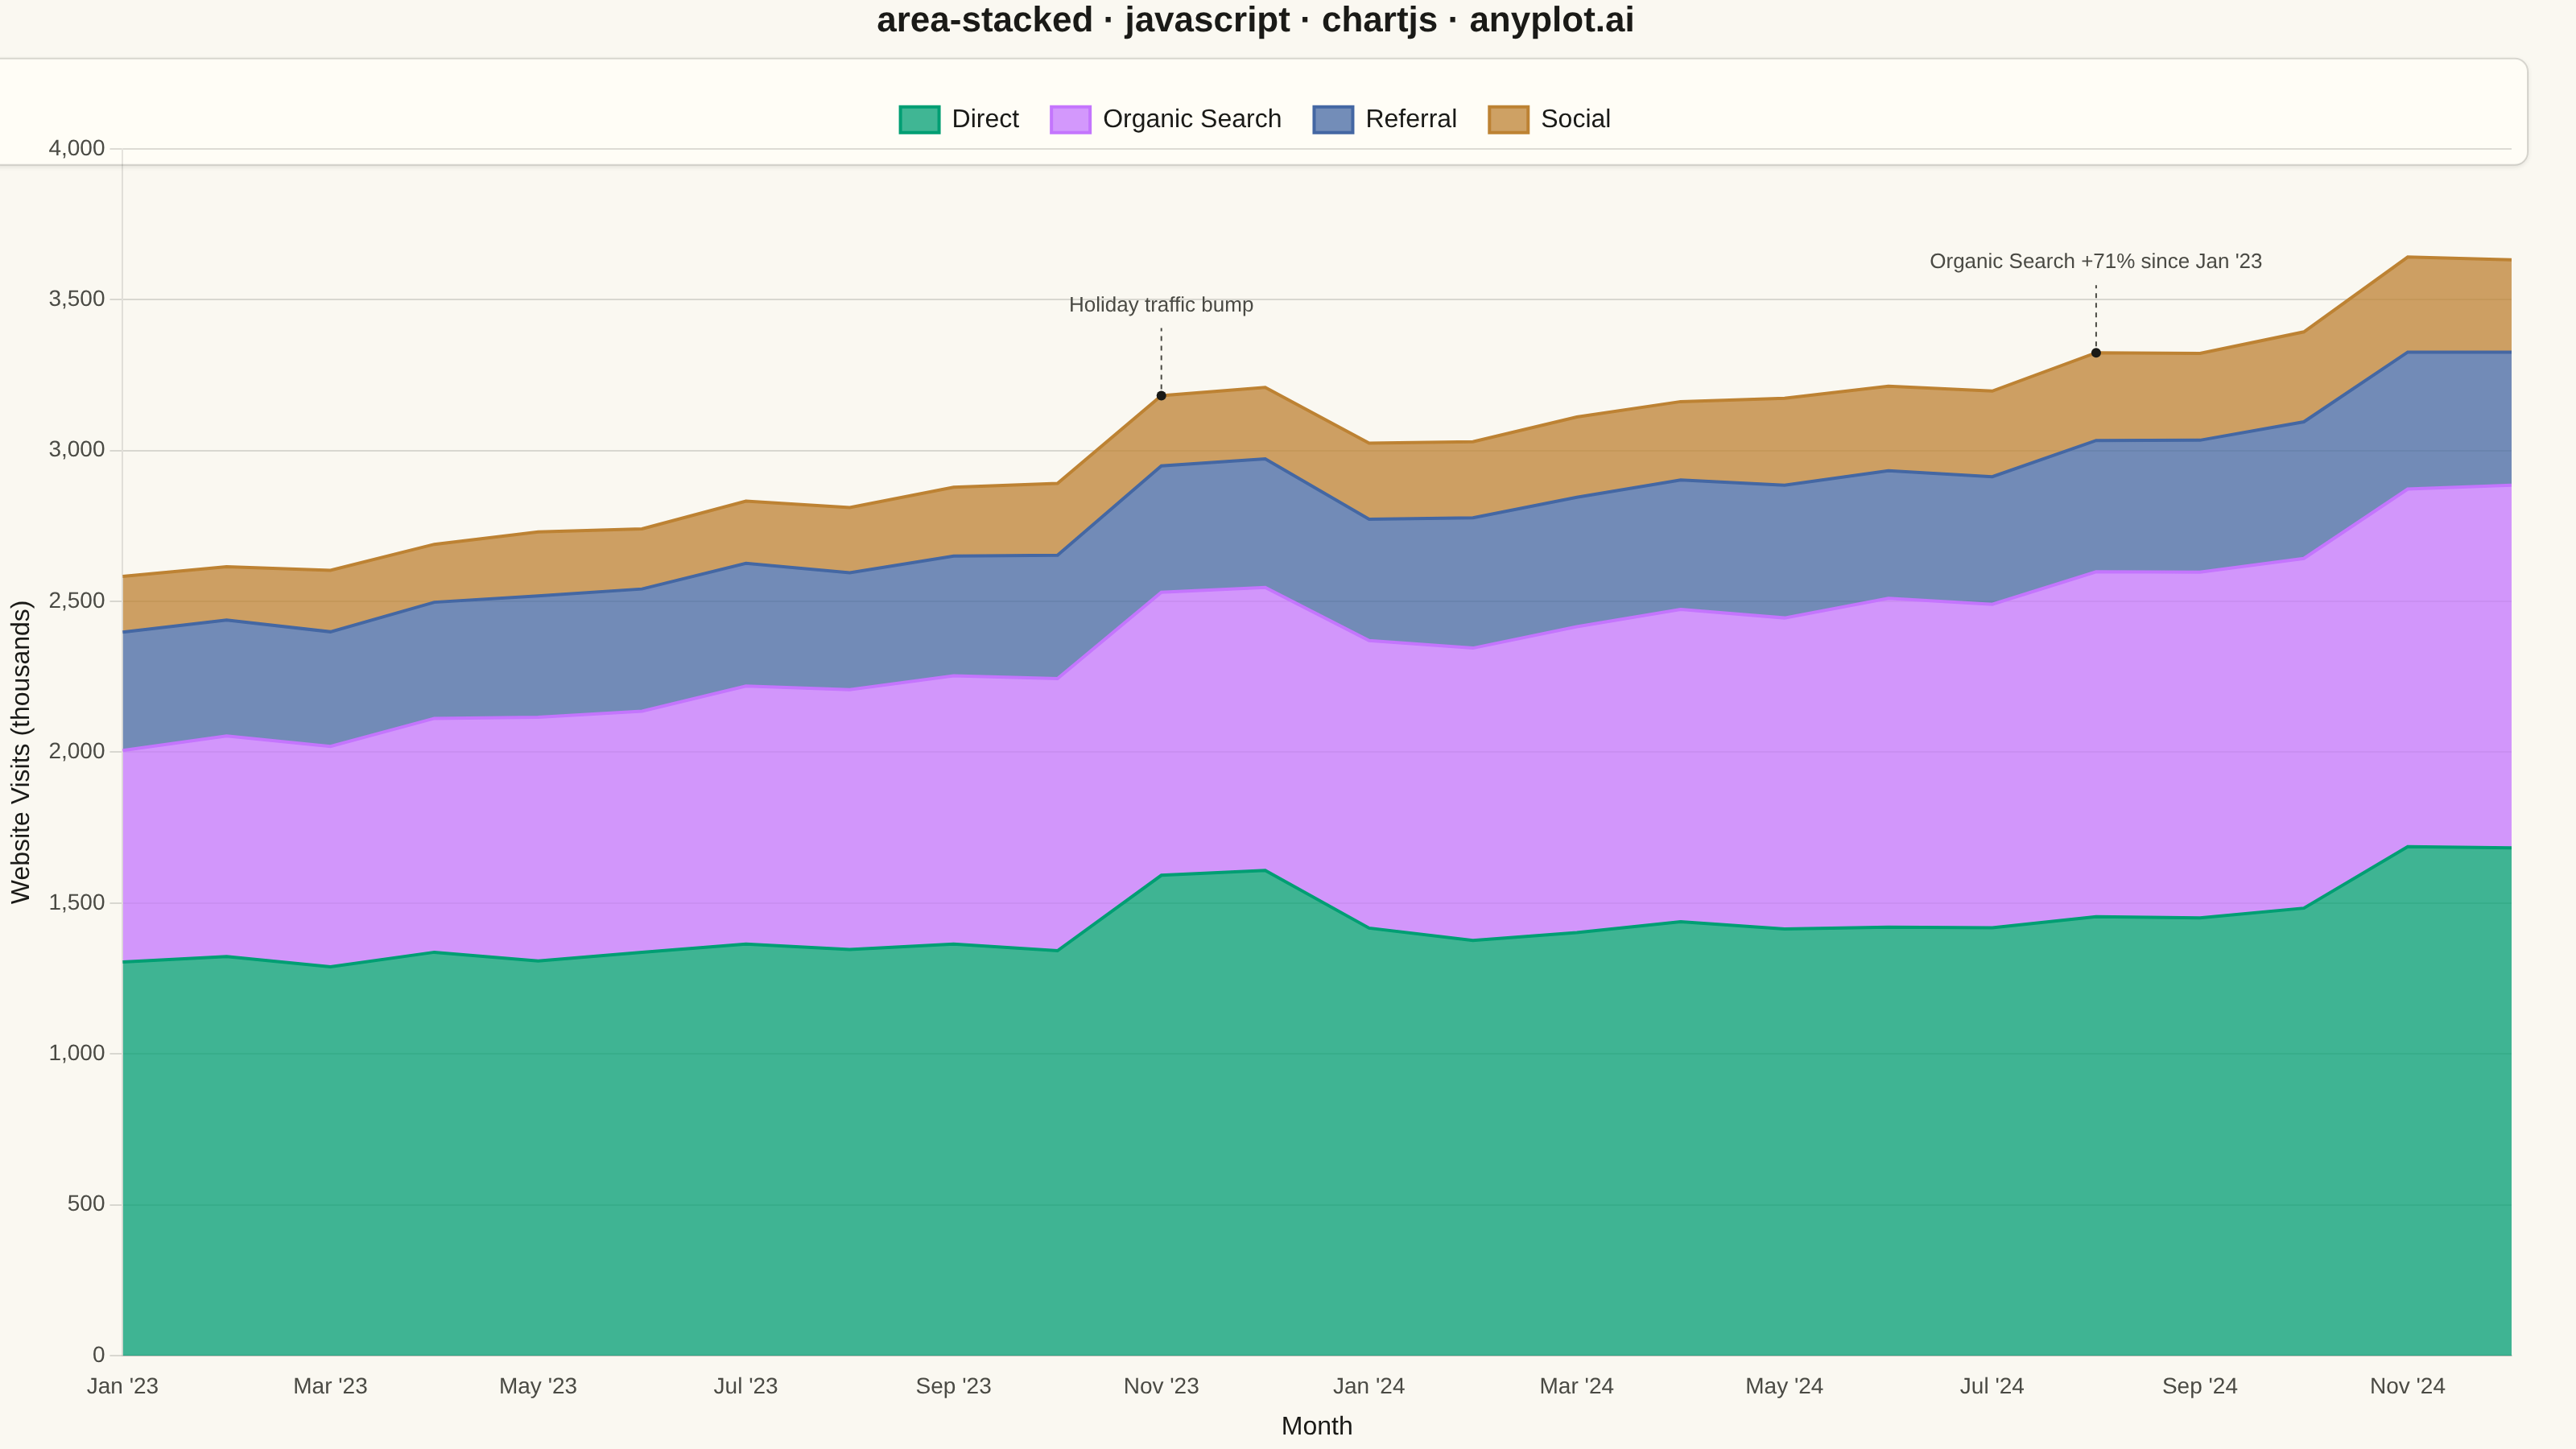
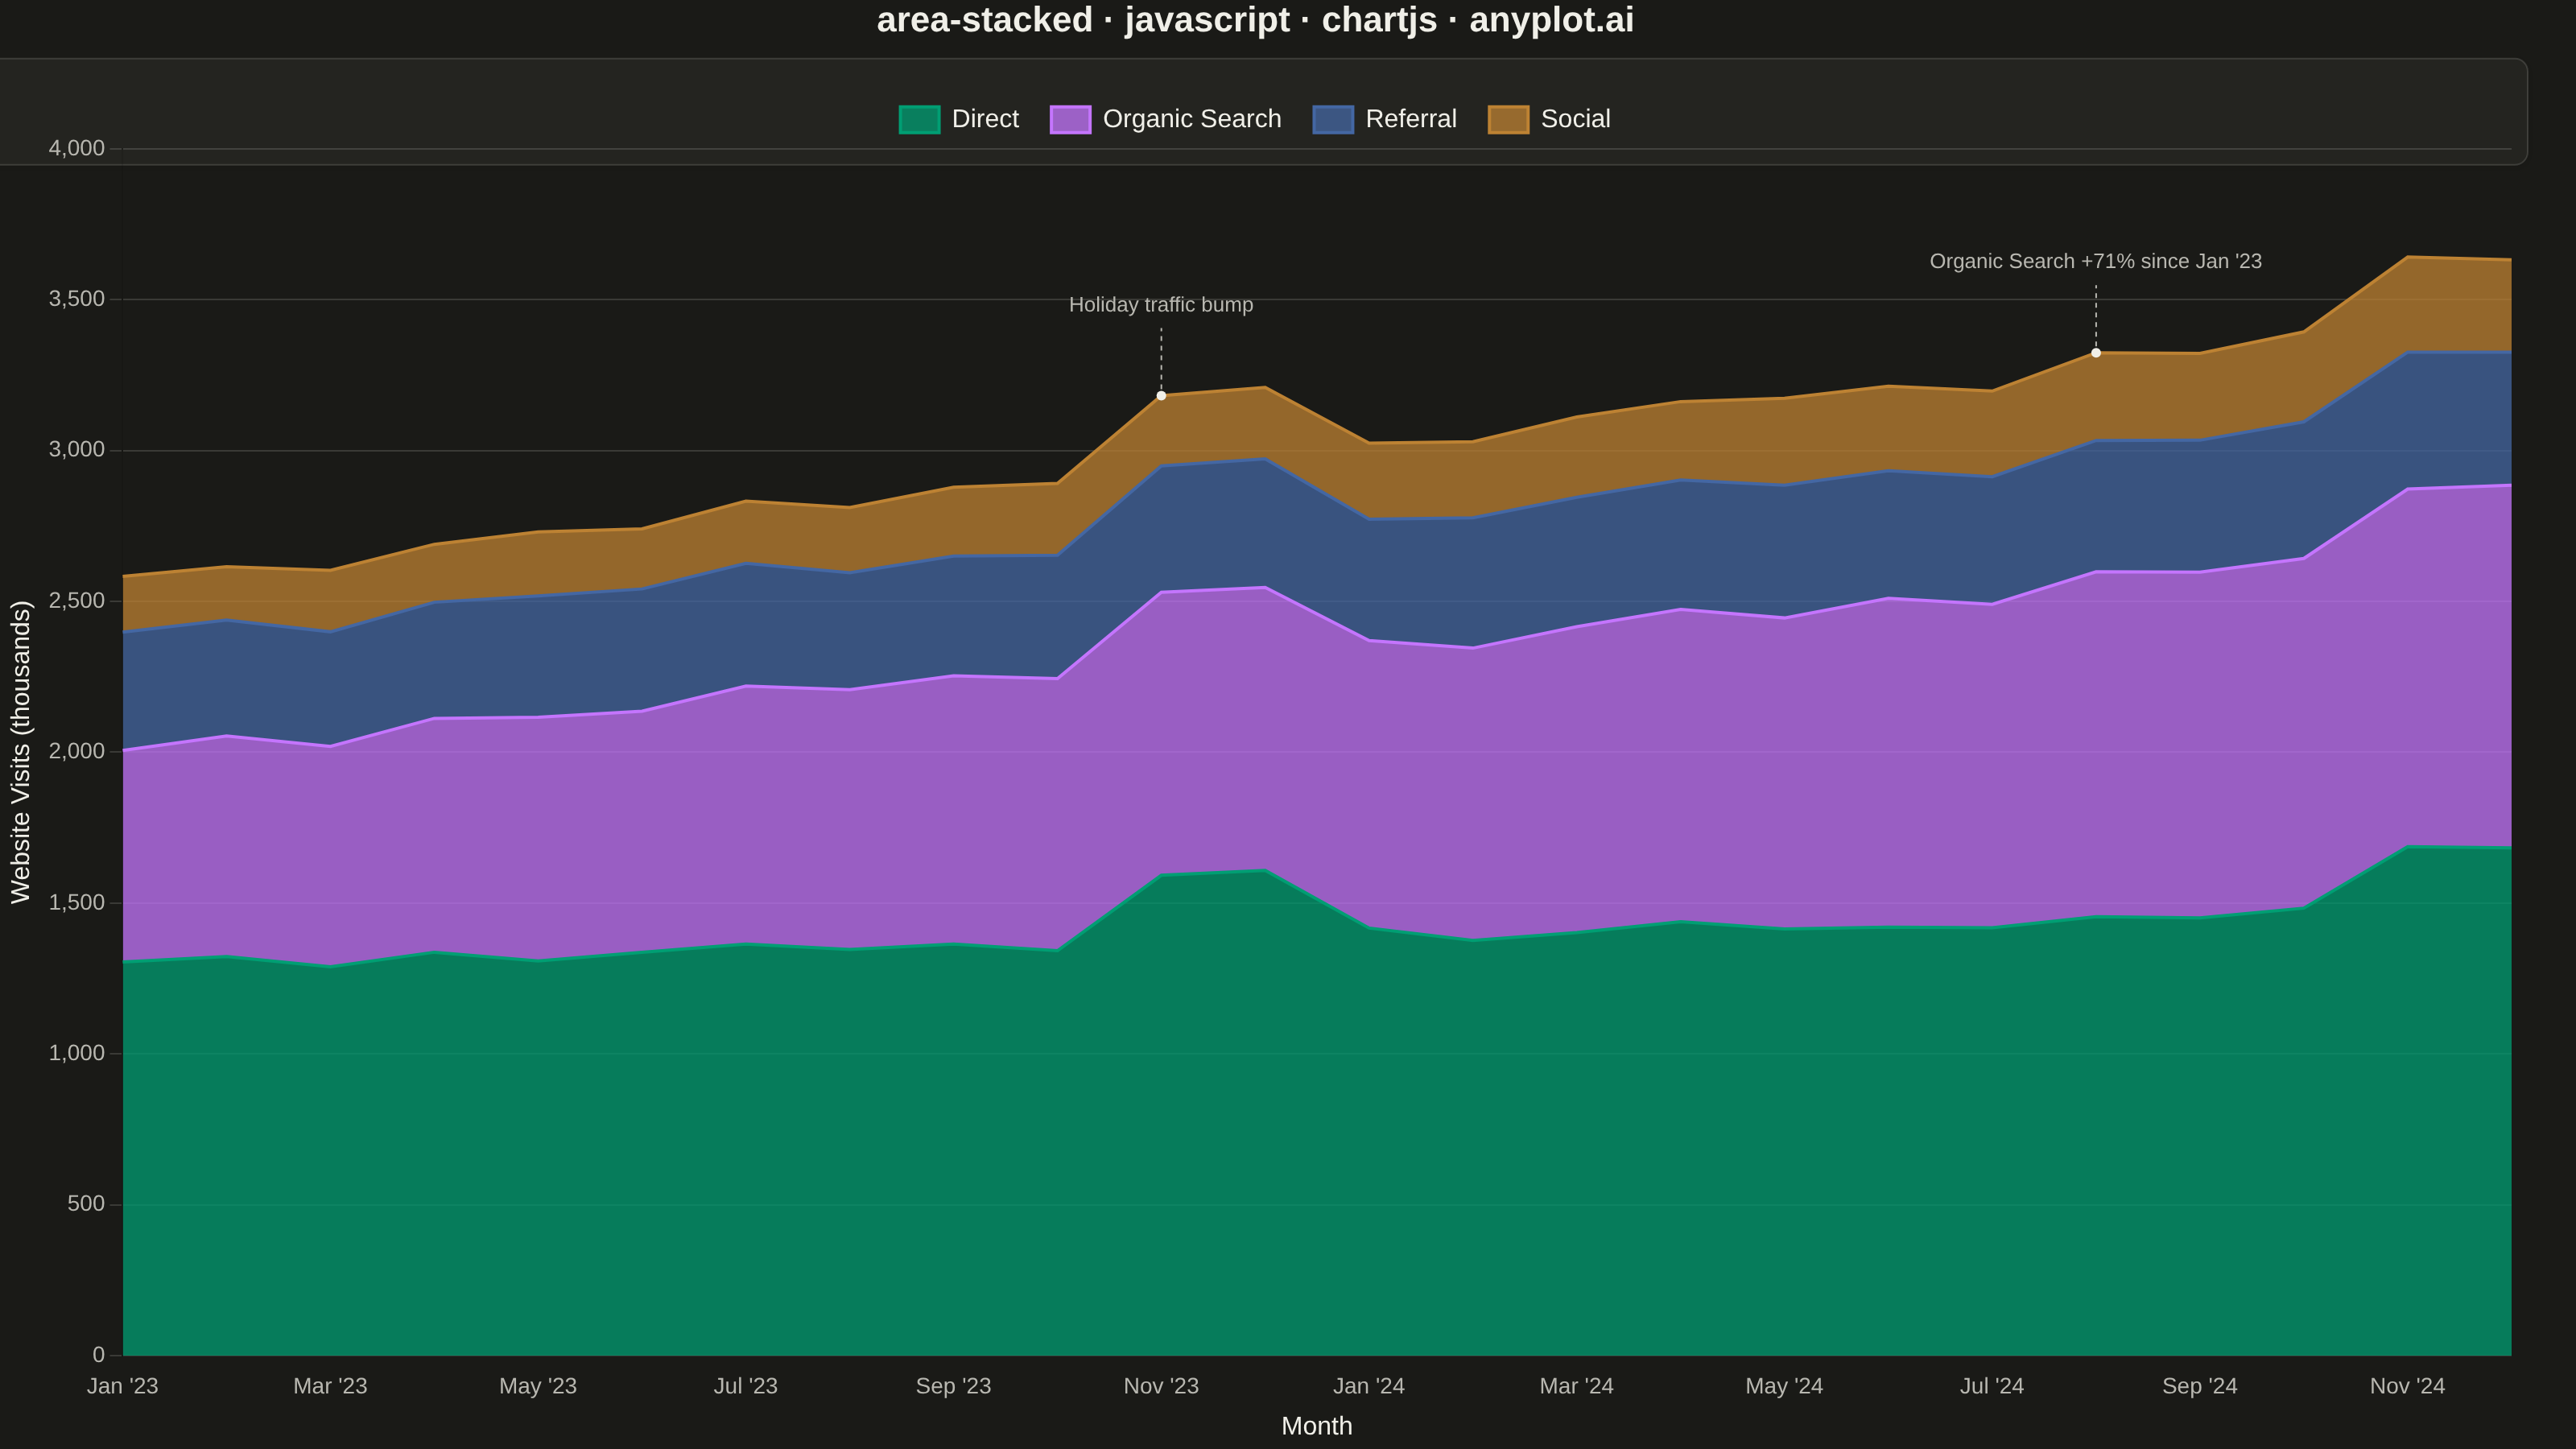
The same plot in 14 other libraries — JavaScript: D3.js, Apache ECharts, Highcharts, MUI X Charts; Python: Altair, Bokeh, lets-plot, Matplotlib, Plotly, plotnine, Pygal, Seaborn; R: ggplot2; Julia: Makie.jl. Compare all 15 side by side: Stacked Area Chart in Python, R, Julia and JavaScript.
A stacked area chart displays multiple data series as areas stacked on top of each other, with each series starting where the previous one ends. This visualization emphasizes both individual contributions and cumulative totals over a continuous axis (typically time). It is ideal for showing how parts contribute to a whole while tracking changes over time, making patterns of composition and overall trends immediately visible.
// anyplot.ai
// area-stacked: Stacked Area Chart
// Library: chartjs 4.4.7 | JavaScript 22.23.2
// Quality: 94/100 | Created: 2026-08-17

const t = window.ANYPLOT_TOKENS;

// --- Data (in-memory, deterministic) ----------------------------------------
// Monthly website traffic by source, Jan 2023 - Dec 2024 (24 months).
// Series ordered largest-to-smallest so the biggest source anchors the bottom
// of the stack (spec note: "order series by size, largest at bottom").
let seed = 42;
const lcg = () => {
  seed = (seed * 1103515245 + 12345) % 2147483648;
  return seed / 2147483648;
};
const noise = (scale) => (lcg() - 0.5) * scale;

const monthNames = [
  "Jan",
  "Feb",
  "Mar",
  "Apr",
  "May",
  "Jun",
  "Jul",
  "Aug",
  "Sep",
  "Oct",
  "Nov",
  "Dec",
];
const labels = [2023, 2024].flatMap((year) =>
  monthNames.map((m) => `${m} '${String(year).slice(2)}`),
);

const direct = [];
const organicSearch = [];
const referral = [];
const social = [];
labels.forEach((_, i) => {
  const holidayBump = i % 12 >= 10 ? 200 : 0;
  direct.push(Math.round(1300 + i * 8 + holidayBump + noise(60)));
  organicSearch.push(Math.round(700 + i * 22 + noise(50)));
  referral.push(Math.round(380 + i * 3 + noise(30)));
  // Kept below referral's growth rate throughout the series so the largest-
  // at-bottom stacking order never crosses over.
  social.push(Math.round(180 + i * 6 + noise(25)));
});

const holidayIndex = 10; // Nov '23 — first holiday-season traffic bump

// Organic Search grew fastest of the four sources (steepest slope above);
// surface that story explicitly instead of leaving it for the viewer to infer.
const organicGrowthPct = Math.round(
  ((organicSearch[organicSearch.length - 1] - organicSearch[0]) /
    organicSearch[0]) *
    100,
);
const organicCalloutIndex = labels.length - 5; // clear of the right-edge padding

const hexToRgba = (hex, alpha) => {
  const r = parseInt(hex.slice(1, 3), 16);
  const g = parseInt(hex.slice(3, 5), 16);
  const b = parseInt(hex.slice(5, 7), 16);
  return `rgba(${r}, ${g}, ${b}, ${alpha})`;
};

const series = [
  { label: "Direct", data: direct, color: t.palette[0] },
  { label: "Organic Search", data: organicSearch, color: t.palette[1] },
  { label: "Referral", data: referral, color: t.palette[2] },
  { label: "Social", data: social, color: t.palette[3] },
];

// --- Custom plugins ------------------------------------------------------------
// Elevated card background behind the legend, matching the Imprint
// "callout box" treatment instead of a bare default legend row. A hairline
// border on the card edge separates it from the softer drop shadow alone.
const elevatedLegendBg = {
  id: "elevatedLegendBg",
  beforeDraw(chart) {
    const { legend, ctx } = chart;
    if (!legend) return;
    const pad = 10;
    const x = legend.left - pad;
    const y = legend.top - pad;
    const w = legend.right - legend.left + pad * 2;
    const h = legend.bottom - legend.top + pad * 2;
    const r = 8;
    ctx.save();
    ctx.fillStyle = t.elevatedBg;
    ctx.shadowColor = "rgba(0, 0, 0, 0.12)";
    ctx.shadowBlur = 6;
    ctx.shadowOffsetY = 2;
    ctx.beginPath();
    ctx.moveTo(x + r, y);
    ctx.arcTo(x + w, y, x + w, y + h, r);
    ctx.arcTo(x + w, y + h, x, y + h, r);
    ctx.arcTo(x, y + h, x, y, r);
    ctx.arcTo(x, y, x + w, y, r);
    ctx.closePath();
    ctx.fill();
    ctx.shadowColor = "transparent";
    ctx.strokeStyle = t.grid;
    ctx.lineWidth = 1;
    ctx.stroke();
    ctx.restore();
  },
};

// Factory for the dashed-leader/dot/label callout used to surface a data
// story directly on the chart instead of leaving it for the viewer to infer.
// Both callouts below share this drawing logic, parameterized by which top-
// stack point they anchor to and what label they show.
const makeCallout = (id, pointIndex, text) => ({
  id,
  afterDatasetsDraw(chart) {
    const topMeta = chart.getDatasetMeta(series.length - 1);
    const point = topMeta.data[pointIndex];
    if (!point) return;
    const { x, y: yPeak } = point;
    const yLabel = yPeak - 56;

    const { ctx } = chart;
    ctx.save();
    ctx.strokeStyle = t.inkSoft;
    ctx.lineWidth = 1;
    ctx.setLineDash([3, 3]);
    ctx.beginPath();
    ctx.moveTo(x, yPeak - 4);
    ctx.lineTo(x, yLabel + 14);
    ctx.stroke();
    ctx.setLineDash([]);

    ctx.fillStyle = t.ink;
    ctx.beginPath();
    ctx.arc(x, yPeak, 3, 0, Math.PI * 2);
    ctx.fill();

    ctx.font = "13px sans-serif";
    ctx.fillStyle = t.inkSoft;
    ctx.textAlign = "center";
    ctx.fillText(text, x, yLabel);
    ctx.restore();
  },
});

// Nov '23 holiday-season traffic bump on the top edge of the stack.
const holidayCallout = makeCallout(
  "holidayCallout",
  holidayIndex,
  "Holiday traffic bump",
);

// Organic Search's two-year growth rate — the fastest-growing source in the
// stack.
const organicGrowthCallout = makeCallout(
  "organicGrowthCallout",
  organicCalloutIndex,
  `Organic Search +${organicGrowthPct}% since Jan '23`,
);

// --- Mount -------------------------------------------------------------------
const canvas = document.createElement("canvas");
document.getElementById("container").appendChild(canvas);

// --- Chart ---------------------------------------------------------------------
new Chart(canvas, {
  type: "line",
  data: {
    labels,
    datasets: series.map((s, i) => ({
      label: s.label,
      data: s.data,
      borderColor: s.color,
      backgroundColor: hexToRgba(s.color, 0.75),
      borderWidth: 2,
      pointRadius: 0,
      tension: 0,
      fill: i === 0 ? "origin" : "-1",
    })),
  },
  plugins: [elevatedLegendBg, holidayCallout, organicGrowthCallout],
  options: {
    responsive: true,
    maintainAspectRatio: false,
    animation: false,
    interaction: { mode: "index", intersect: false },
    layout: { padding: { right: 40 } },
    plugins: {
      title: {
        display: true,
        text: "area-stacked · javascript · chartjs · anyplot.ai",
        color: t.ink,
        font: { size: 22 },
        padding: { bottom: 20 },
      },
      legend: {
        position: "top",
        labels: { color: t.ink, font: { size: 16 }, boxWidth: 24, padding: 20 },
      },
    },
    scales: {
      x: {
        ticks: {
          color: t.inkSoft,
          font: { size: 14 },
          maxRotation: 0,
          autoSkip: true,
          maxTicksLimit: 12,
        },
        grid: { display: false },
        title: {
          display: true,
          text: "Month",
          color: t.ink,
          font: { size: 16 },
        },
      },
      y: {
        stacked: true,
        beginAtZero: true,
        ticks: { color: t.inkSoft, font: { size: 14 } },
        grid: { color: t.grid },
        title: {
          display: true,
          text: "Website Visits (thousands)",
          color: t.ink,
          font: { size: 16 },
        },
      },
    },
  },
});
Runnable source as JSON, for any HTTP client: https://api.anyplot.ai/specs/area-stacked/chartjs/code. Any spec id and library id listed in llms-full.txt fit the same URL shape; every URL below is complete and callable.
{
  "spec_id": "area-stacked",
  "language": "javascript",
  "library": "chartjs",
  "page": "https://anyplot.ai/area-stacked/javascript/chartjs",
  "hub": "https://anyplot.ai/area-stacked",
  "code_json": "https://api.anyplot.ai/specs/area-stacked/chartjs/code",
  "spec_json": "https://api.anyplot.ai/specs/area-stacked",
  "render_light_png": "https://storage.googleapis.com/anyplot-images/plots/area-stacked/javascript/chartjs/plot-light.png",
  "render_dark_png": "https://storage.googleapis.com/anyplot-images/plots/area-stacked/javascript/chartjs/plot-dark.png",
  "interactive_light_html": "https://storage.googleapis.com/anyplot-images/plots/area-stacked/javascript/chartjs/plot-light.html",
  "interactive_dark_html": "https://storage.googleapis.com/anyplot-images/plots/area-stacked/javascript/chartjs/plot-dark.html",
  "quality_score": 94.0,
  "license": "MIT",
  "guide": "https://anyplot.ai/llms.txt"
}
Part of Stacked Area Chart on anyplot.ai.