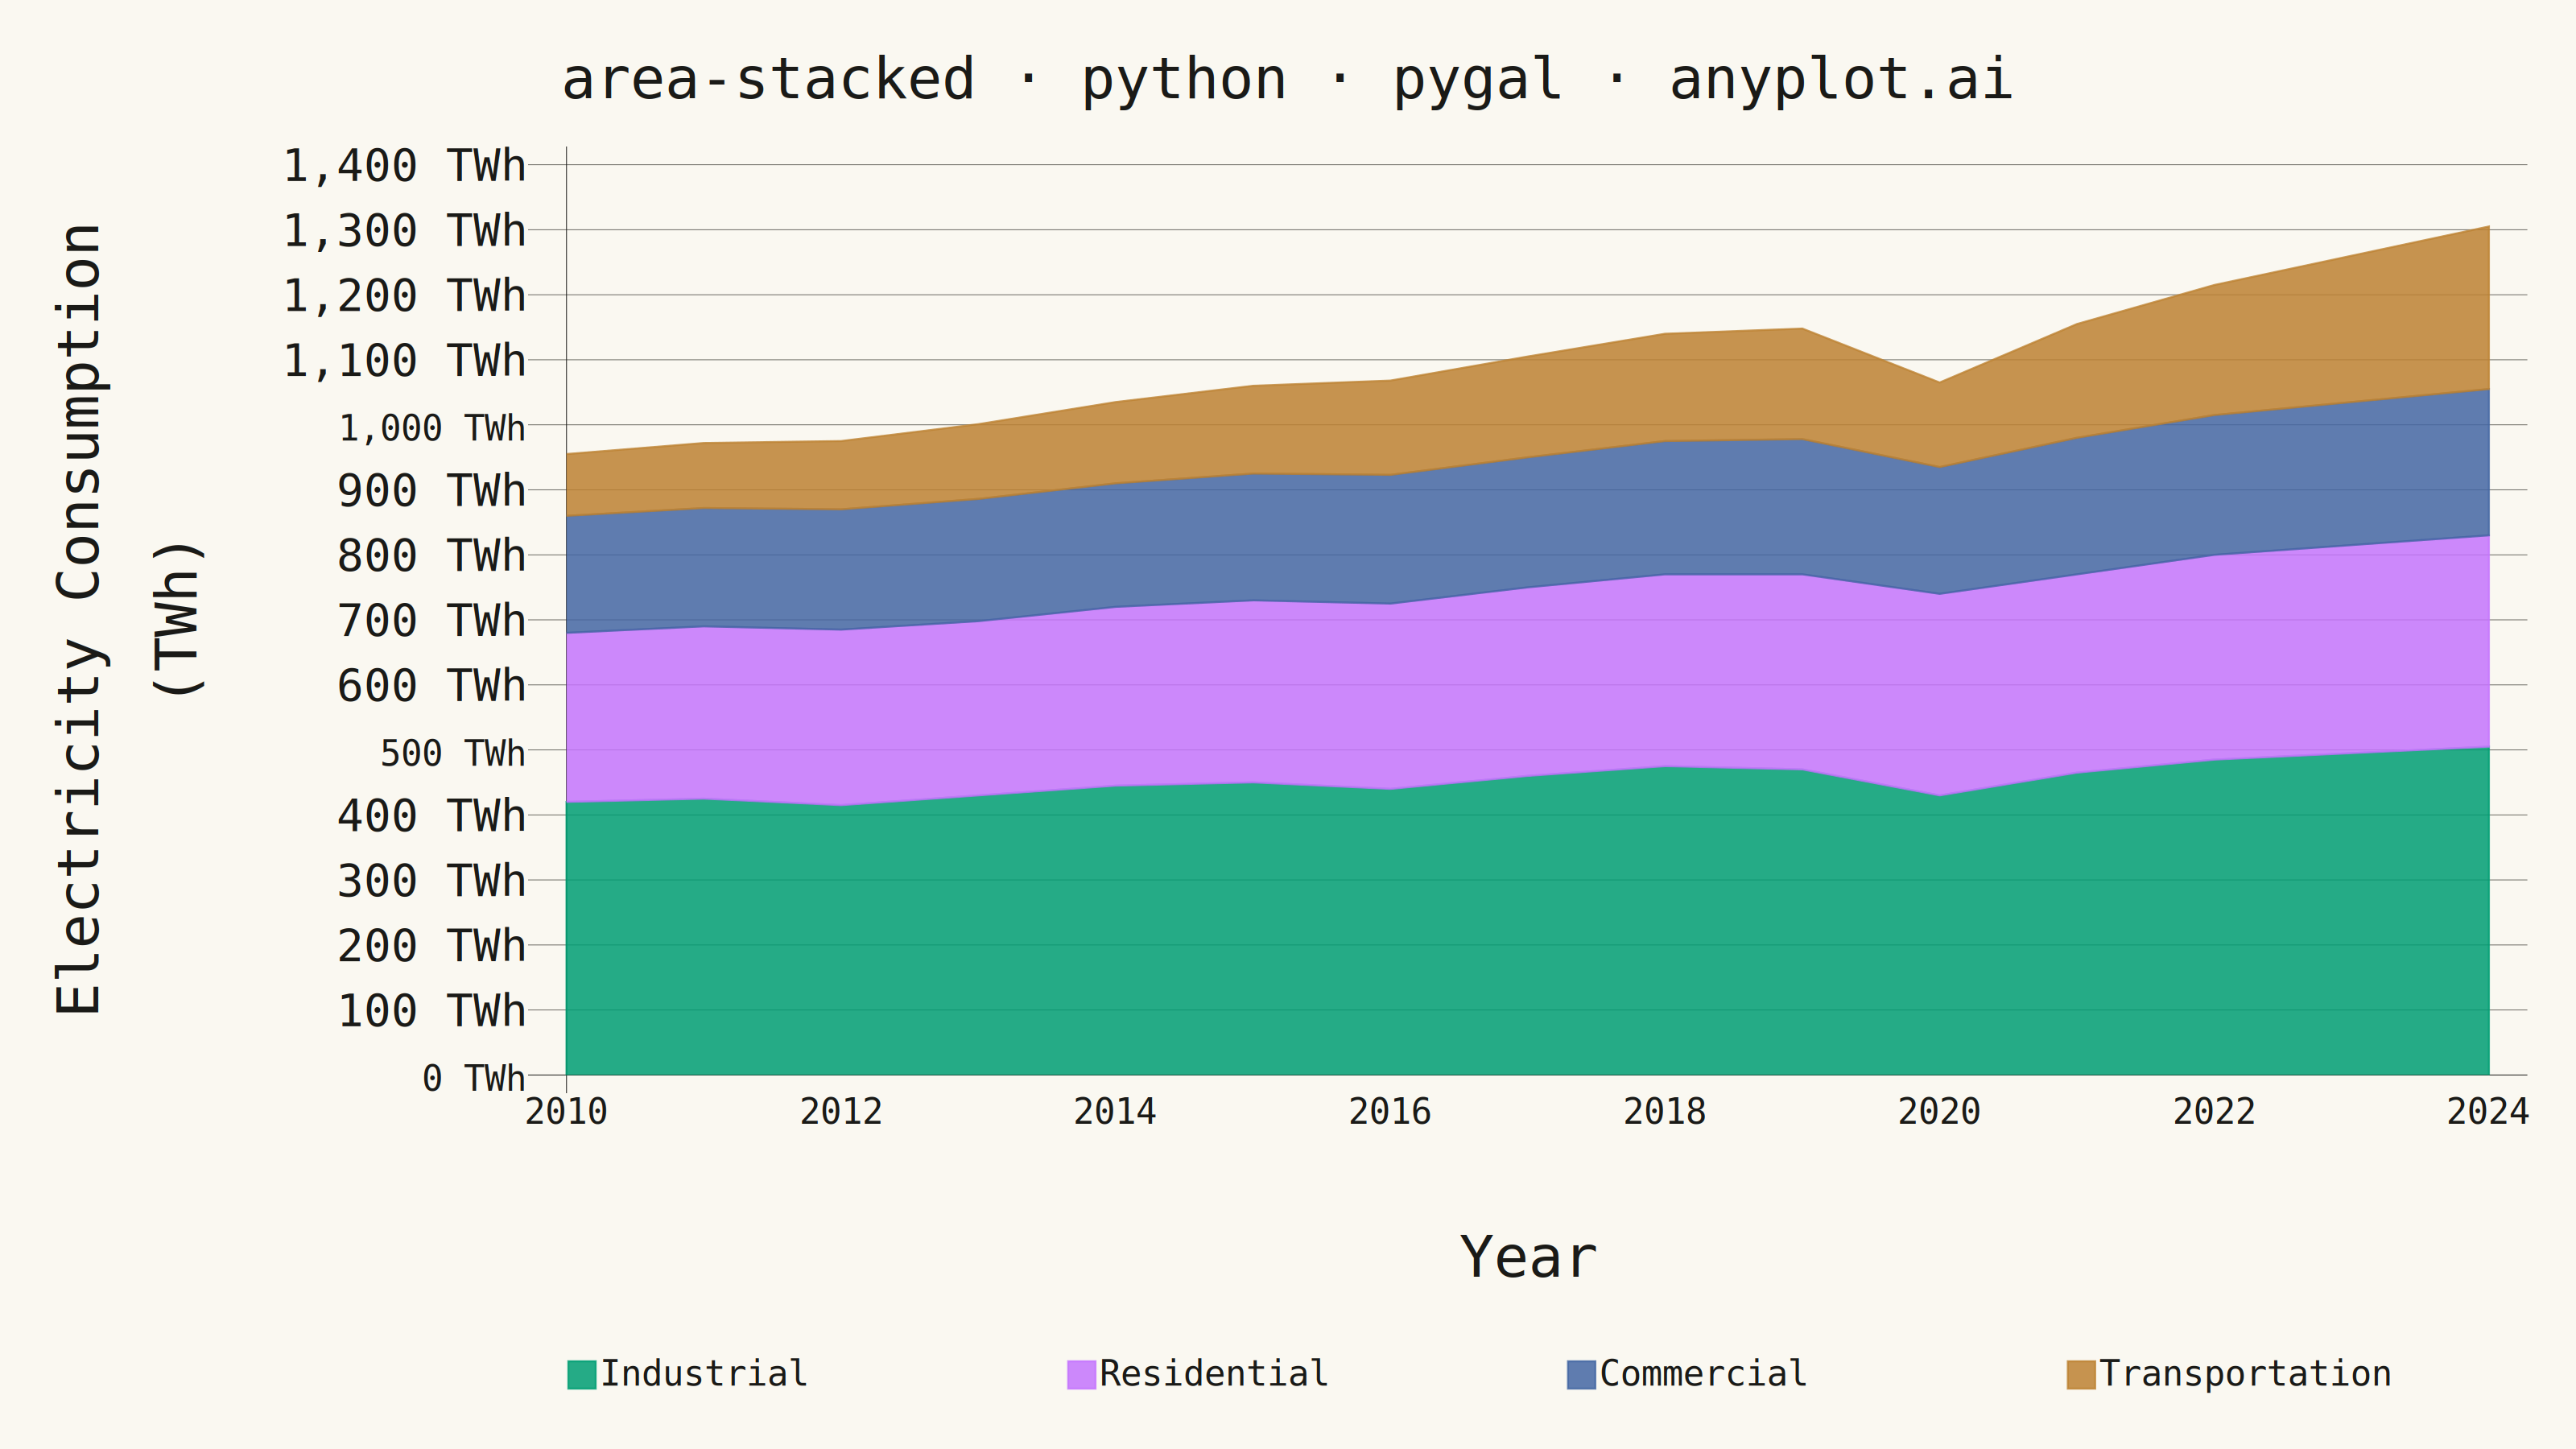
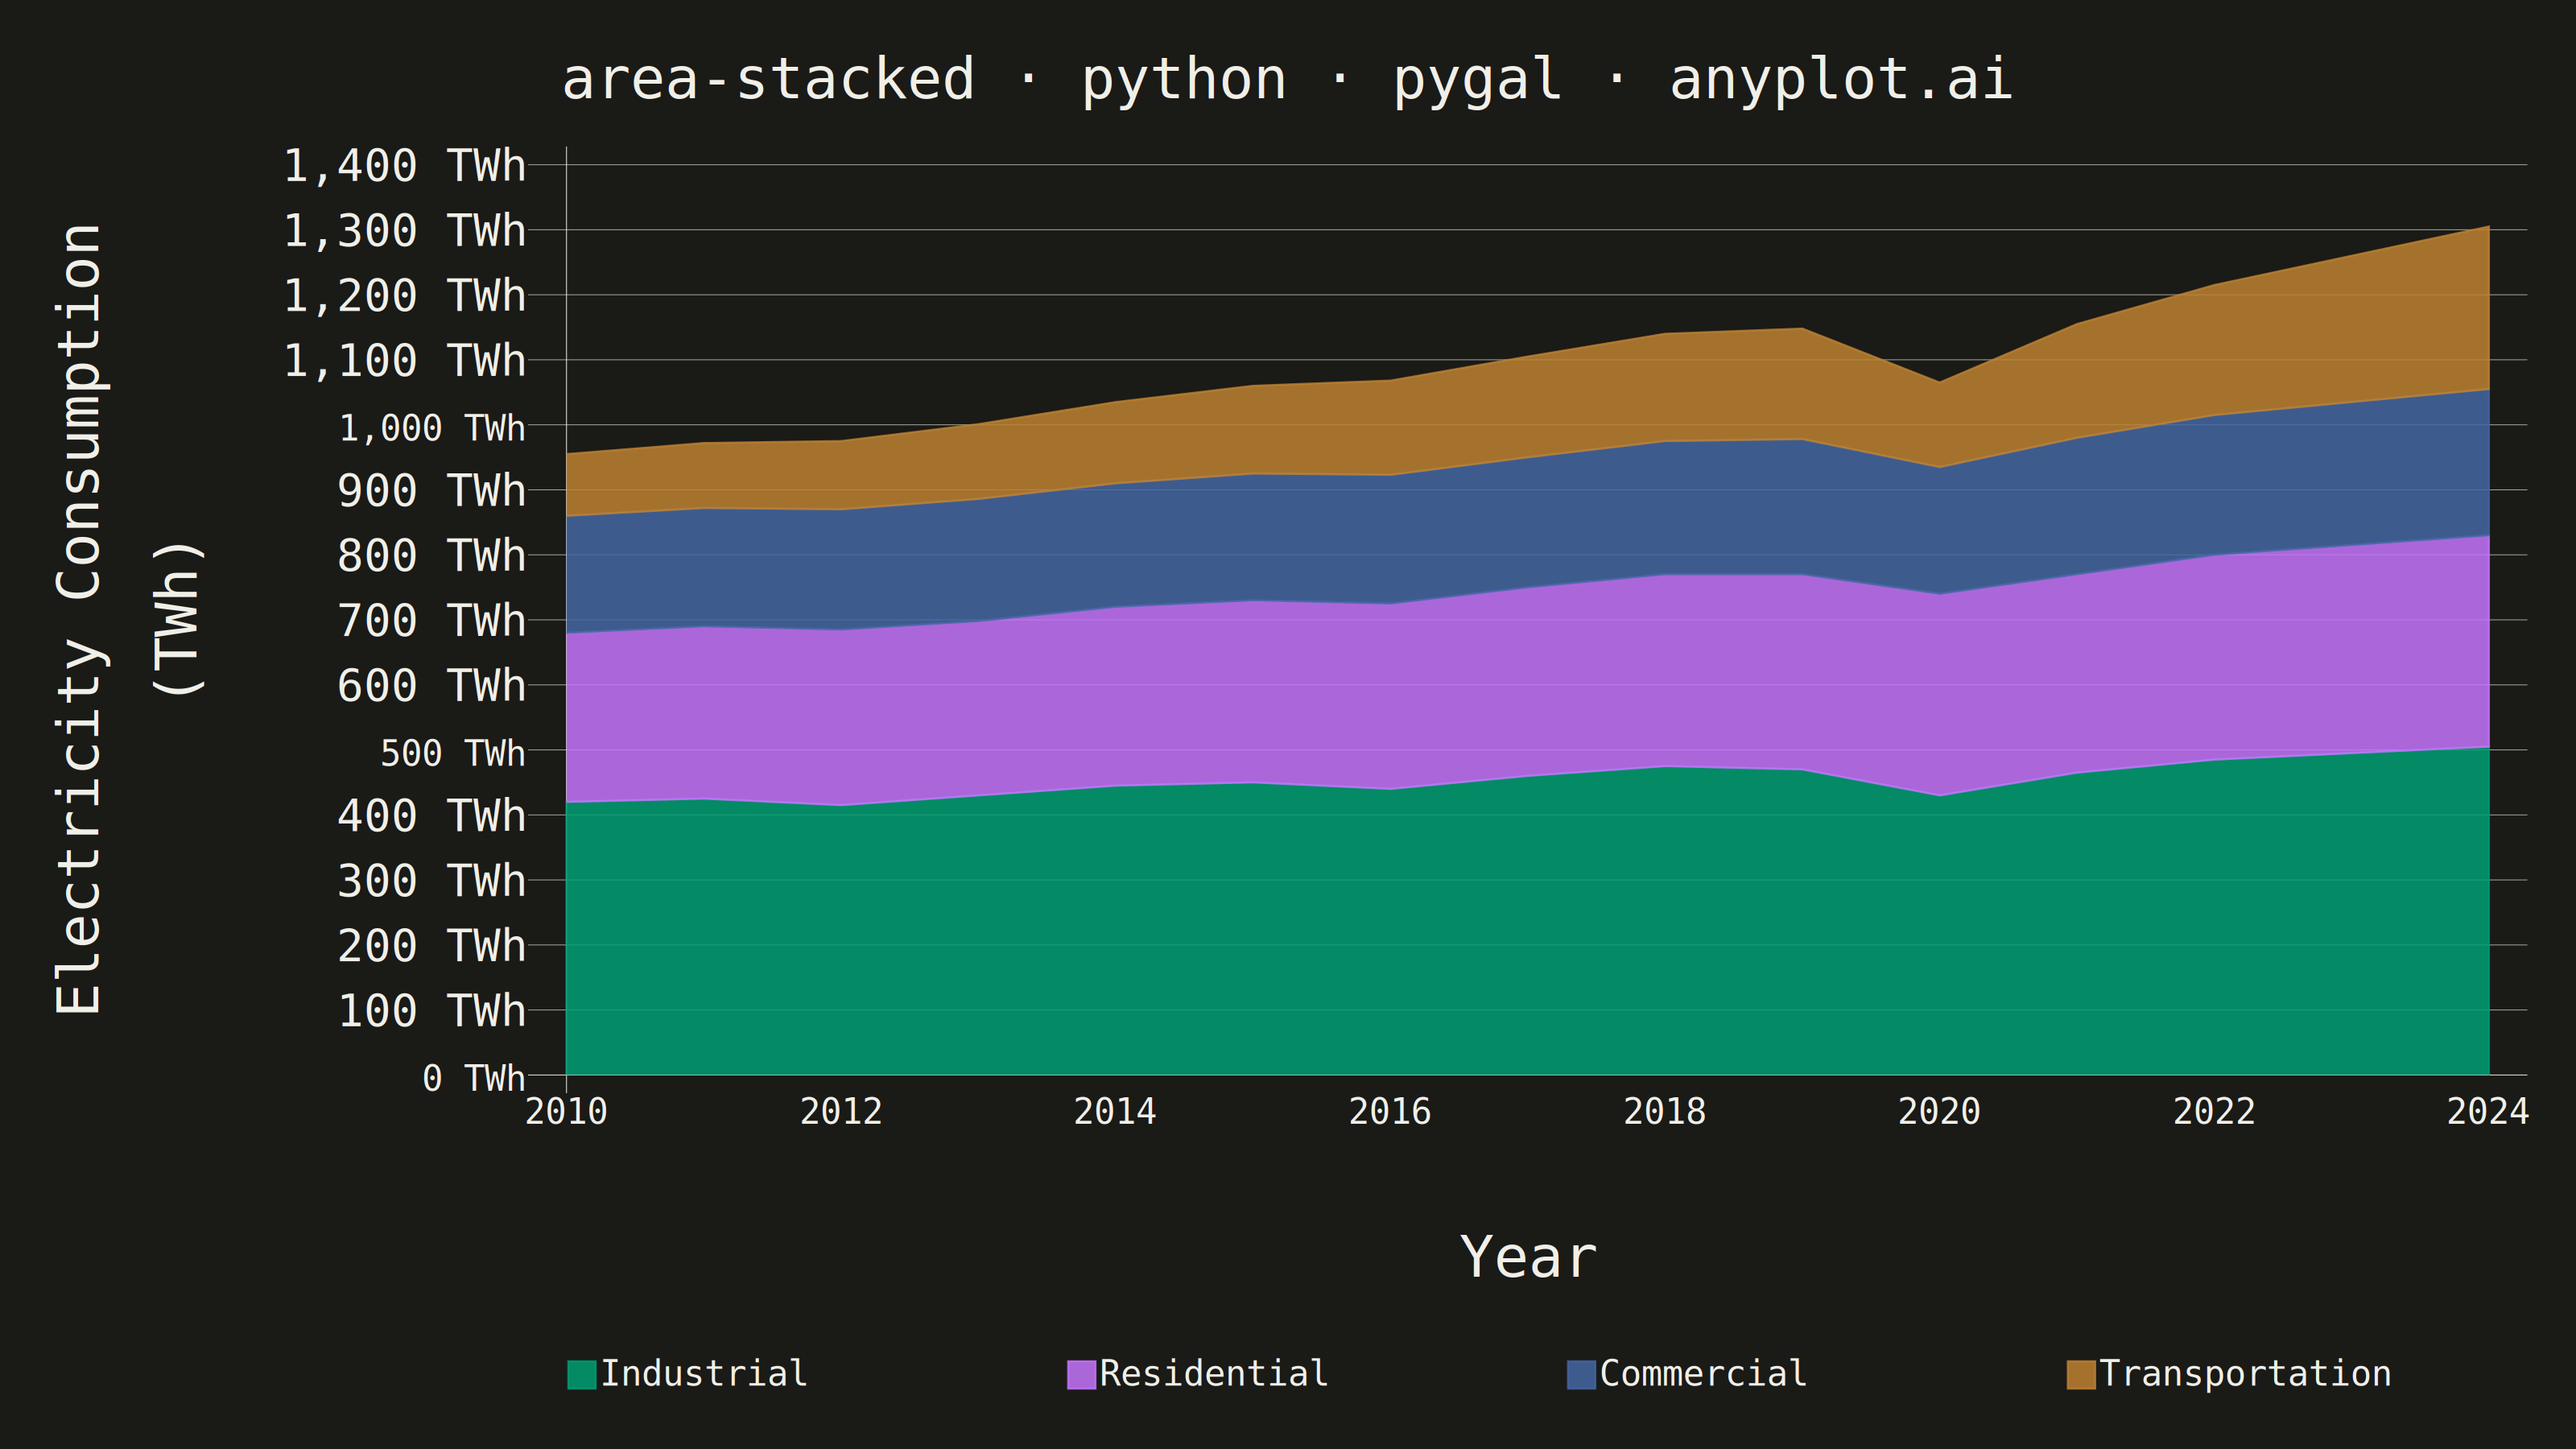
A stacked area chart displays multiple data series as areas stacked on top of each other, with each series starting where the previous one ends. This visualization emphasizes both individual contributions and cumulative totals over a continuous axis (typically time). It is ideal for showing how parts contribute to a whole while tracking changes over time, making patterns of composition and overall trends immediately visible.
""" anyplot.ai
area-stacked: Stacked Area Chart
Library: pygal 3.1.3 | Python 3.13.15
Quality: 91/100 | Updated: 2026-08-17
"""

import os

import pygal
from pygal.style import Style


# Theme tokens (see prompts/default-style-guide.md)
THEME = os.getenv("ANYPLOT_THEME", "light")
PAGE_BG = "#FAF8F1" if THEME == "light" else "#1A1A17"
INK = "#1A1A17" if THEME == "light" else "#F0EFE8"
INK_SOFT = "#4A4A44" if THEME == "light" else "#B8B7B0"
INK_MUTED = "#6B6A63" if THEME == "light" else "#A8A79F"

# Imprint palette (first series is always #009E73)
IMPRINT = ("#009E73", "#C475FD", "#4467A3", "#BD8233", "#AE3030", "#2ABCCD", "#954477")

# Data - National electricity consumption by sector, 2010-2024 (TWh)
# Stack order is fixed by each sector's average magnitude across the full
# 15-year range (largest at bottom), not by any single year's snapshot -
# a fixed order keeps the stack visually stable instead of reshuffling
# bands as ranks cross over (e.g. Transportation overtakes Commercial only
# in the final years, 2023-2024).
years = [str(y) for y in range(2010, 2025)]

industrial = [420, 425, 415, 430, 445, 450, 440, 460, 475, 470, 430, 465, 485, 495, 505]
transportation = [95, 100, 105, 115, 125, 135, 145, 155, 165, 170, 130, 175, 200, 225, 250]
residential = [260, 265, 270, 268, 275, 280, 285, 290, 295, 300, 310, 305, 315, 320, 325]
commercial = [180, 182, 185, 188, 190, 195, 198, 200, 205, 208, 195, 210, 215, 220, 225]

# Custom style for the 3200x1800 canonical canvas
custom_style = Style(
    background=PAGE_BG,
    plot_background=PAGE_BG,
    foreground=INK,
    foreground_strong=INK,
    foreground_subtle=INK_MUTED,
    opacity=".85",
    opacity_hover=".95",
    colors=IMPRINT,
    title_font_size=72,
    label_font_size=56,
    major_label_font_size=44,
    legend_font_size=44,
    value_font_size=36,
    stroke_width=2.5,
    guide_stroke_dasharray="none",
    guide_stroke_color=INK_MUTED,
    major_guide_stroke_dasharray="none",
    major_guide_stroke_color=INK_MUTED,
)

# Create stacked area chart
chart = pygal.StackedLine(
    width=3200,
    height=1800,
    style=custom_style,
    title="area-stacked · python · pygal · anyplot.ai",
    x_title="Year",
    y_title="Electricity Consumption (TWh)",
    fill=True,
    range=(0, 1400),
    show_y_guides=True,
    show_x_guides=False,
    x_label_rotation=0,
    x_labels_major_count=8,
    show_minor_x_labels=False,
    legend_at_bottom=True,
    legend_at_bottom_columns=4,
    legend_box_size=34,
    truncate_legend=-1,
    show_dots=False,
    value_formatter=lambda v: f"{v:,.0f} TWh",
    margin=60,
    margin_bottom=120,
    spacing=50,
)

# Add x-axis labels
chart.x_labels = years

# Add series (largest at bottom for easier reading)
chart.add("Industrial", industrial)
chart.add("Residential", residential)
chart.add("Commercial", commercial)
chart.add("Transportation", transportation)

# Save as PNG and HTML with theme-suffixed names
chart.render_to_png(f"plot-{THEME}.png")
with open(f"plot-{THEME}.html", "wb") as f:
    f.write(chart.render())
Runnable source as JSON, for any HTTP client: https://api.anyplot.ai/specs/area-stacked/pygal/code. Any spec id and library id listed in llms-full.txt fit the same URL shape; every URL below is complete and callable.
{
  "spec_id": "area-stacked",
  "language": "python",
  "library": "pygal",
  "page": "https://anyplot.ai/area-stacked/python/pygal",
  "hub": "https://anyplot.ai/area-stacked",
  "code_json": "https://api.anyplot.ai/specs/area-stacked/pygal/code",
  "spec_json": "https://api.anyplot.ai/specs/area-stacked",
  "render_light_png": "https://storage.googleapis.com/anyplot-images/plots/area-stacked/python/pygal/plot-light.png",
  "render_dark_png": "https://storage.googleapis.com/anyplot-images/plots/area-stacked/python/pygal/plot-dark.png",
  "interactive_light_html": "https://storage.googleapis.com/anyplot-images/plots/area-stacked/python/pygal/plot-light.html",
  "interactive_dark_html": "https://storage.googleapis.com/anyplot-images/plots/area-stacked/python/pygal/plot-dark.html",
  "quality_score": 91.0,
  "license": "MIT",
  "guide": "https://anyplot.ai/llms.txt"
}
Part of Stacked Area Chart on anyplot.ai.