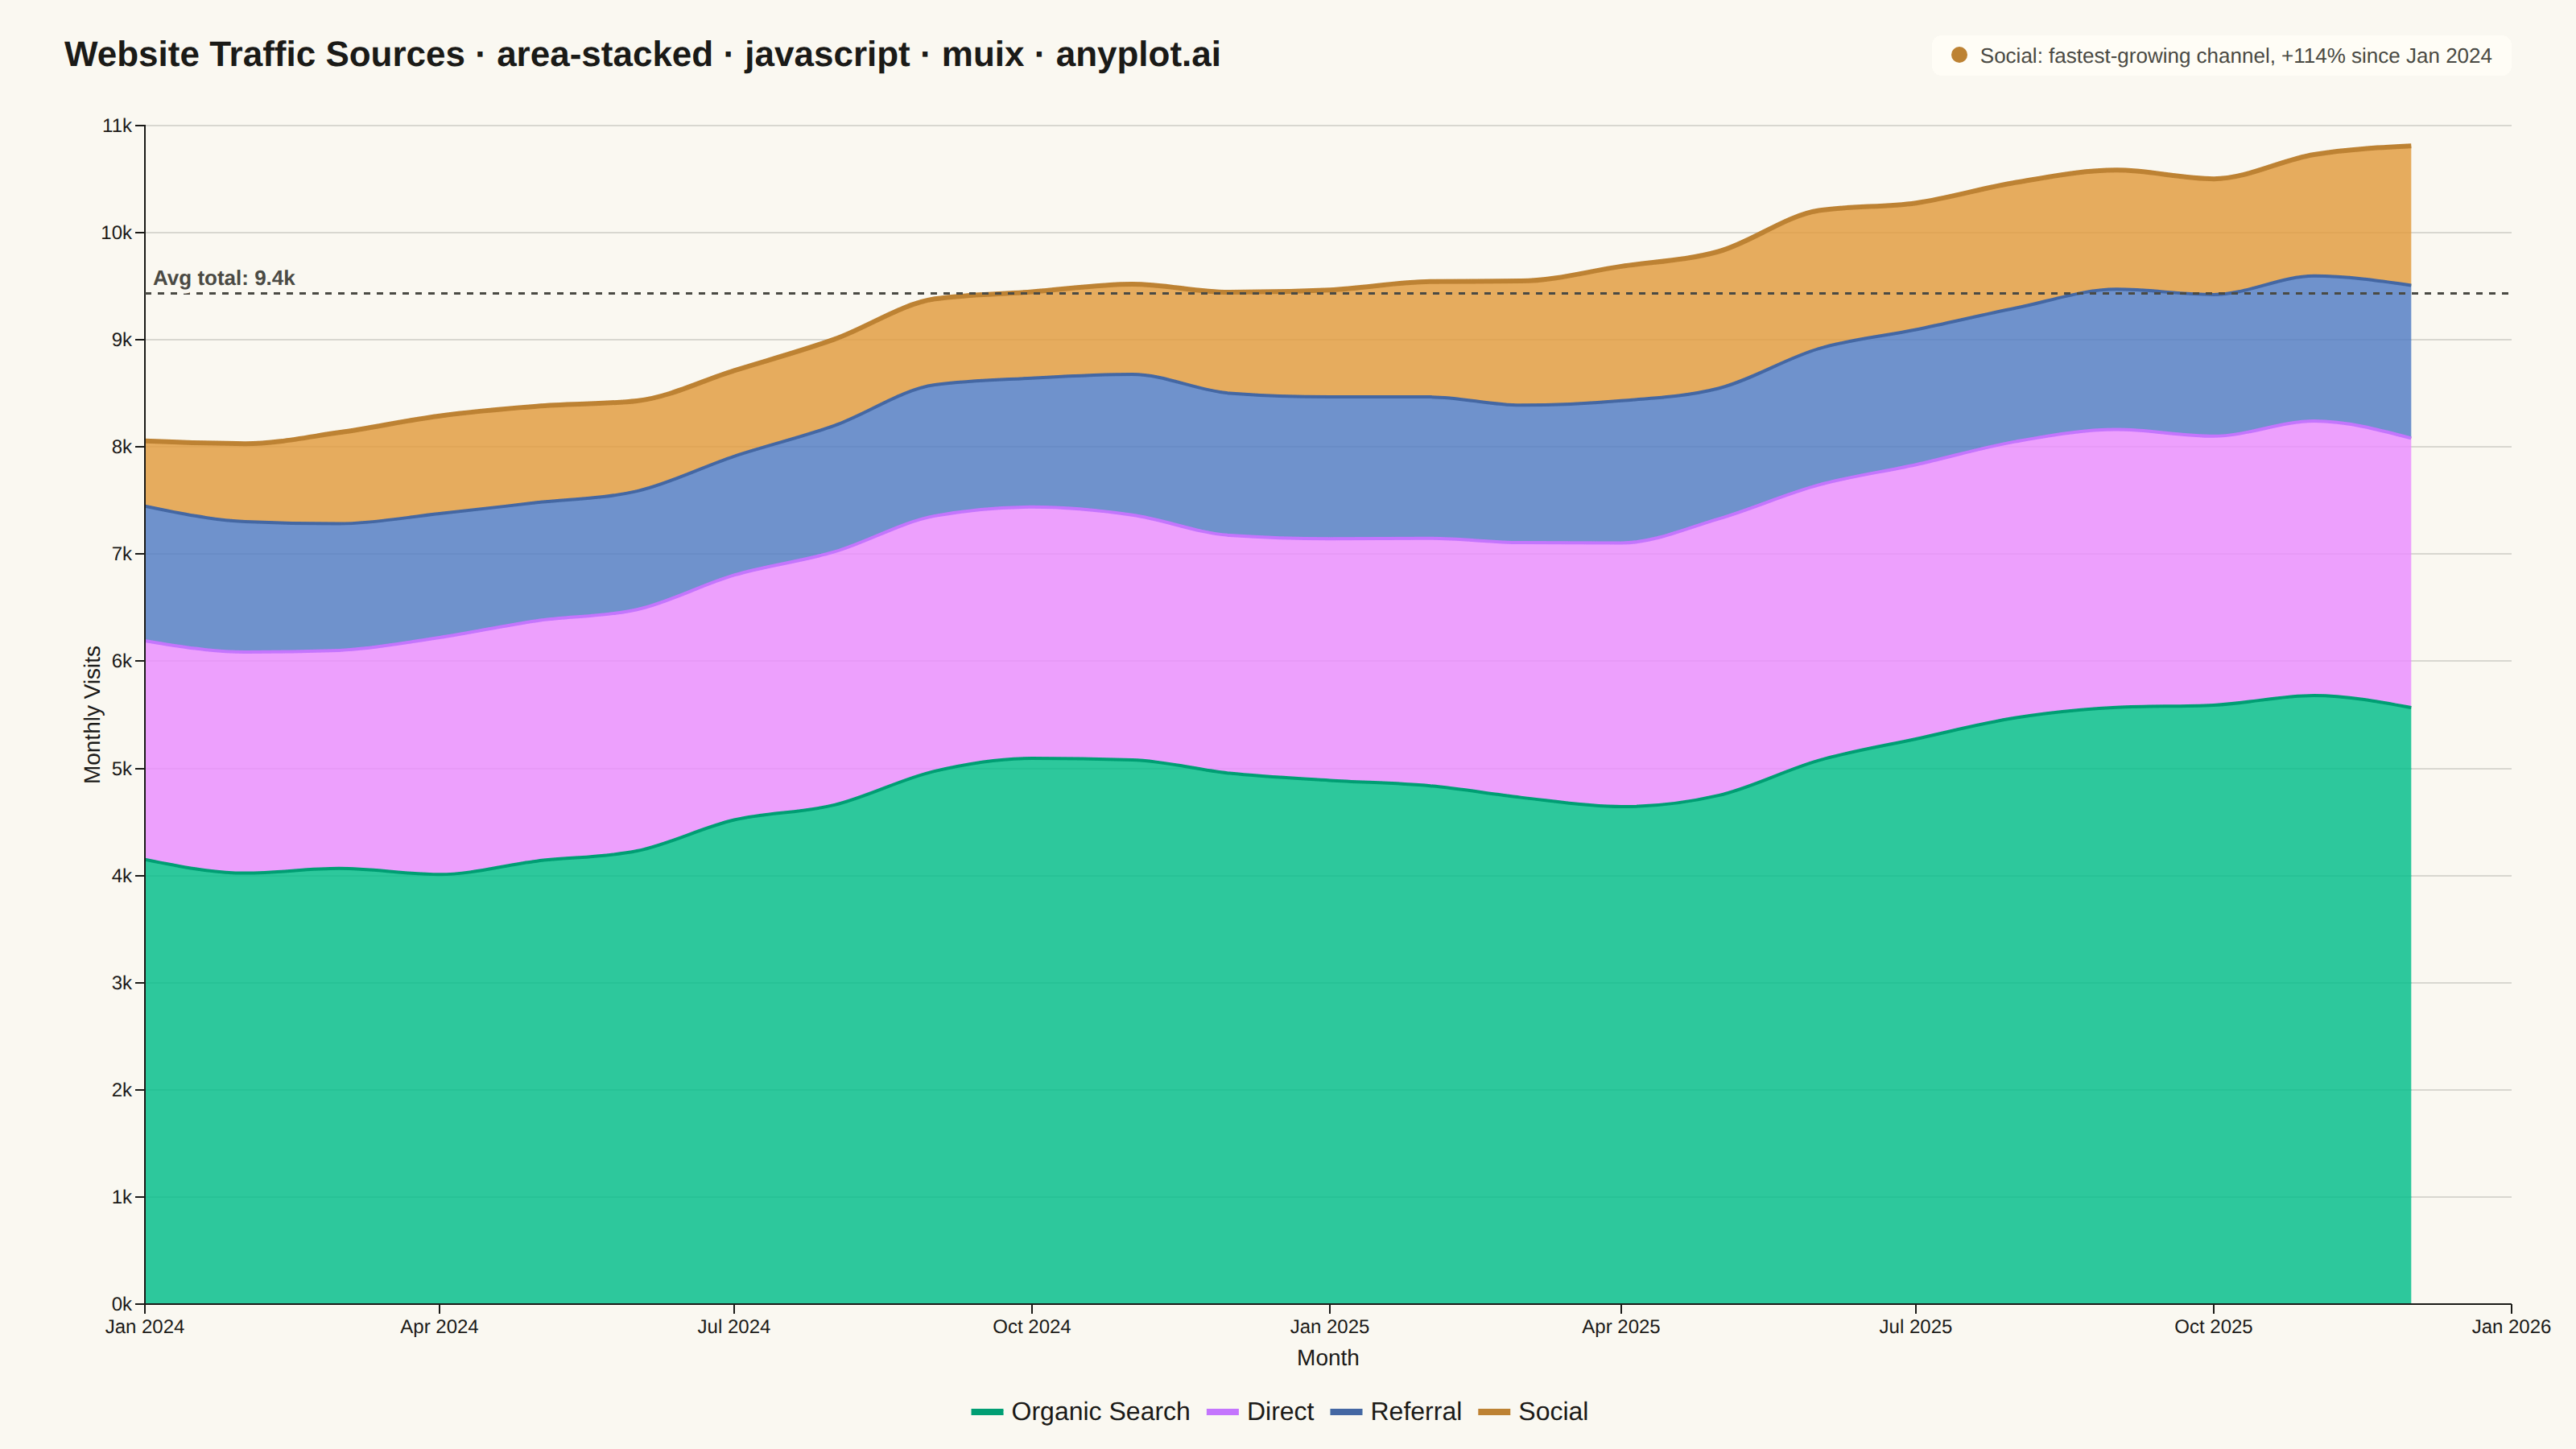
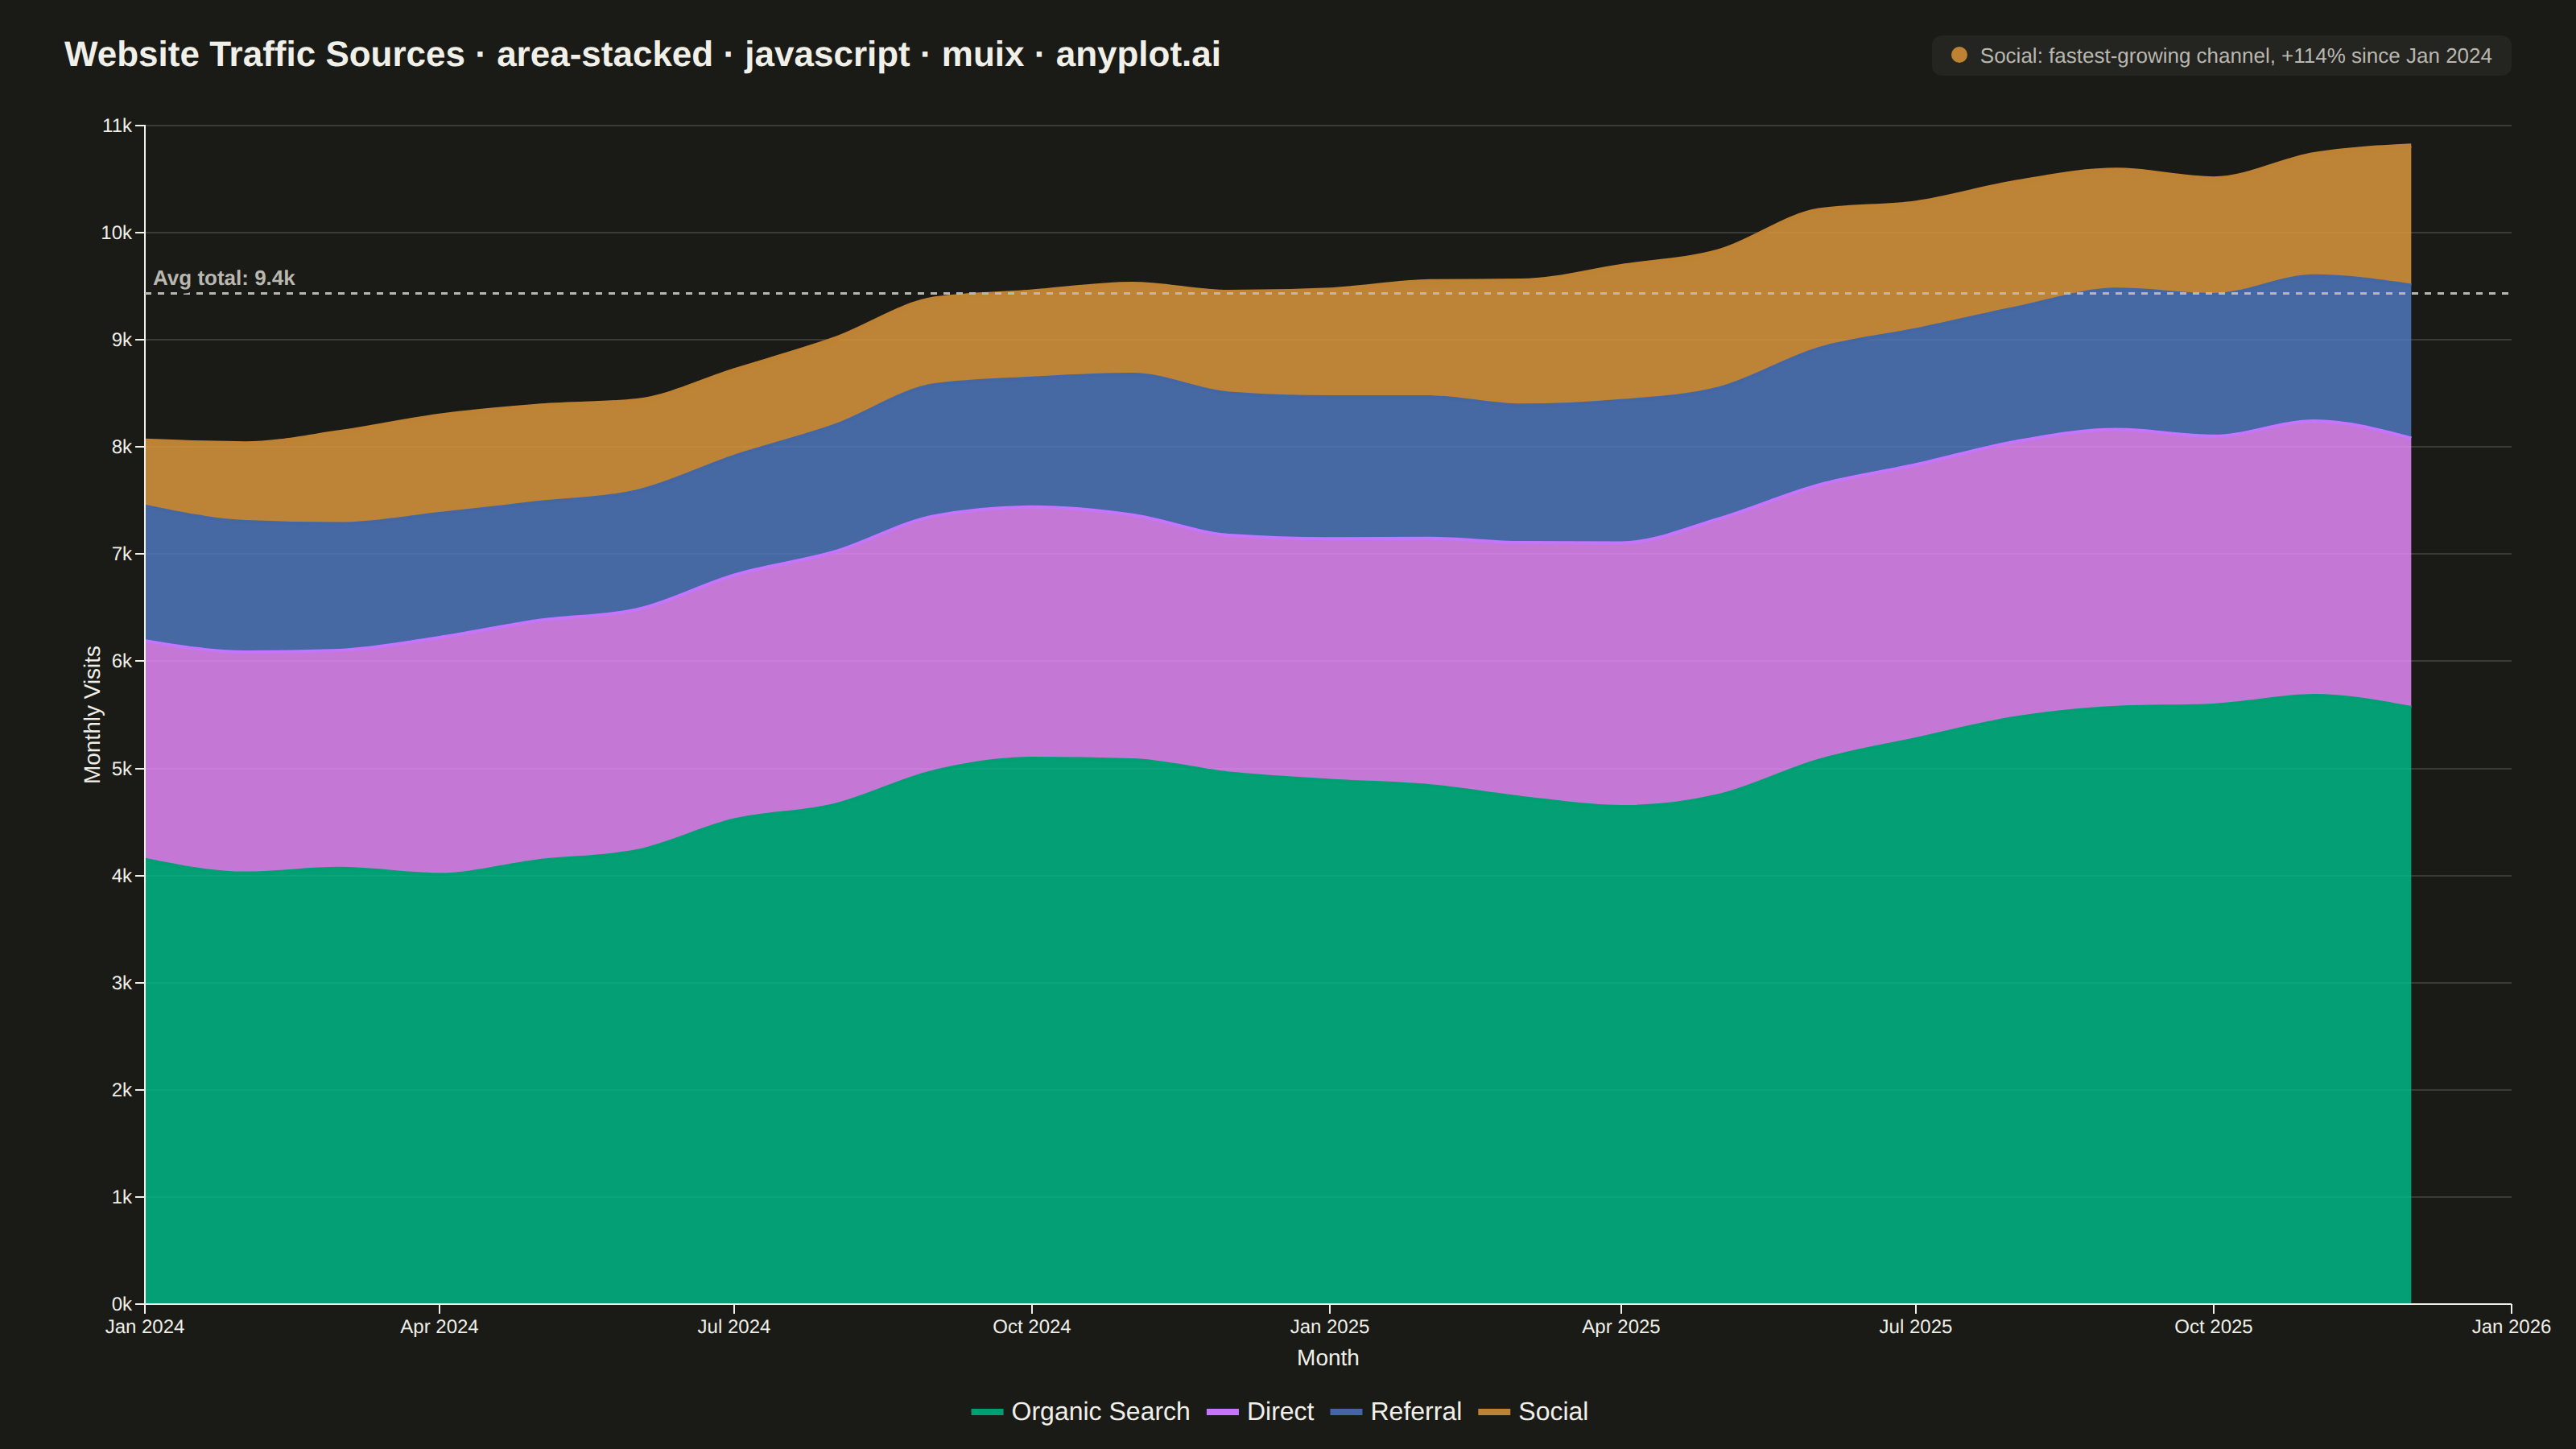
The same plot in 14 other libraries — JavaScript: Chart.js, D3.js, Apache ECharts, Highcharts; Python: Altair, Bokeh, lets-plot, Matplotlib, Plotly, plotnine, Pygal, Seaborn; R: ggplot2; Julia: Makie.jl. Compare all 15 side by side: Stacked Area Chart in Python, R, Julia and JavaScript.
A stacked area chart displays multiple data series as areas stacked on top of each other, with each series starting where the previous one ends. This visualization emphasizes both individual contributions and cumulative totals over a continuous axis (typically time). It is ideal for showing how parts contribute to a whole while tracking changes over time, making patterns of composition and overall trends immediately visible.
// anyplot.ai
// area-stacked: Stacked Area Chart
// Library: muix 7.29.1 | JavaScript 22.23.2
// Quality: 93/100 | Created: 2026-08-17
import { LineChart } from "@mui/x-charts/LineChart";
import { ChartsReferenceLine } from "@mui/x-charts/ChartsReferenceLine";
import Box from "@mui/material/Box";
import Typography from "@mui/material/Typography";

const t = window.ANYPLOT_TOKENS;

// --- Data (in-memory, deterministic) ----------------------------------------

// Tiny fixed-seed LCG — the browser has no seeded RNG
function lcg(seed: number) {
  let s = seed >>> 0;
  return () => {
    s = (Math.imul(1664525, s) + 1013904223) >>> 0;
    return s / 4294967295;
  };
}
const rand = lcg(42);

// Monthly website traffic sources, Jan 2024 – Dec 2025 (24 months)
const MONTHS = [
  "Jan",
  "Feb",
  "Mar",
  "Apr",
  "May",
  "Jun",
  "Jul",
  "Aug",
  "Sep",
  "Oct",
  "Nov",
  "Dec",
];
const dates = Array.from({ length: 24 }, (_, i) => new Date(2024, i, 1));

// Series ordered largest → smallest so the biggest source stacks at the base
const organicSearch = dates.map((_, i) =>
  Math.round(
    4200 +
      i * 55 +
      300 * Math.sin(((i - 6) * Math.PI) / 6) +
      (rand() - 0.5) * 200,
  ),
);
const direct = dates.map((_, i) =>
  Math.round(
    2100 +
      i * 22 +
      120 * Math.sin(((i - 3) * Math.PI) / 6) +
      (rand() - 0.5) * 140,
  ),
);
const referral = dates.map((_, i) =>
  Math.round(
    1150 + i * 9 + 80 * Math.sin(((i - 9) * Math.PI) / 6) + (rand() - 0.5) * 90,
  ),
);
const social = dates.map((_, i) =>
  Math.round(
    650 + i * 30 + 150 * Math.sin((i * Math.PI) / 6) + (rand() - 0.5) * 110,
  ),
);

// Storytelling aids: the cumulative-total average (reference line) and the
// fastest-growing channel's overall lift (callout), both derived from the data.
const totals = dates.map(
  (_, i) => organicSearch[i] + direct[i] + referral[i] + social[i],
);
const avgTotal = totals.reduce((sum, v) => sum + v, 0) / totals.length;
const socialGrowthPct = Math.round(
  ((social[social.length - 1] - social[0]) / social[0]) * 100,
);

const TITLE =
  "Website Traffic Sources · area-stacked · javascript · muix · anyplot.ai";
const TITLE_H = 58;

// --- Chart (default-exported component — the harness mounts it) ------------

export default function Chart() {
  const { width, height } = window.ANYPLOT_SIZE;

  return (
    <Box
      sx={{
        width,
        height,
        bgcolor: t.pageBg,
        display: "flex",
        flexDirection: "column",
      }}
    >
      <Box
        sx={{
          height: TITLE_H,
          display: "flex",
          alignItems: "center",
          justifyContent: "space-between",
          px: "40px",
          pt: "10px",
        }}
      >
        <Typography
          sx={{
            color: t.ink,
            fontSize: "22px",
            fontWeight: 600,
            lineHeight: 1,
          }}
        >
          {TITLE}
        </Typography>
        <Box
          sx={{
            display: "flex",
            alignItems: "center",
            gap: "8px",
            bgcolor: t.elevatedBg,
            borderRadius: "6px",
            px: "12px",
            py: "6px",
          }}
        >
          <Box
            sx={{
              width: "10px",
              height: "10px",
              borderRadius: "50%",
              bgcolor: t.palette[3],
            }}
          />
          <Typography
            sx={{
              color: t.inkSoft,
              fontSize: "13px",
              fontWeight: 500,
              lineHeight: 1,
            }}
          >
            {`Social: fastest-growing channel, +${socialGrowthPct}% since Jan 2024`}
          </Typography>
        </Box>
      </Box>

      <LineChart
        width={width}
        height={height - TITLE_H}
        skipAnimation
        colors={t.palette.slice(0, 4)}
        grid={{ horizontal: true }}
        xAxis={[
          {
            data: dates,
            scaleType: "time",
            valueFormatter: (v: Date) =>
              `${MONTHS[v.getMonth()]} ${v.getFullYear()}`,
            tickNumber: 8,
            label: "Month",
          },
        ]}
        yAxis={[
          {
            min: 0,
            label: "Monthly Visits",
            valueFormatter: (v: number) => `${Math.round(v / 1000)}k`,
          },
        ]}
        series={[
          {
            id: "organic",
            data: organicSearch,
            label: "Organic Search",
            stack: "traffic",
            area: true,
            showMark: false,
            curve: "monotoneX",
          },
          {
            id: "direct",
            data: direct,
            label: "Direct",
            stack: "traffic",
            area: true,
            showMark: false,
            curve: "monotoneX",
          },
          {
            id: "referral",
            data: referral,
            label: "Referral",
            stack: "traffic",
            area: true,
            showMark: false,
            curve: "monotoneX",
          },
          {
            id: "social",
            data: social,
            label: "Social",
            stack: "traffic",
            area: true,
            showMark: false,
            curve: "monotoneX",
          },
        ]}
        margin={{ top: 20, bottom: 90, left: 90, right: 40 }}
        sx={{
          "& .MuiAreaElement-root": { fillOpacity: 0.82 },
          "& .MuiLineElement-root": { strokeWidth: 2 },
          "& .MuiLineElement-series-social": { strokeWidth: 3 },
          "& .MuiChartsAxis-tickLabel": { fontSize: "14px" },
          "& .MuiChartsAxis-label": { fontSize: "16px" },
          "& .MuiChartsLegend-label": { fontSize: "14px" },
          "& .MuiChartsGrid-line": { stroke: t.grid, strokeWidth: 1 },
        }}
        slotProps={{
          legend: {
            position: { vertical: "bottom", horizontal: "middle" },
            itemMarkWidth: 20,
            itemMarkHeight: 4,
          },
        }}
      >
        <ChartsReferenceLine
          y={avgTotal}
          label={`Avg total: ${(avgTotal / 1000).toFixed(1)}k`}
          labelAlign="start"
          lineStyle={{
            stroke: t.inkSoft,
            strokeDasharray: "4 4",
            strokeWidth: 1.5,
          }}
          labelStyle={{
            fill: t.inkSoft,
            fontSize: 13,
            fontWeight: 600,
            stroke: t.pageBg,
            strokeWidth: 5,
            paintOrder: "stroke",
          }}
        />
      </LineChart>
    </Box>
  );
}
Runnable source as JSON, for any HTTP client: https://api.anyplot.ai/specs/area-stacked/muix/code. Any spec id and library id listed in llms-full.txt fit the same URL shape; every URL below is complete and callable.
{
  "spec_id": "area-stacked",
  "language": "javascript",
  "library": "muix",
  "page": "https://anyplot.ai/area-stacked/javascript/muix",
  "hub": "https://anyplot.ai/area-stacked",
  "code_json": "https://api.anyplot.ai/specs/area-stacked/muix/code",
  "spec_json": "https://api.anyplot.ai/specs/area-stacked",
  "render_light_png": "https://storage.googleapis.com/anyplot-images/plots/area-stacked/javascript/muix/plot-light.png",
  "render_dark_png": "https://storage.googleapis.com/anyplot-images/plots/area-stacked/javascript/muix/plot-dark.png",
  "interactive_light_html": "https://storage.googleapis.com/anyplot-images/plots/area-stacked/javascript/muix/plot-light.html",
  "interactive_dark_html": "https://storage.googleapis.com/anyplot-images/plots/area-stacked/javascript/muix/plot-dark.html",
  "quality_score": 93.0,
  "license": "MIT",
  "guide": "https://anyplot.ai/llms.txt"
}
Part of Stacked Area Chart on anyplot.ai.