Source code in 15 libraries — Python: Altair, Bokeh, lets-plot, Matplotlib, Plotly, plotnine, Pygal, Seaborn; R: ggplot2; Julia: Makie.jl; JavaScript: Chart.js, D3.js, Apache ECharts, Highcharts, MUI X Charts.
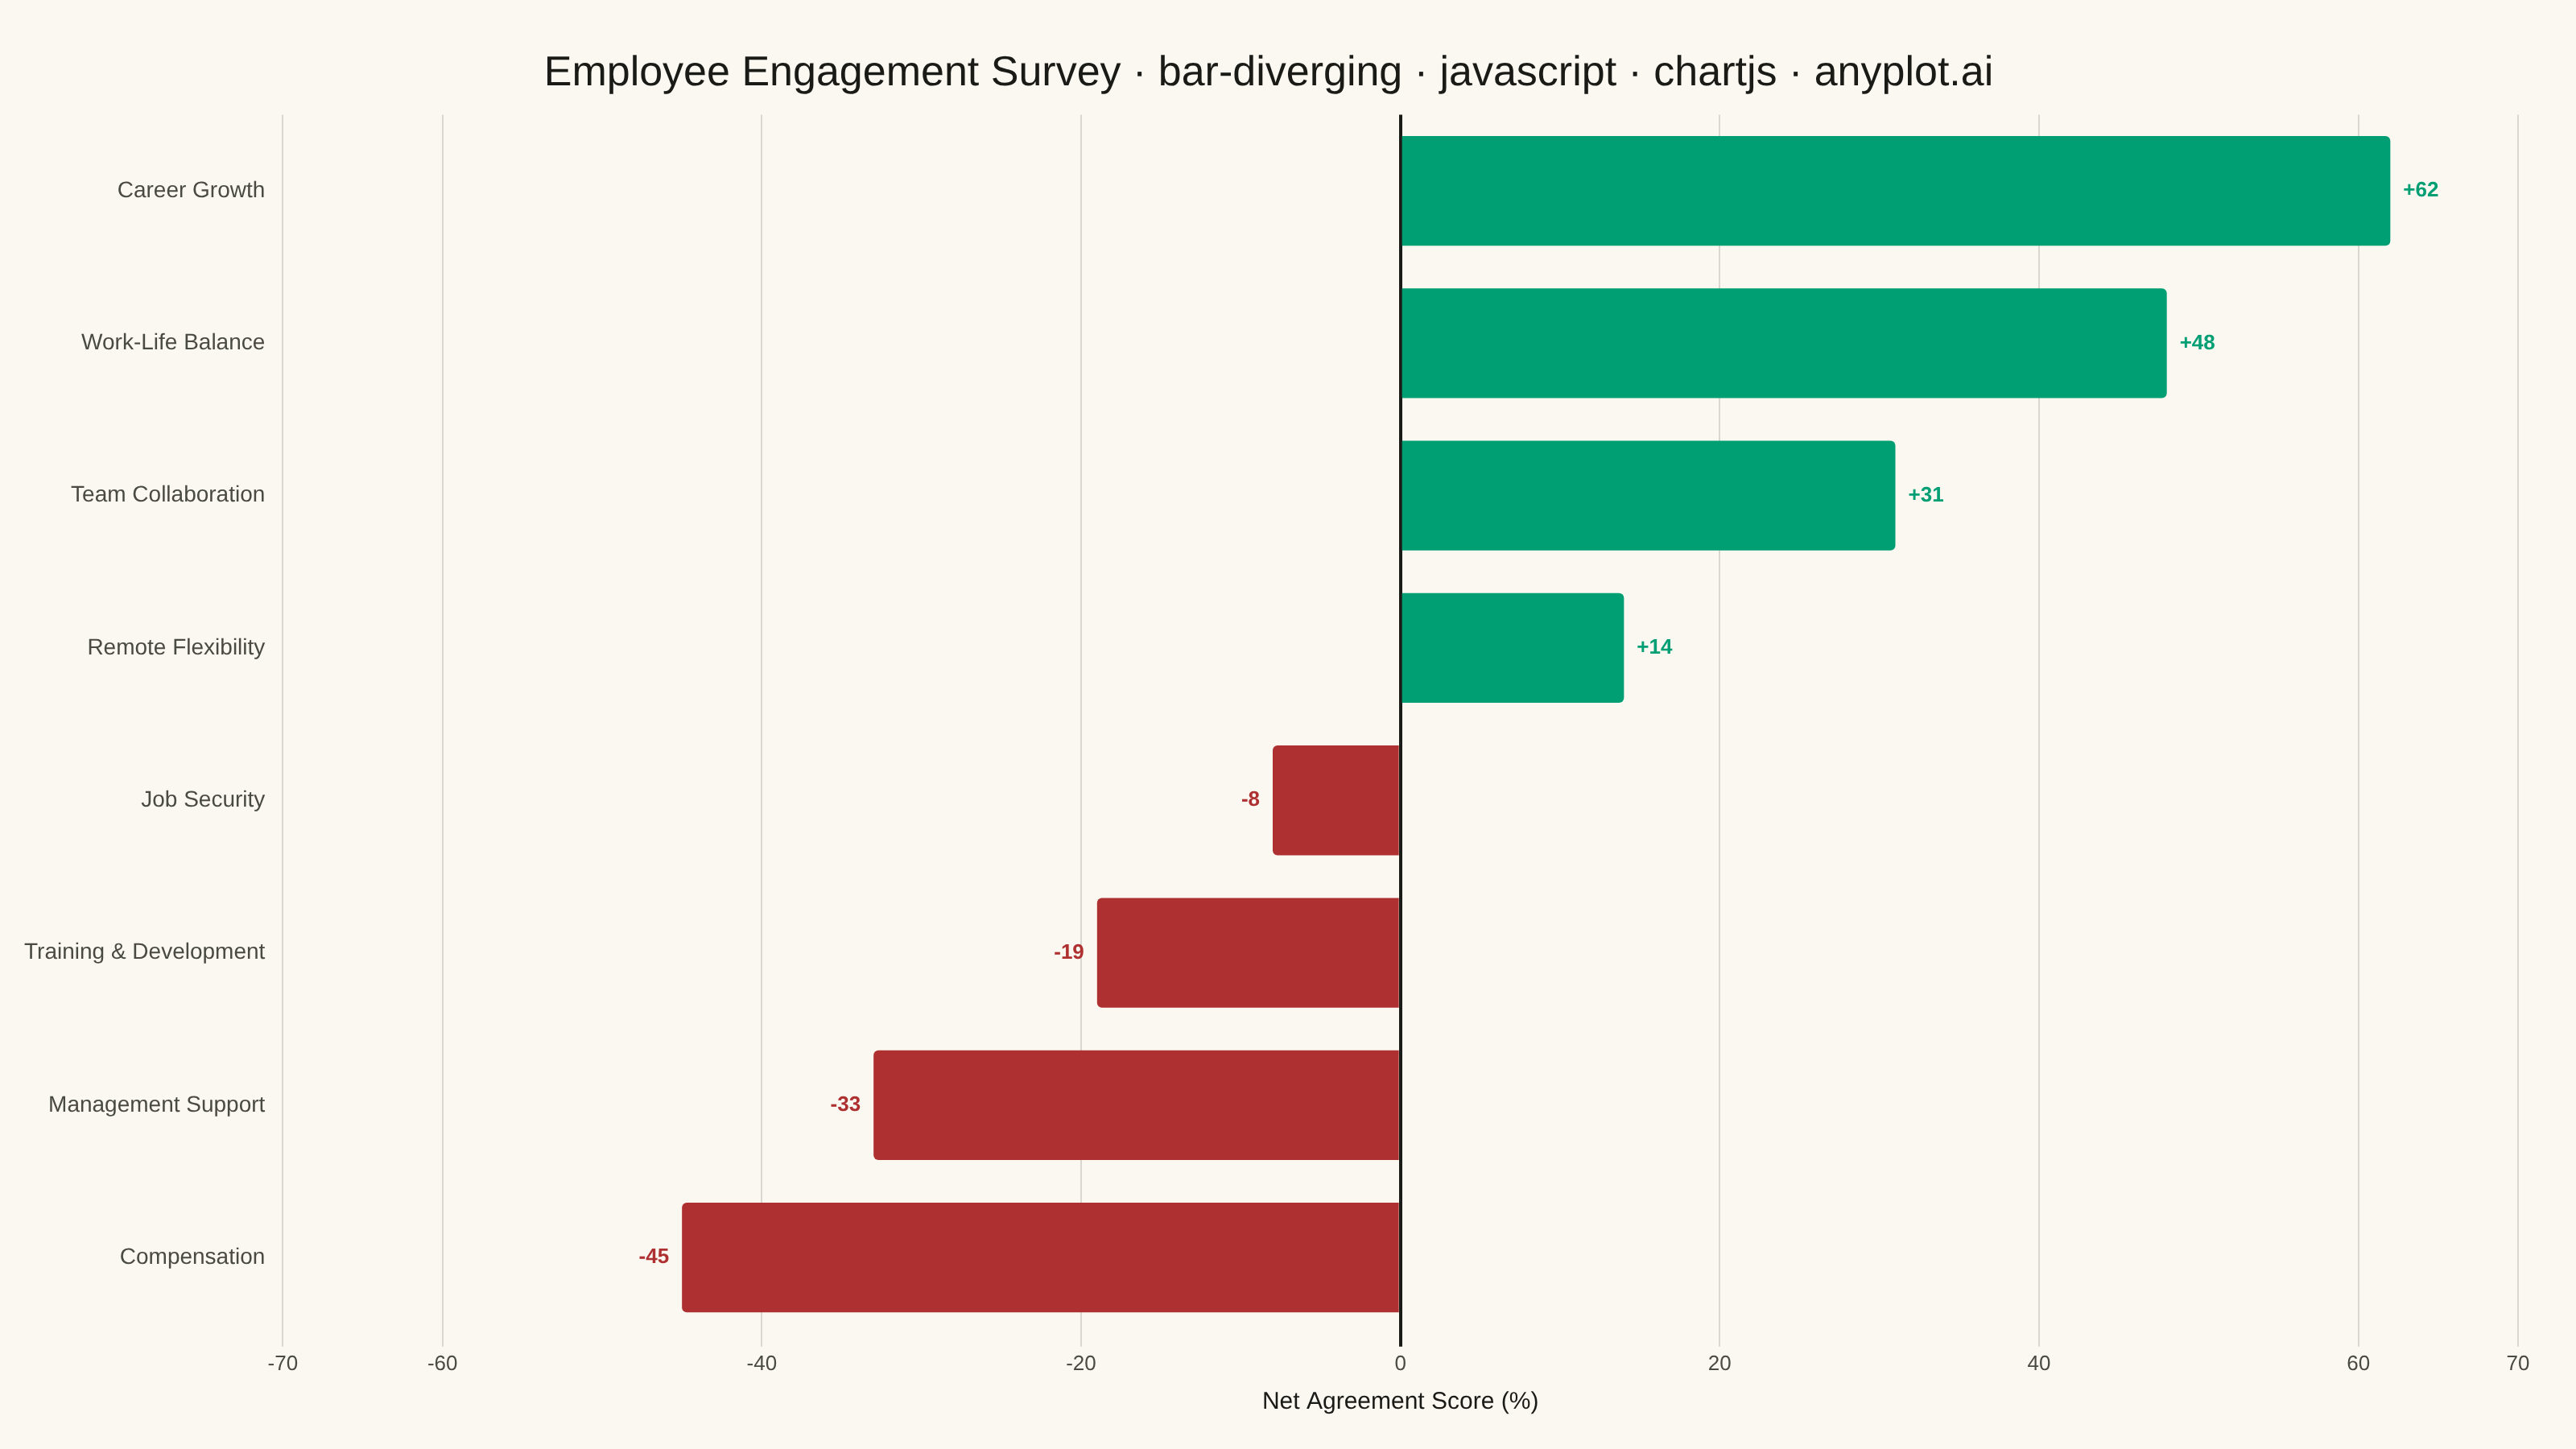
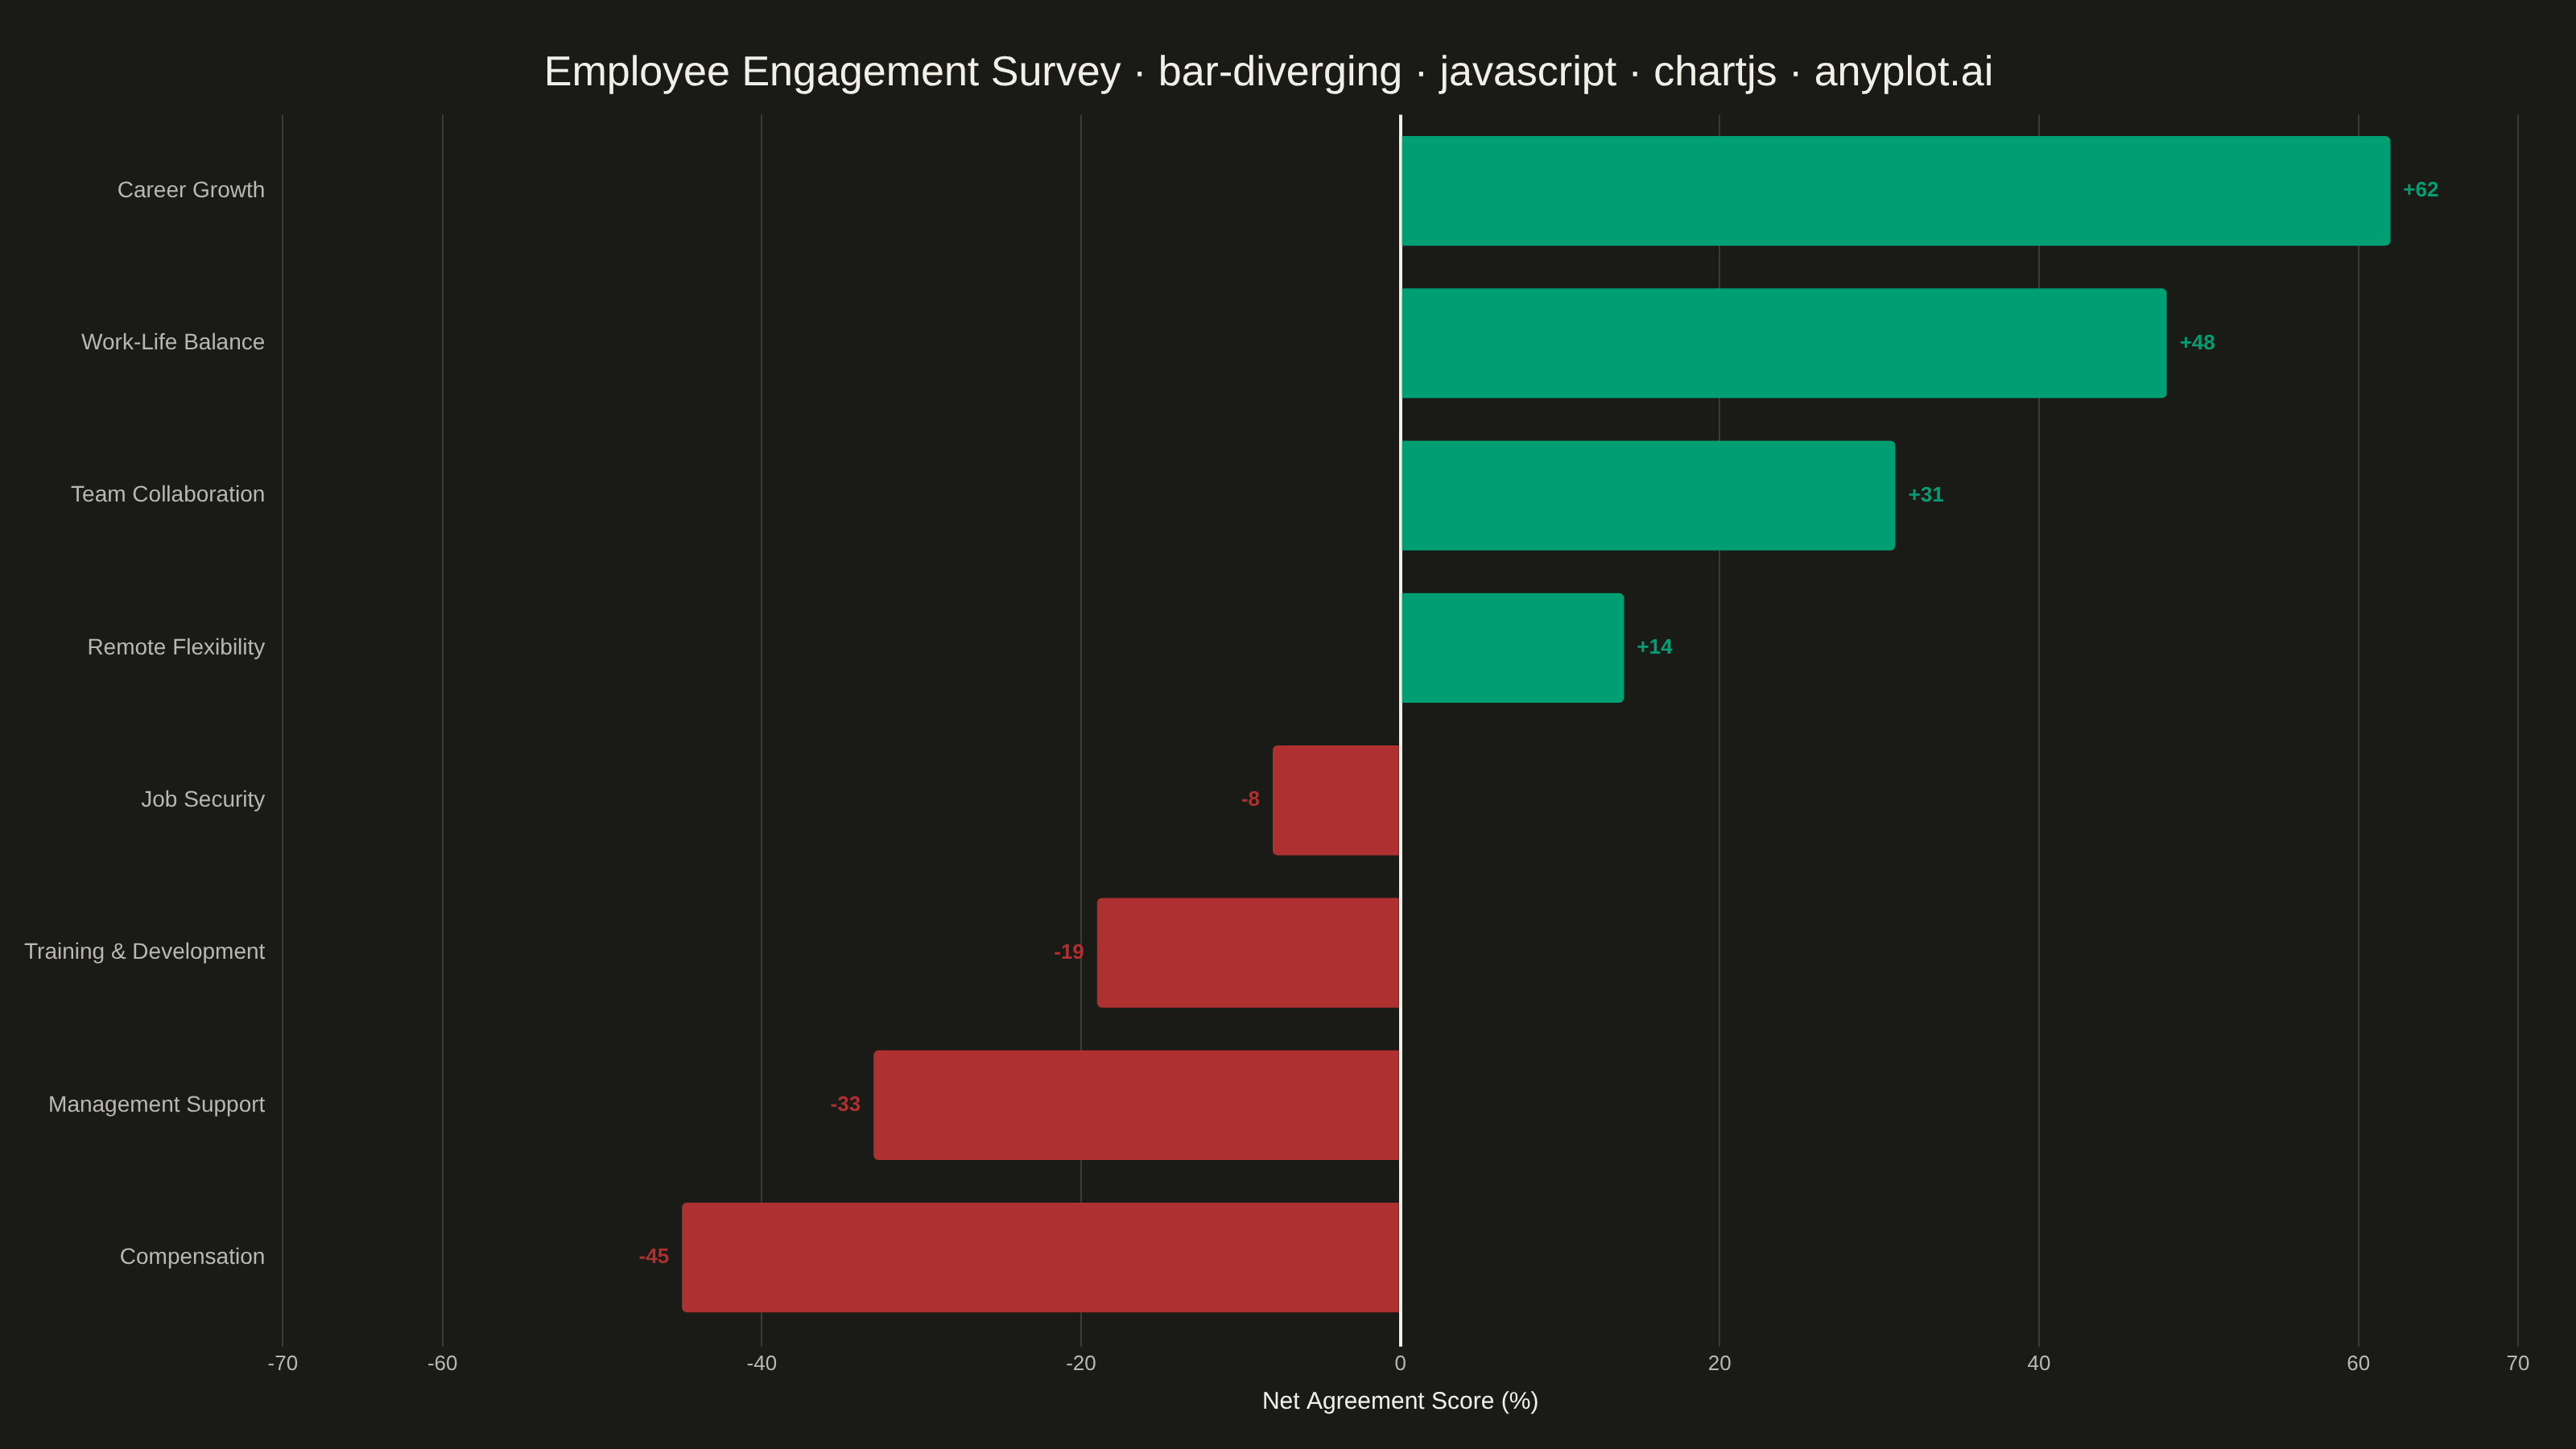
A diverging bar chart displays bars extending in opposite directions from a central baseline, typically at zero. This visualization is ideal for comparing positive and negative values, showing responses above and below a neutral point, or contrasting opposing categories. Different colors distinguish positive from negative values, making it easy to identify magnitude and direction at a glance.
Preview render from the Chart.js implementation.