The same plot in 14 other libraries — JavaScript: Chart.js, Apache ECharts, Highcharts, MUI X Charts; Python: Altair, Bokeh, lets-plot, Matplotlib, Plotly, plotnine, Pygal, Seaborn; R: ggplot2; Julia: Makie.jl. Compare all 15 side by side: Diverging Bar Chart in Python, R, Julia and JavaScript.
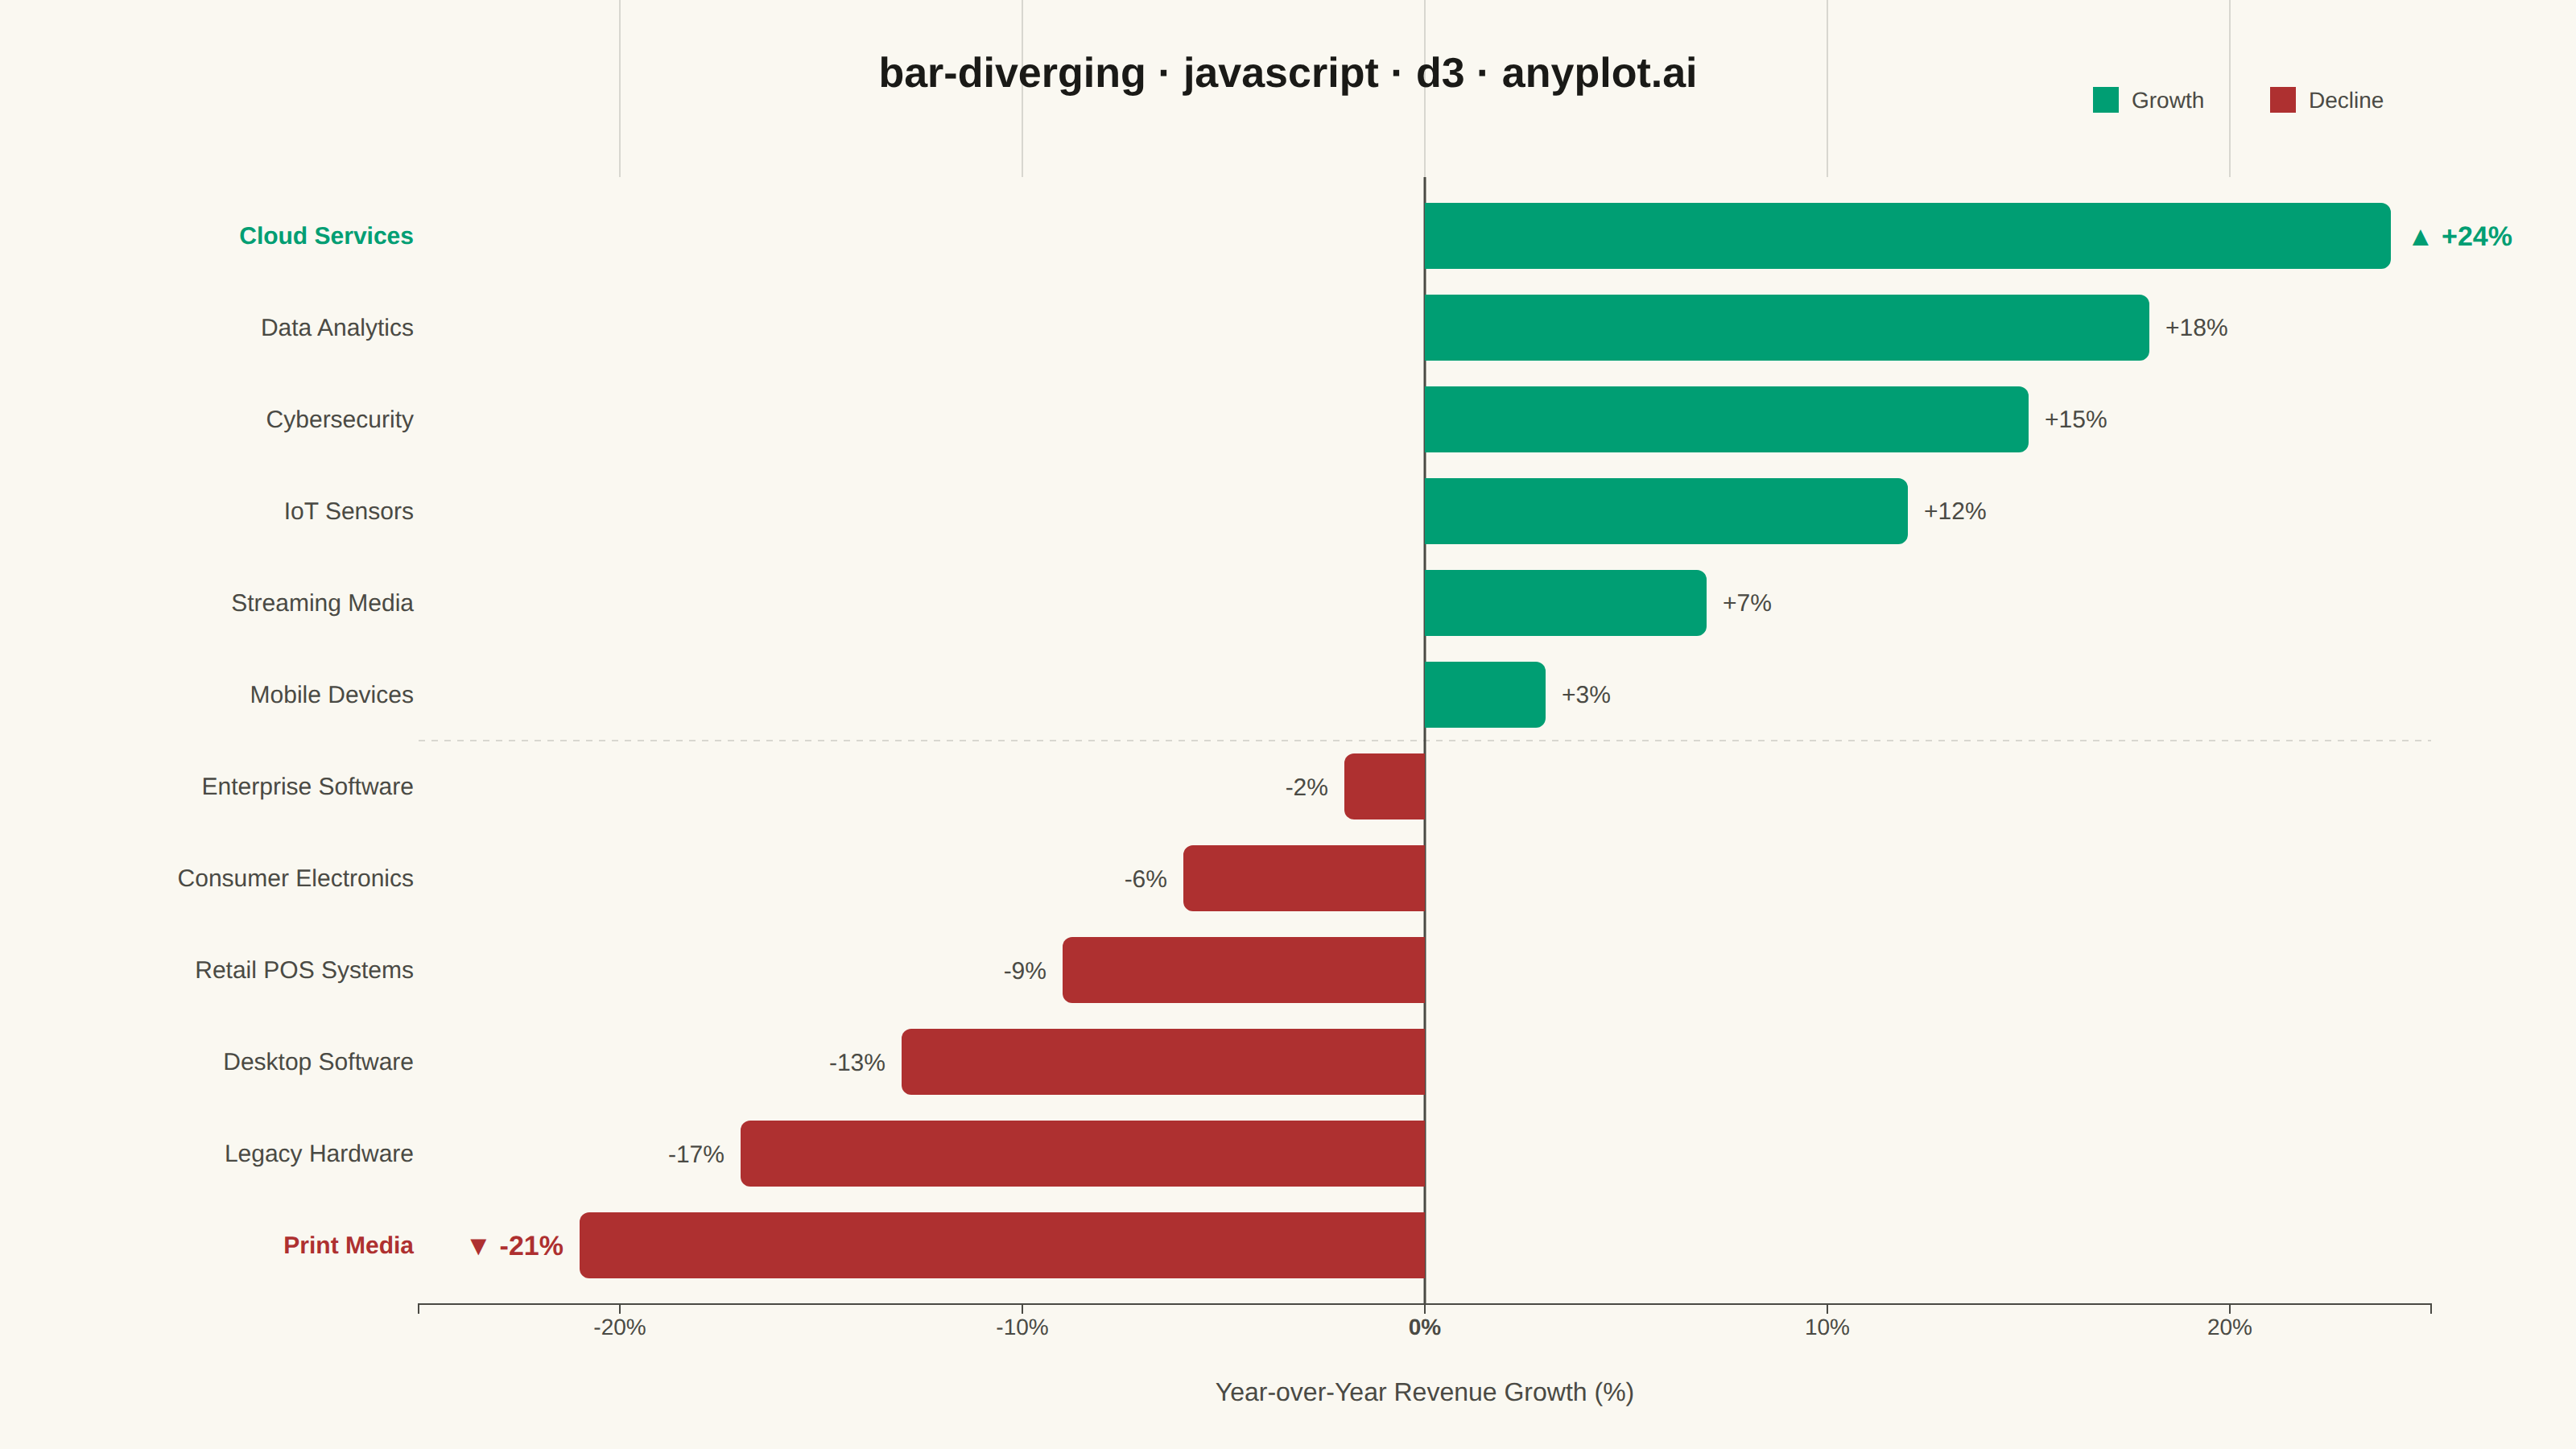
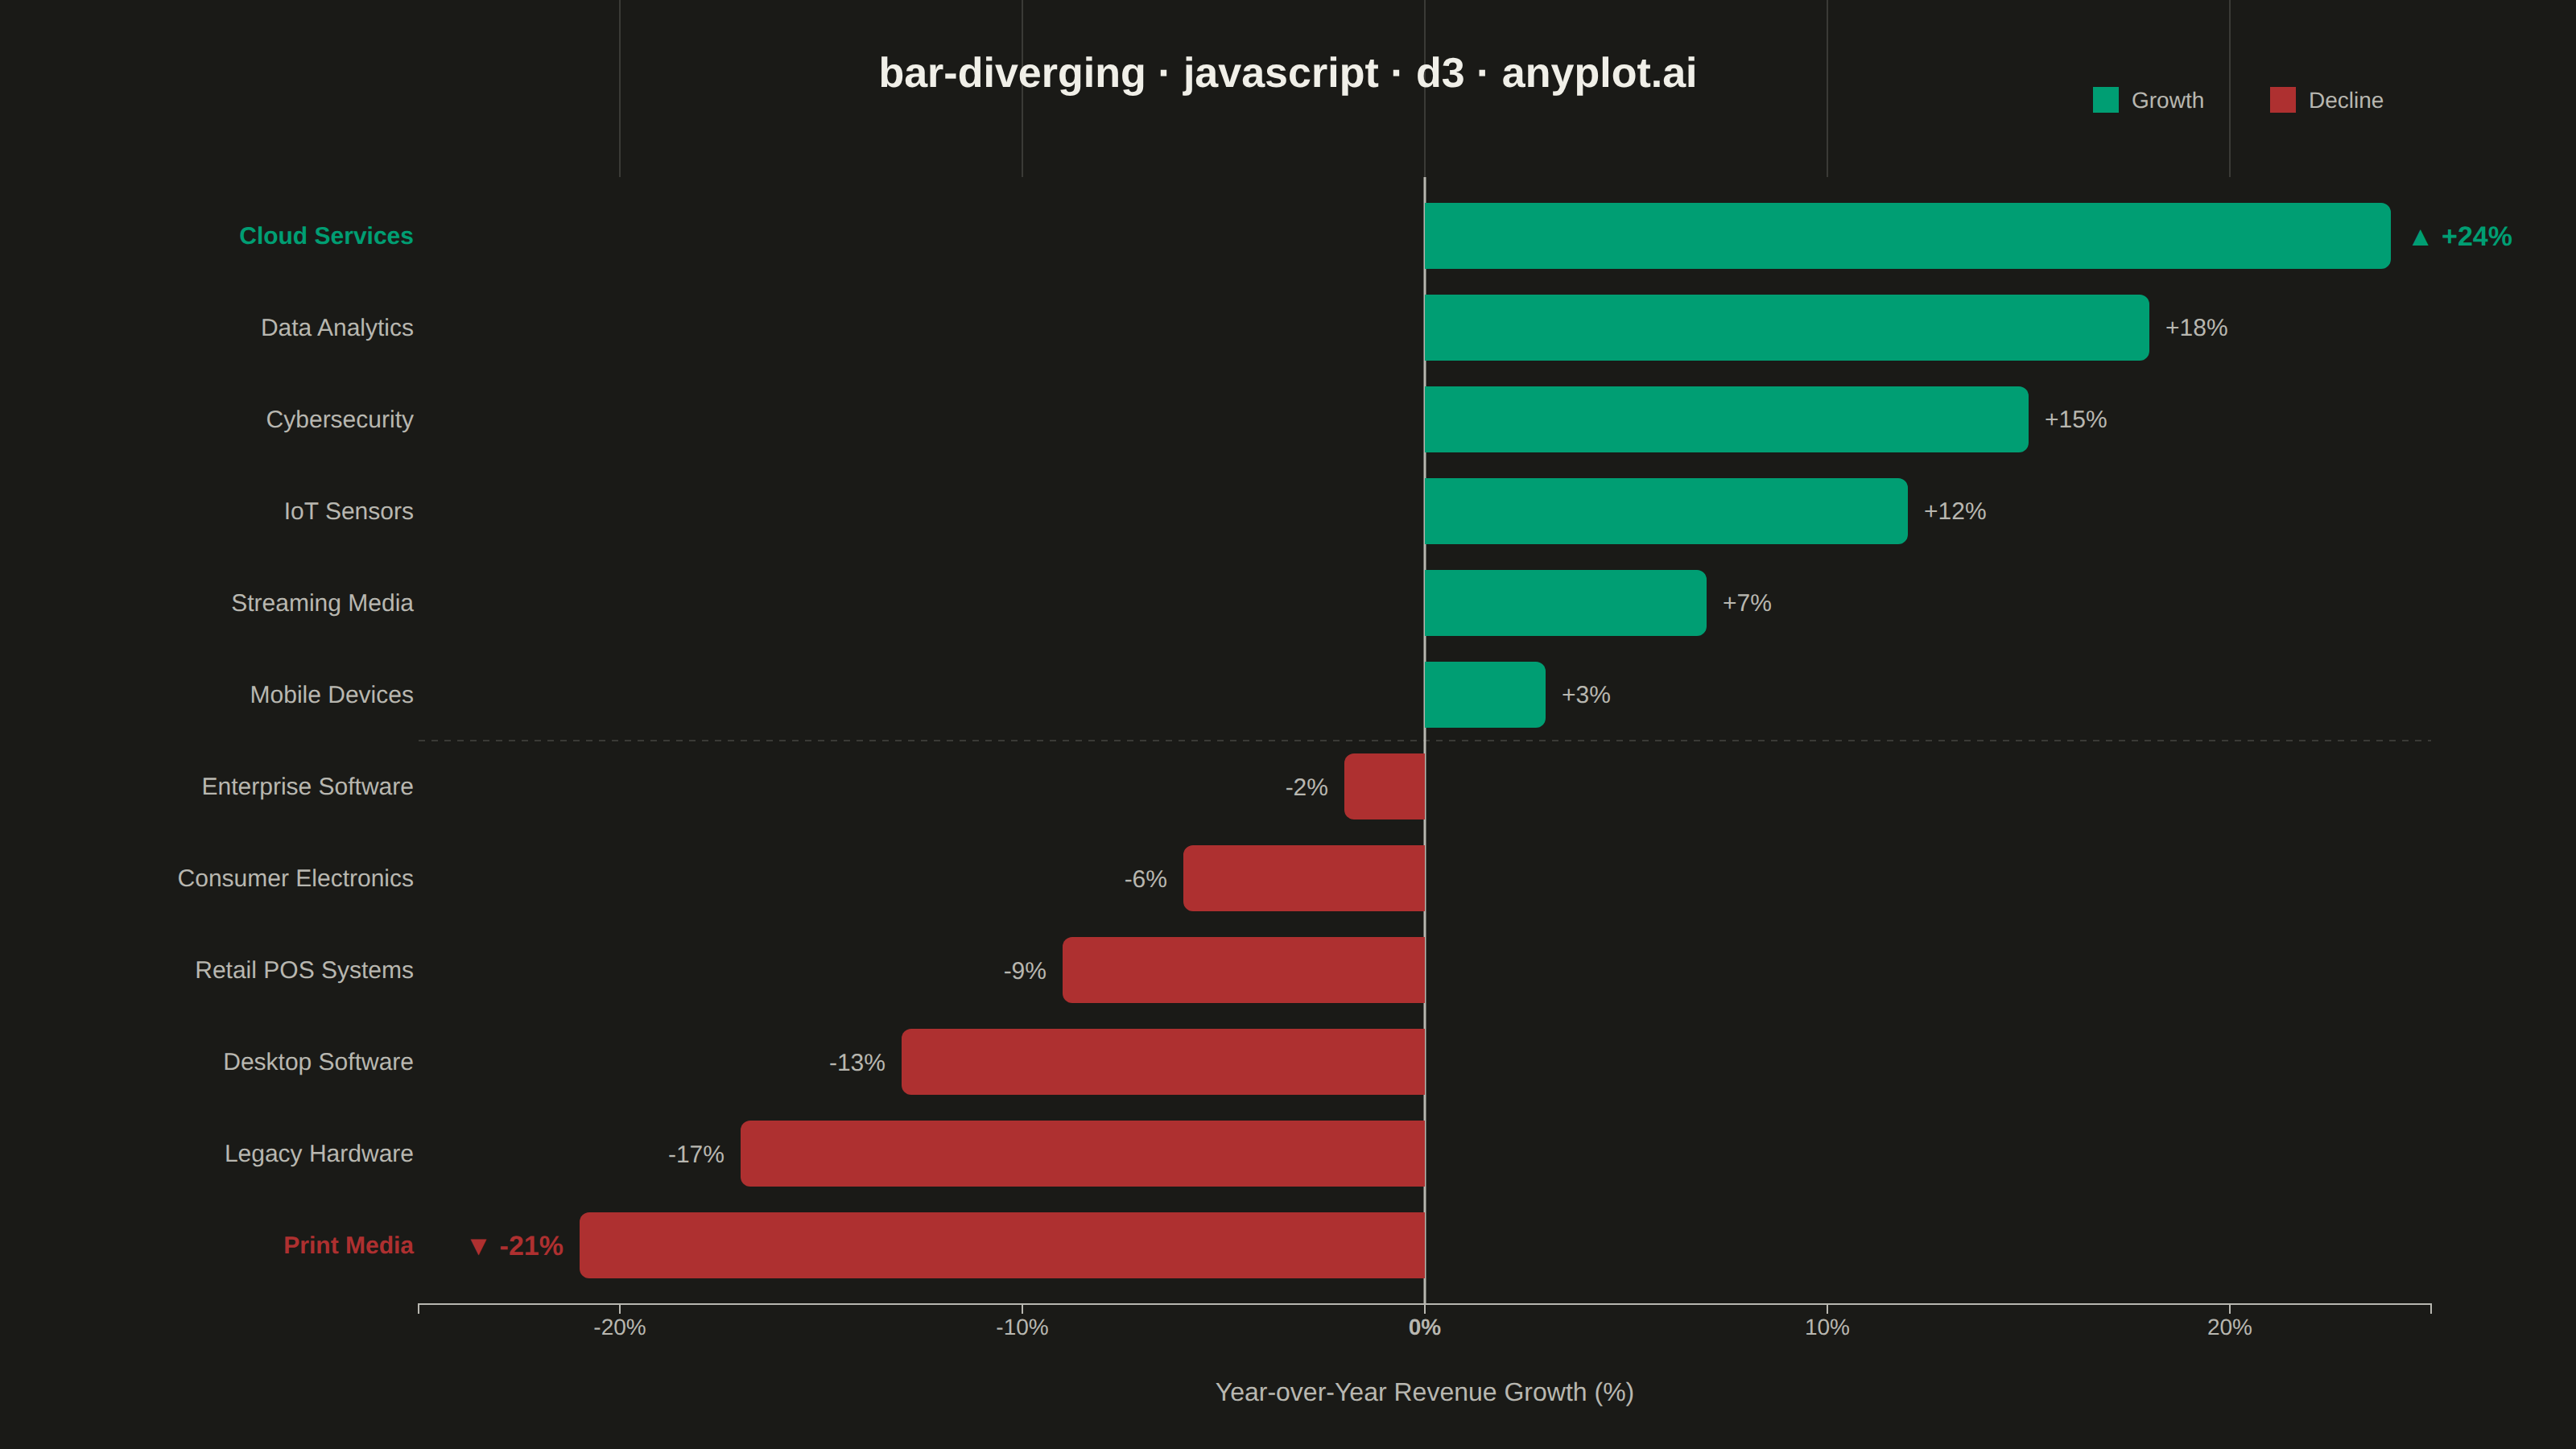
A diverging bar chart displays bars extending in opposite directions from a central baseline, typically at zero. This visualization is ideal for comparing positive and negative values, showing responses above and below a neutral point, or contrasting opposing categories. Different colors distinguish positive from negative values, making it easy to identify magnitude and direction at a glance.
// anyplot.ai
// bar-diverging: Diverging Bar Chart
// Library: d3 7.9.0 | JavaScript 22.23.2
// Quality: 94/100 | Created: 2026-08-18

const t = window.ANYPLOT_TOKENS;
const { width, height } = window.ANYPLOT_SIZE;
const margin = { top: 110, right: 90, bottom: 90, left: 260 };
const iw = width - margin.left - margin.right;
const ih = height - margin.top - margin.bottom;

// --- Data: year-over-year revenue growth by product line (%) ---------------
const productLines = [
  { category: "Cloud Services", value: 24 },
  { category: "Data Analytics", value: 18 },
  { category: "Cybersecurity", value: 15 },
  { category: "IoT Sensors", value: 12 },
  { category: "Streaming Media", value: 7 },
  { category: "Mobile Devices", value: 3 },
  { category: "Enterprise Software", value: -2 },
  { category: "Consumer Electronics", value: -6 },
  { category: "Retail POS Systems", value: -9 },
  { category: "Desktop Software", value: -13 },
  { category: "Legacy Hardware", value: -17 },
  { category: "Print Media", value: -21 },
];
const topGrower = productLines[0];
const topDecliner = productLines[productLines.length - 1];

// --- Custom per-bar transform: rounded outer corner on the value end only,
// square on the zero-baseline end (a fine-grained d3.path/arcTo construction
// a declarative bar-chart API doesn't expose directly). ---------------------
function divergingBarPath(xZero, xValue, yTop, barHeight, radius) {
  const isPositive = xValue >= xZero;
  const left = Math.min(xZero, xValue);
  const right = Math.max(xZero, xValue);
  const r = Math.min(radius, barHeight / 2, right - left);
  const path = d3.path();
  if (isPositive) {
    path.moveTo(left, yTop);
    path.lineTo(right - r, yTop);
    path.arcTo(right, yTop, right, yTop + r, r);
    path.lineTo(right, yTop + barHeight - r);
    path.arcTo(right, yTop + barHeight, right - r, yTop + barHeight, r);
    path.lineTo(left, yTop + barHeight);
  } else {
    path.moveTo(right, yTop);
    path.lineTo(left + r, yTop);
    path.arcTo(left, yTop, left, yTop + r, r);
    path.lineTo(left, yTop + barHeight - r);
    path.arcTo(left, yTop + barHeight, left + r, yTop + barHeight, r);
    path.lineTo(right, yTop + barHeight);
  }
  path.closePath();
  return path.toString();
}

// --- SVG mount ---------------------------------------------------------------
const svg = d3.select("#container").append("svg").attr("width", width).attr("height", height);
const g = svg.append("g").attr("transform", `translate(${margin.left},${margin.top})`);

// --- Scales -------------------------------------------------------------------
const maxAbs = d3.max(productLines, (d) => Math.abs(d.value));
const x = d3.scaleLinear().domain([-maxAbs, maxAbs]).nice().range([0, iw]);
const y = d3
  .scaleBand()
  .domain(productLines.map((d) => d.category))
  .range([0, ih])
  .padding(0.28);

// --- Gridlines (value axis only, trimmed to major ticks) -----------------------
g.append("g")
  .attr("class", "grid")
  .call(d3.axisBottom(x).ticks(6).tickSize(-ih).tickFormat(""))
  .call((sel) => sel.select(".domain").remove())
  .selectAll("line")
  .attr("stroke", t.grid);

// --- Divider between the growth and decline groups (data is sorted, so the
// sign change happens once) ------------------------------------------------
const growthCount = productLines.filter((d) => d.value >= 0).length;
if (growthCount > 0 && growthCount < productLines.length) {
  const lastGrowthY = y(productLines[growthCount - 1].category) + y.bandwidth();
  const firstDeclineY = y(productLines[growthCount].category);
  const dividerY = (lastGrowthY + firstDeclineY) / 2;
  g.append("line")
    .attr("x1", 0)
    .attr("x2", iw)
    .attr("y1", dividerY)
    .attr("y2", dividerY)
    .attr("stroke", t.grid)
    .attr("stroke-width", 1)
    .attr("stroke-dasharray", "4,4");
}

// --- Zero baseline --------------------------------------------------------------
g.append("line")
  .attr("x1", x(0))
  .attr("x2", x(0))
  .attr("y1", 0)
  .attr("y2", ih)
  .attr("stroke", t.inkSoft)
  .attr("stroke-width", 1.5);

// --- Bars (rounded on the value-tip end via the custom path generator above) ---
g.selectAll(".bar")
  .data(productLines)
  .join("path")
  .attr("class", "bar")
  .attr("d", (d) => divergingBarPath(x(0), x(d.value), y(d.category), y.bandwidth(), 6))
  .attr("fill", (d) => (d.value >= 0 ? t.palette[0] : t.palette[4]));

// --- Value labels at bar tips — the strongest grower/decliner is called out
// with a bolder, larger label and a directional marker ---------------------
g.selectAll(".value-label")
  .data(productLines)
  .join("text")
  .attr("class", "value-label")
  .attr("x", (d) => x(d.value) + (d.value >= 0 ? 10 : -10))
  .attr("y", (d) => y(d.category) + y.bandwidth() / 2)
  .attr("dy", "0.35em")
  .attr("text-anchor", (d) => (d.value >= 0 ? "start" : "end"))
  .attr("fill", (d) => (d === topGrower ? t.palette[0] : d === topDecliner ? t.palette[4] : t.inkSoft))
  .style("font-size", (d) => (d === topGrower || d === topDecliner ? "17px" : "15px"))
  .style("font-weight", (d) => (d === topGrower || d === topDecliner ? "700" : "400"))
  .text((d) => {
    const marker = d === topGrower ? "▲ " : d === topDecliner ? "▼ " : "";
    return `${marker}${d.value > 0 ? "+" : ""}${d.value}%`;
  });

// --- Axes -----------------------------------------------------------------------
const xAxis = g
  .append("g")
  .attr("transform", `translate(0,${ih})`)
  .call(d3.axisBottom(x).ticks(6).tickFormat((d) => `${d}%`));
xAxis
  .selectAll("text")
  .attr("fill", t.inkSoft)
  .style("font-size", "14px")
  .style("font-weight", (d) => (d === 0 ? "700" : "400"));
xAxis.selectAll("line").attr("stroke", t.inkSoft);
xAxis.select(".domain").attr("stroke", t.inkSoft);

const yAxis = g.append("g").call(d3.axisLeft(y).tickSize(0));
yAxis
  .selectAll("text")
  .attr("fill", (d) => (d === topGrower.category ? t.palette[0] : d === topDecliner.category ? t.palette[4] : t.inkSoft))
  .style("font-size", "15px")
  .style("font-weight", (d) => (d === topGrower.category || d === topDecliner.category ? "700" : "400"));
yAxis.select(".domain").remove();

// --- Axis label ------------------------------------------------------------------
svg
  .append("text")
  .attr("x", margin.left + iw / 2)
  .attr("y", height - 30)
  .attr("text-anchor", "middle")
  .attr("fill", t.inkSoft)
  .style("font-size", "16px")
  .text("Year-over-Year Revenue Growth (%)");

// --- Legend (growth / decline) ----------------------------------------------------
const legend = svg.append("g").attr("transform", `translate(${width - margin.right - 210},${margin.top - 56})`);
const legendItems = [
  { label: "Growth", color: t.palette[0] },
  { label: "Decline", color: t.palette[4] },
];
legendItems.forEach((item, i) => {
  const row = legend.append("g").attr("transform", `translate(${i * 110},0)`);
  row.append("rect").attr("width", 16).attr("height", 16).attr("fill", item.color);
  row
    .append("text")
    .attr("x", 24)
    .attr("y", 13)
    .attr("fill", t.inkSoft)
    .style("font-size", "14px")
    .text(item.label);
});

// --- Title -------------------------------------------------------------------------
svg
  .append("text")
  .attr("x", width / 2)
  .attr("y", 54)
  .attr("text-anchor", "middle")
  .attr("fill", t.ink)
  .style("font-size", "26px")
  .style("font-weight", "600")
  .text("bar-diverging · javascript · d3 · anyplot.ai");
Runnable source as JSON, for any HTTP client: https://api.anyplot.ai/specs/bar-diverging/d3/code. Any spec id and library id listed in llms-full.txt fit the same URL shape; every URL below is complete and callable.
{
  "spec_id": "bar-diverging",
  "language": "javascript",
  "library": "d3",
  "page": "https://anyplot.ai/bar-diverging/javascript/d3",
  "hub": "https://anyplot.ai/bar-diverging",
  "code_json": "https://api.anyplot.ai/specs/bar-diverging/d3/code",
  "spec_json": "https://api.anyplot.ai/specs/bar-diverging",
  "render_light_png": "https://storage.googleapis.com/anyplot-images/plots/bar-diverging/javascript/d3/plot-light.png",
  "render_dark_png": "https://storage.googleapis.com/anyplot-images/plots/bar-diverging/javascript/d3/plot-dark.png",
  "interactive_light_html": "https://storage.googleapis.com/anyplot-images/plots/bar-diverging/javascript/d3/plot-light.html",
  "interactive_dark_html": "https://storage.googleapis.com/anyplot-images/plots/bar-diverging/javascript/d3/plot-dark.html",
  "quality_score": 94.0,
  "license": "MIT",
  "guide": "https://anyplot.ai/llms.txt"
}
Part of Diverging Bar Chart on anyplot.ai.