The same plot in 14 other libraries — JavaScript: Chart.js, D3.js, Apache ECharts, Highcharts; Python: Altair, Bokeh, lets-plot, Matplotlib, Plotly, plotnine, Pygal, Seaborn; R: ggplot2; Julia: Makie.jl. Compare all 15 side by side: Diverging Bar Chart in Python, R, Julia and JavaScript.
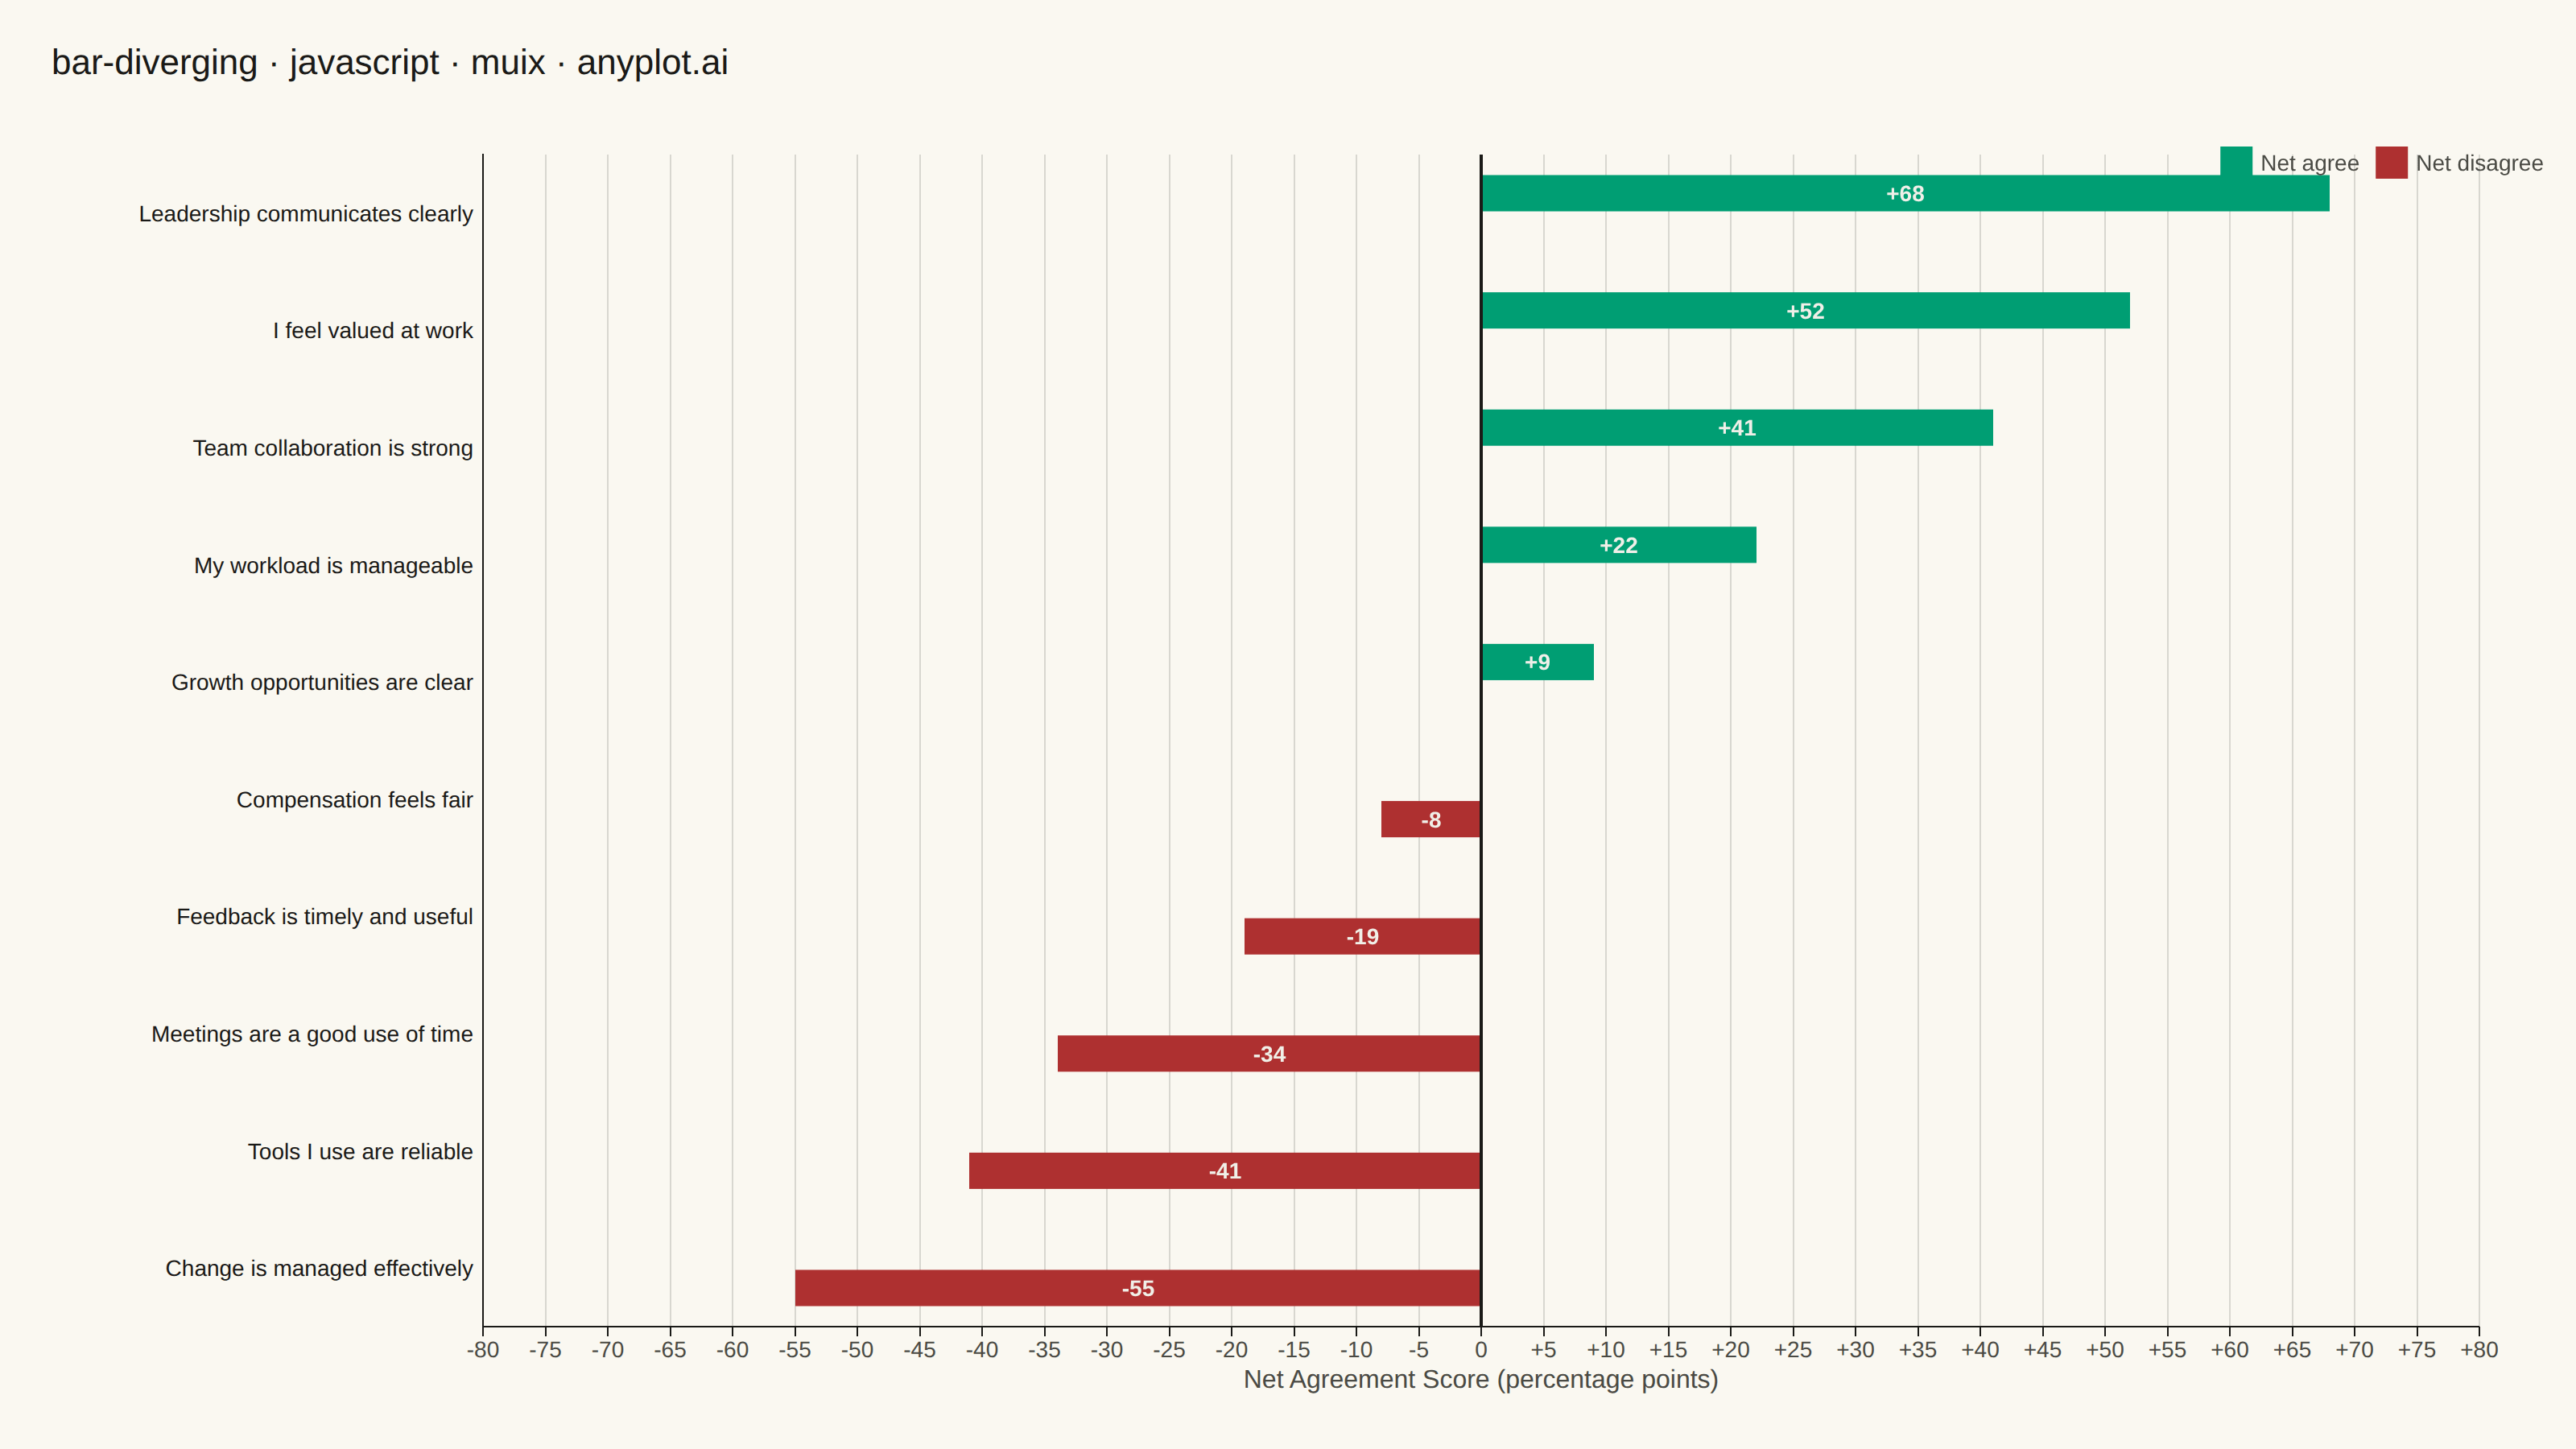
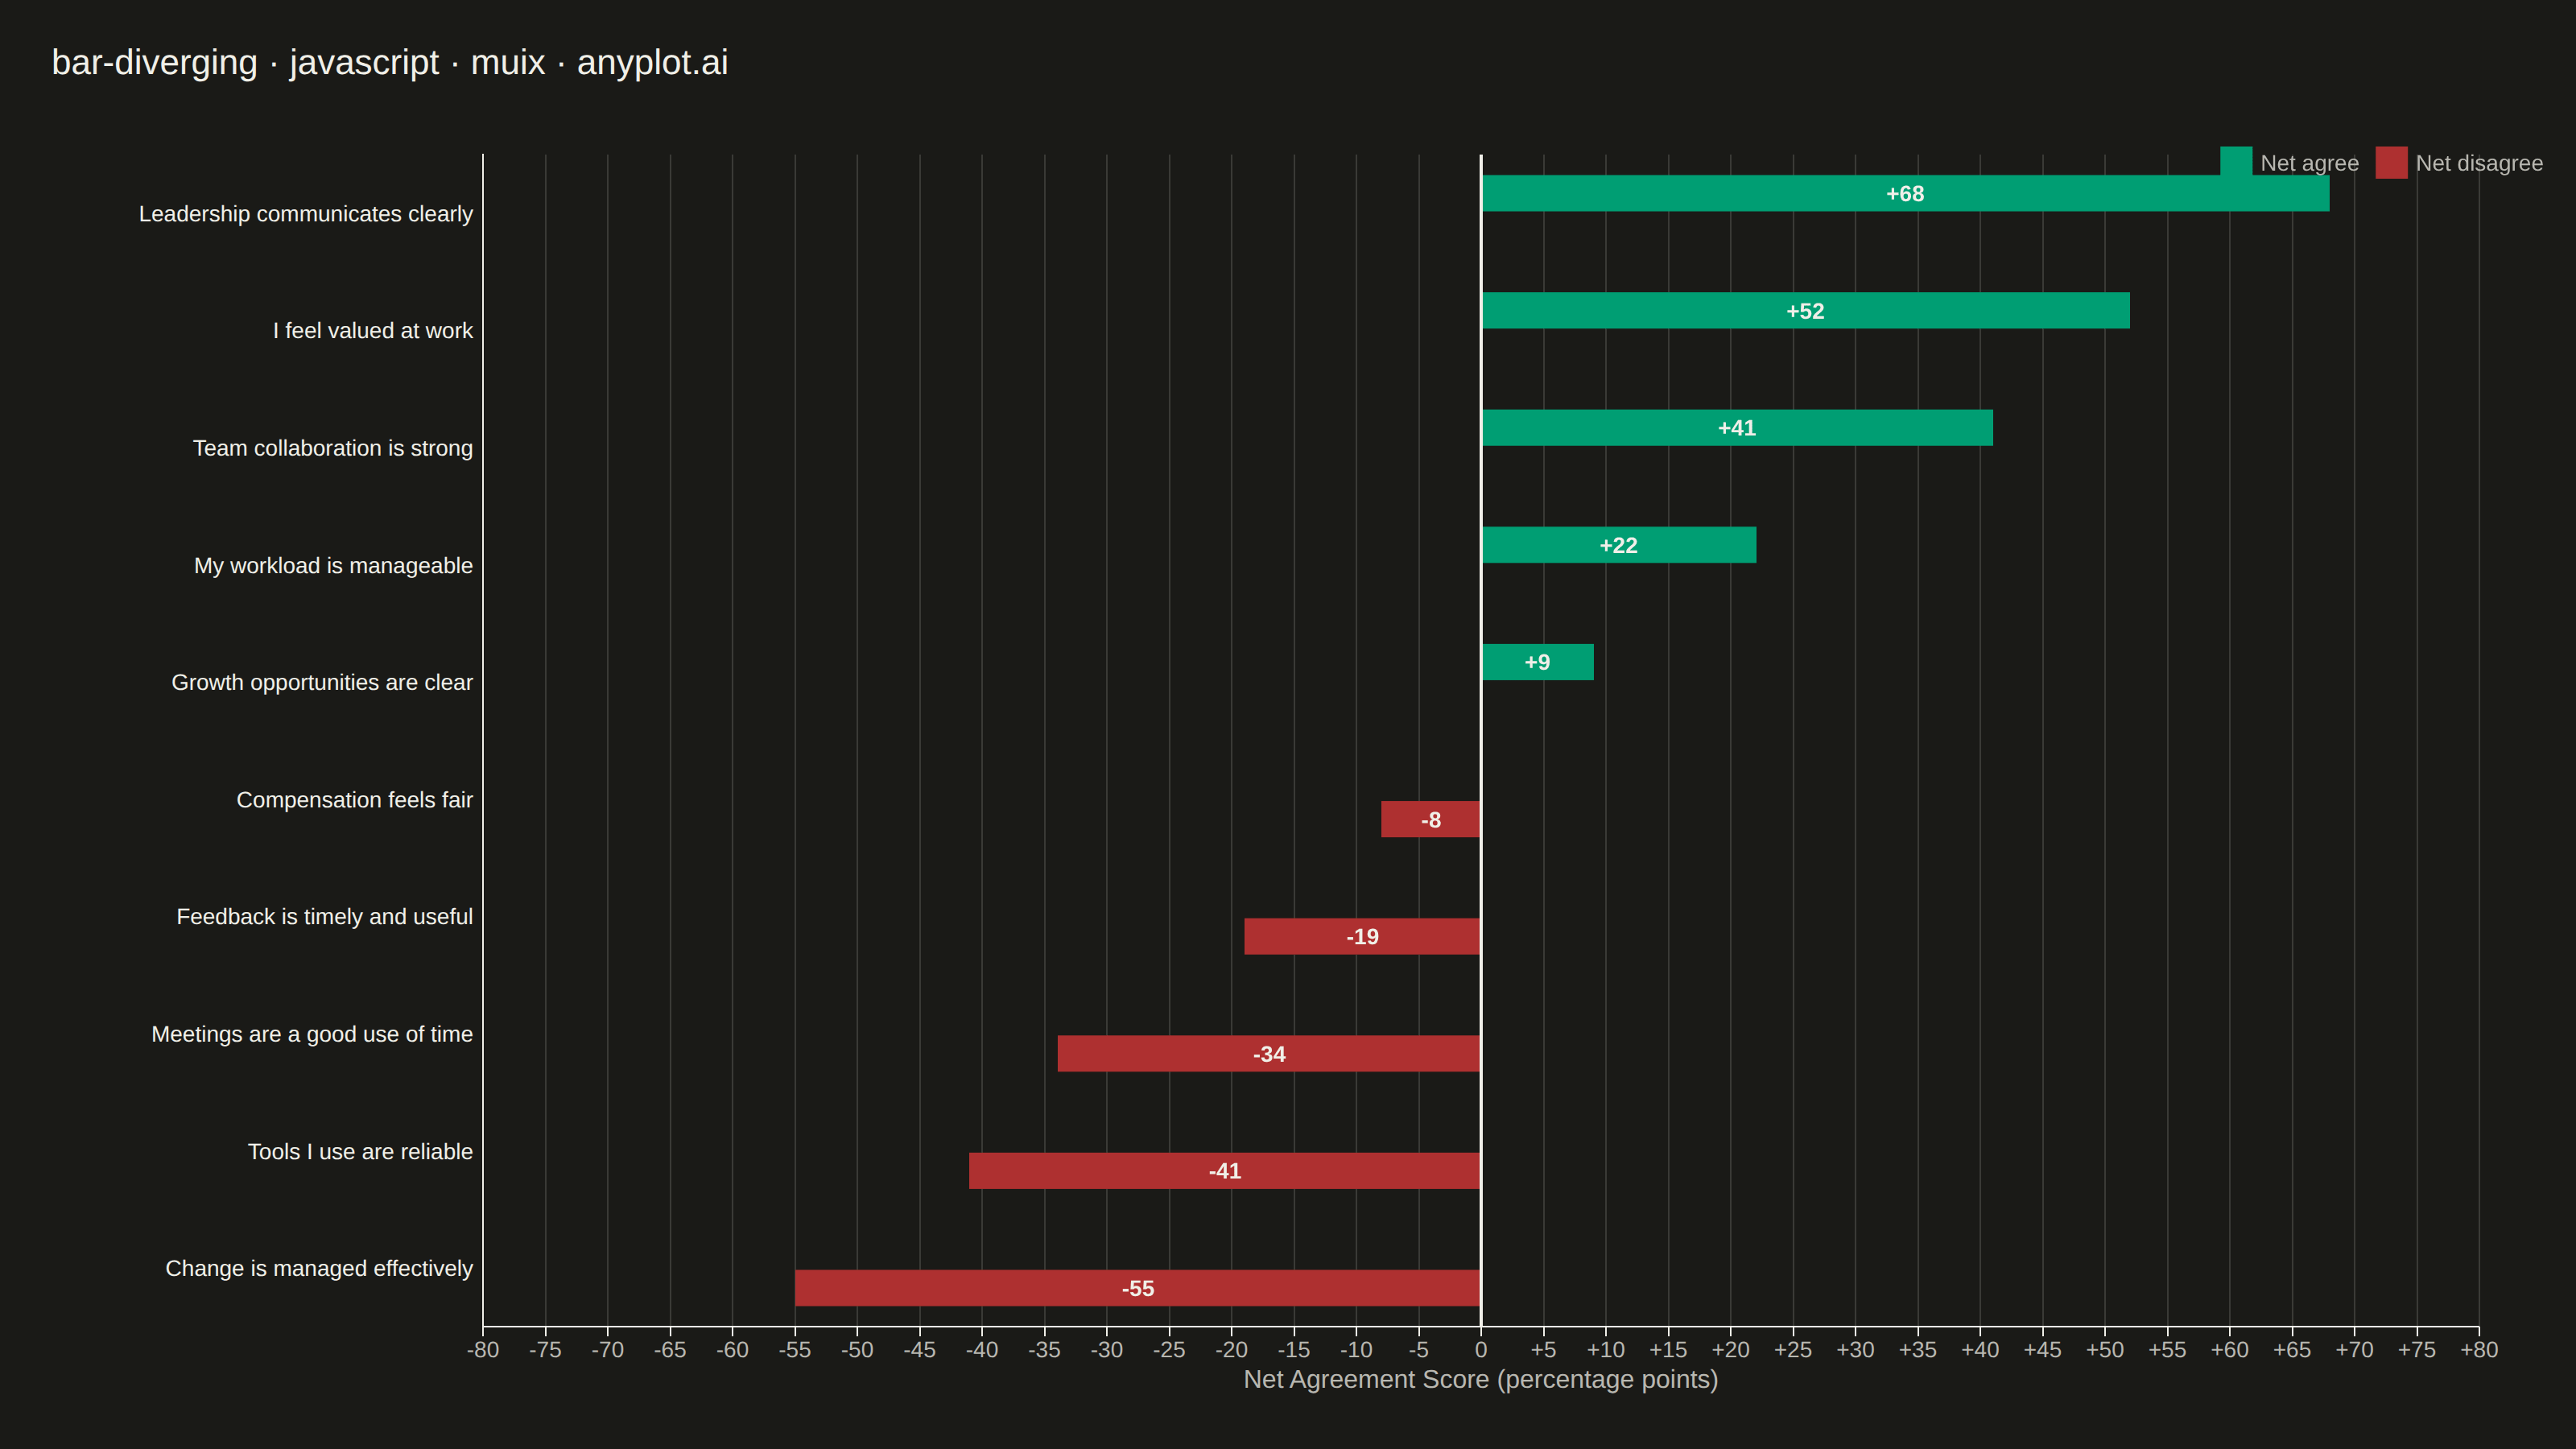
A diverging bar chart displays bars extending in opposite directions from a central baseline, typically at zero. This visualization is ideal for comparing positive and negative values, showing responses above and below a neutral point, or contrasting opposing categories. Different colors distinguish positive from negative values, making it easy to identify magnitude and direction at a glance.
// anyplot.ai
// bar-diverging: Diverging Bar Chart
// Library: muix 7.29.1 | JavaScript 22.23.2
// Quality: 91/100 | Created: 2026-08-18
import { BarChart } from "@mui/x-charts/BarChart";
import { ChartsReferenceLine } from "@mui/x-charts/ChartsReferenceLine";
import Box from "@mui/material/Box";
import Typography from "@mui/material/Typography";

const t = window.ANYPLOT_TOKENS;

// --- Data (in-memory, deterministic): employee engagement survey ------------
// Net agreement score = % agree − % disagree per statement, sorted descending
// so the pattern (what's working vs. what isn't) reads top to bottom.
const statements = [
  "Leadership communicates clearly",
  "I feel valued at work",
  "Team collaboration is strong",
  "My workload is manageable",
  "Growth opportunities are clear",
  "Compensation feels fair",
  "Feedback is timely and useful",
  "Meetings are a good use of time",
  "Tools I use are reliable",
  "Change is managed effectively",
];
const netScores = [68, 52, 41, 22, 9, -8, -19, -34, -41, -55];

// Split into two series sharing one stack: MUI X's default `stackOffset:
// "diverging"` sends positive stacks right and negative stacks left of the
// zero baseline, giving each row a single bar colored by direction.
const agreeScores = netScores.map((v) => (v >= 0 ? v : null));
const disagreeScores = netScores.map((v) => (v < 0 ? v : null));

const axisLimit =
  Math.ceil((Math.max(...netScores.map(Math.abs)) + 10) / 10) * 10;

export default function Chart() {
  const W = window.ANYPLOT_SIZE.width;
  const H = window.ANYPLOT_SIZE.height;
  const CHART_TOP = 76;

  return (
    <Box sx={{ position: "relative", width: W, height: H, bgcolor: t.pageBg }}>
      <Box sx={{ position: "absolute", top: 22, left: 32, right: 32 }}>
        <Typography sx={{ color: t.ink, fontSize: 22, fontWeight: 500 }}>
          bar-diverging · javascript · muix · anyplot.ai
        </Typography>
      </Box>

      <Box sx={{ position: "absolute", top: CHART_TOP, left: 0, right: 0, bottom: 0 }}>
        <BarChart
          width={W}
          height={H - CHART_TOP}
          layout="horizontal"
          skipAnimation
          barLabel={(item) =>
            item.value === null ? null : `${item.value > 0 ? "+" : ""}${item.value}`
          }
          series={[
            {
              id: "agree",
              stackId: "score",
              data: agreeScores,
              label: "Net agree",
              color: t.palette[0],
              valueFormatter: (v) => (v === null ? "" : `+${v} pp`),
            },
            {
              id: "disagree",
              stackId: "score",
              data: disagreeScores,
              label: "Net disagree",
              color: t.palette[4],
              valueFormatter: (v) => (v === null ? "" : `${v} pp`),
            },
          ]}
          xAxis={[
            {
              id: "value",
              min: -axisLimit,
              max: axisLimit,
              label: "Net Agreement Score (percentage points)",
              labelStyle: { fontSize: 16, fill: t.inkSoft },
              tickLabelStyle: { fontSize: 14, fill: t.inkSoft },
              valueFormatter: (v) => `${v > 0 ? "+" : ""}${v}`,
            },
          ]}
          yAxis={[
            {
              scaleType: "band",
              data: statements,
              tickLabelStyle: { fontSize: 14, fill: t.ink },
              disableTicks: true,
              categoryGapRatio: 0.35,
            },
          ]}
          margin={{ top: 20, right: 60, bottom: 76, left: 300 }}
          grid={{ vertical: true }}
          slotProps={{
            legend: {
              position: { vertical: "top", horizontal: "right" },
              labelStyle: { fontSize: 14, fill: t.inkSoft },
            },
          }}
          sx={{
            "& .MuiBarLabel-root": {
              fill: "#F0EFE8",
              fontSize: "14px",
              fontWeight: 600,
            },
            "& .MuiChartsAxis-line": { stroke: t.inkSoft },
            "& .MuiChartsGrid-line": { stroke: t.grid },
          }}
        >
          <ChartsReferenceLine
            x={0}
            axisId="value"
            lineStyle={{ stroke: t.ink, strokeWidth: 2 }}
          />
        </BarChart>
      </Box>
    </Box>
  );
}
Runnable source as JSON, for any HTTP client: https://api.anyplot.ai/specs/bar-diverging/muix/code. Any spec id and library id listed in llms-full.txt fit the same URL shape; every URL below is complete and callable.
{
  "spec_id": "bar-diverging",
  "language": "javascript",
  "library": "muix",
  "page": "https://anyplot.ai/bar-diverging/javascript/muix",
  "hub": "https://anyplot.ai/bar-diverging",
  "code_json": "https://api.anyplot.ai/specs/bar-diverging/muix/code",
  "spec_json": "https://api.anyplot.ai/specs/bar-diverging",
  "render_light_png": "https://storage.googleapis.com/anyplot-images/plots/bar-diverging/javascript/muix/plot-light.png",
  "render_dark_png": "https://storage.googleapis.com/anyplot-images/plots/bar-diverging/javascript/muix/plot-dark.png",
  "interactive_light_html": "https://storage.googleapis.com/anyplot-images/plots/bar-diverging/javascript/muix/plot-light.html",
  "interactive_dark_html": "https://storage.googleapis.com/anyplot-images/plots/bar-diverging/javascript/muix/plot-dark.html",
  "quality_score": 91.0,
  "license": "MIT",
  "guide": "https://anyplot.ai/llms.txt"
}
Part of Diverging Bar Chart on anyplot.ai.