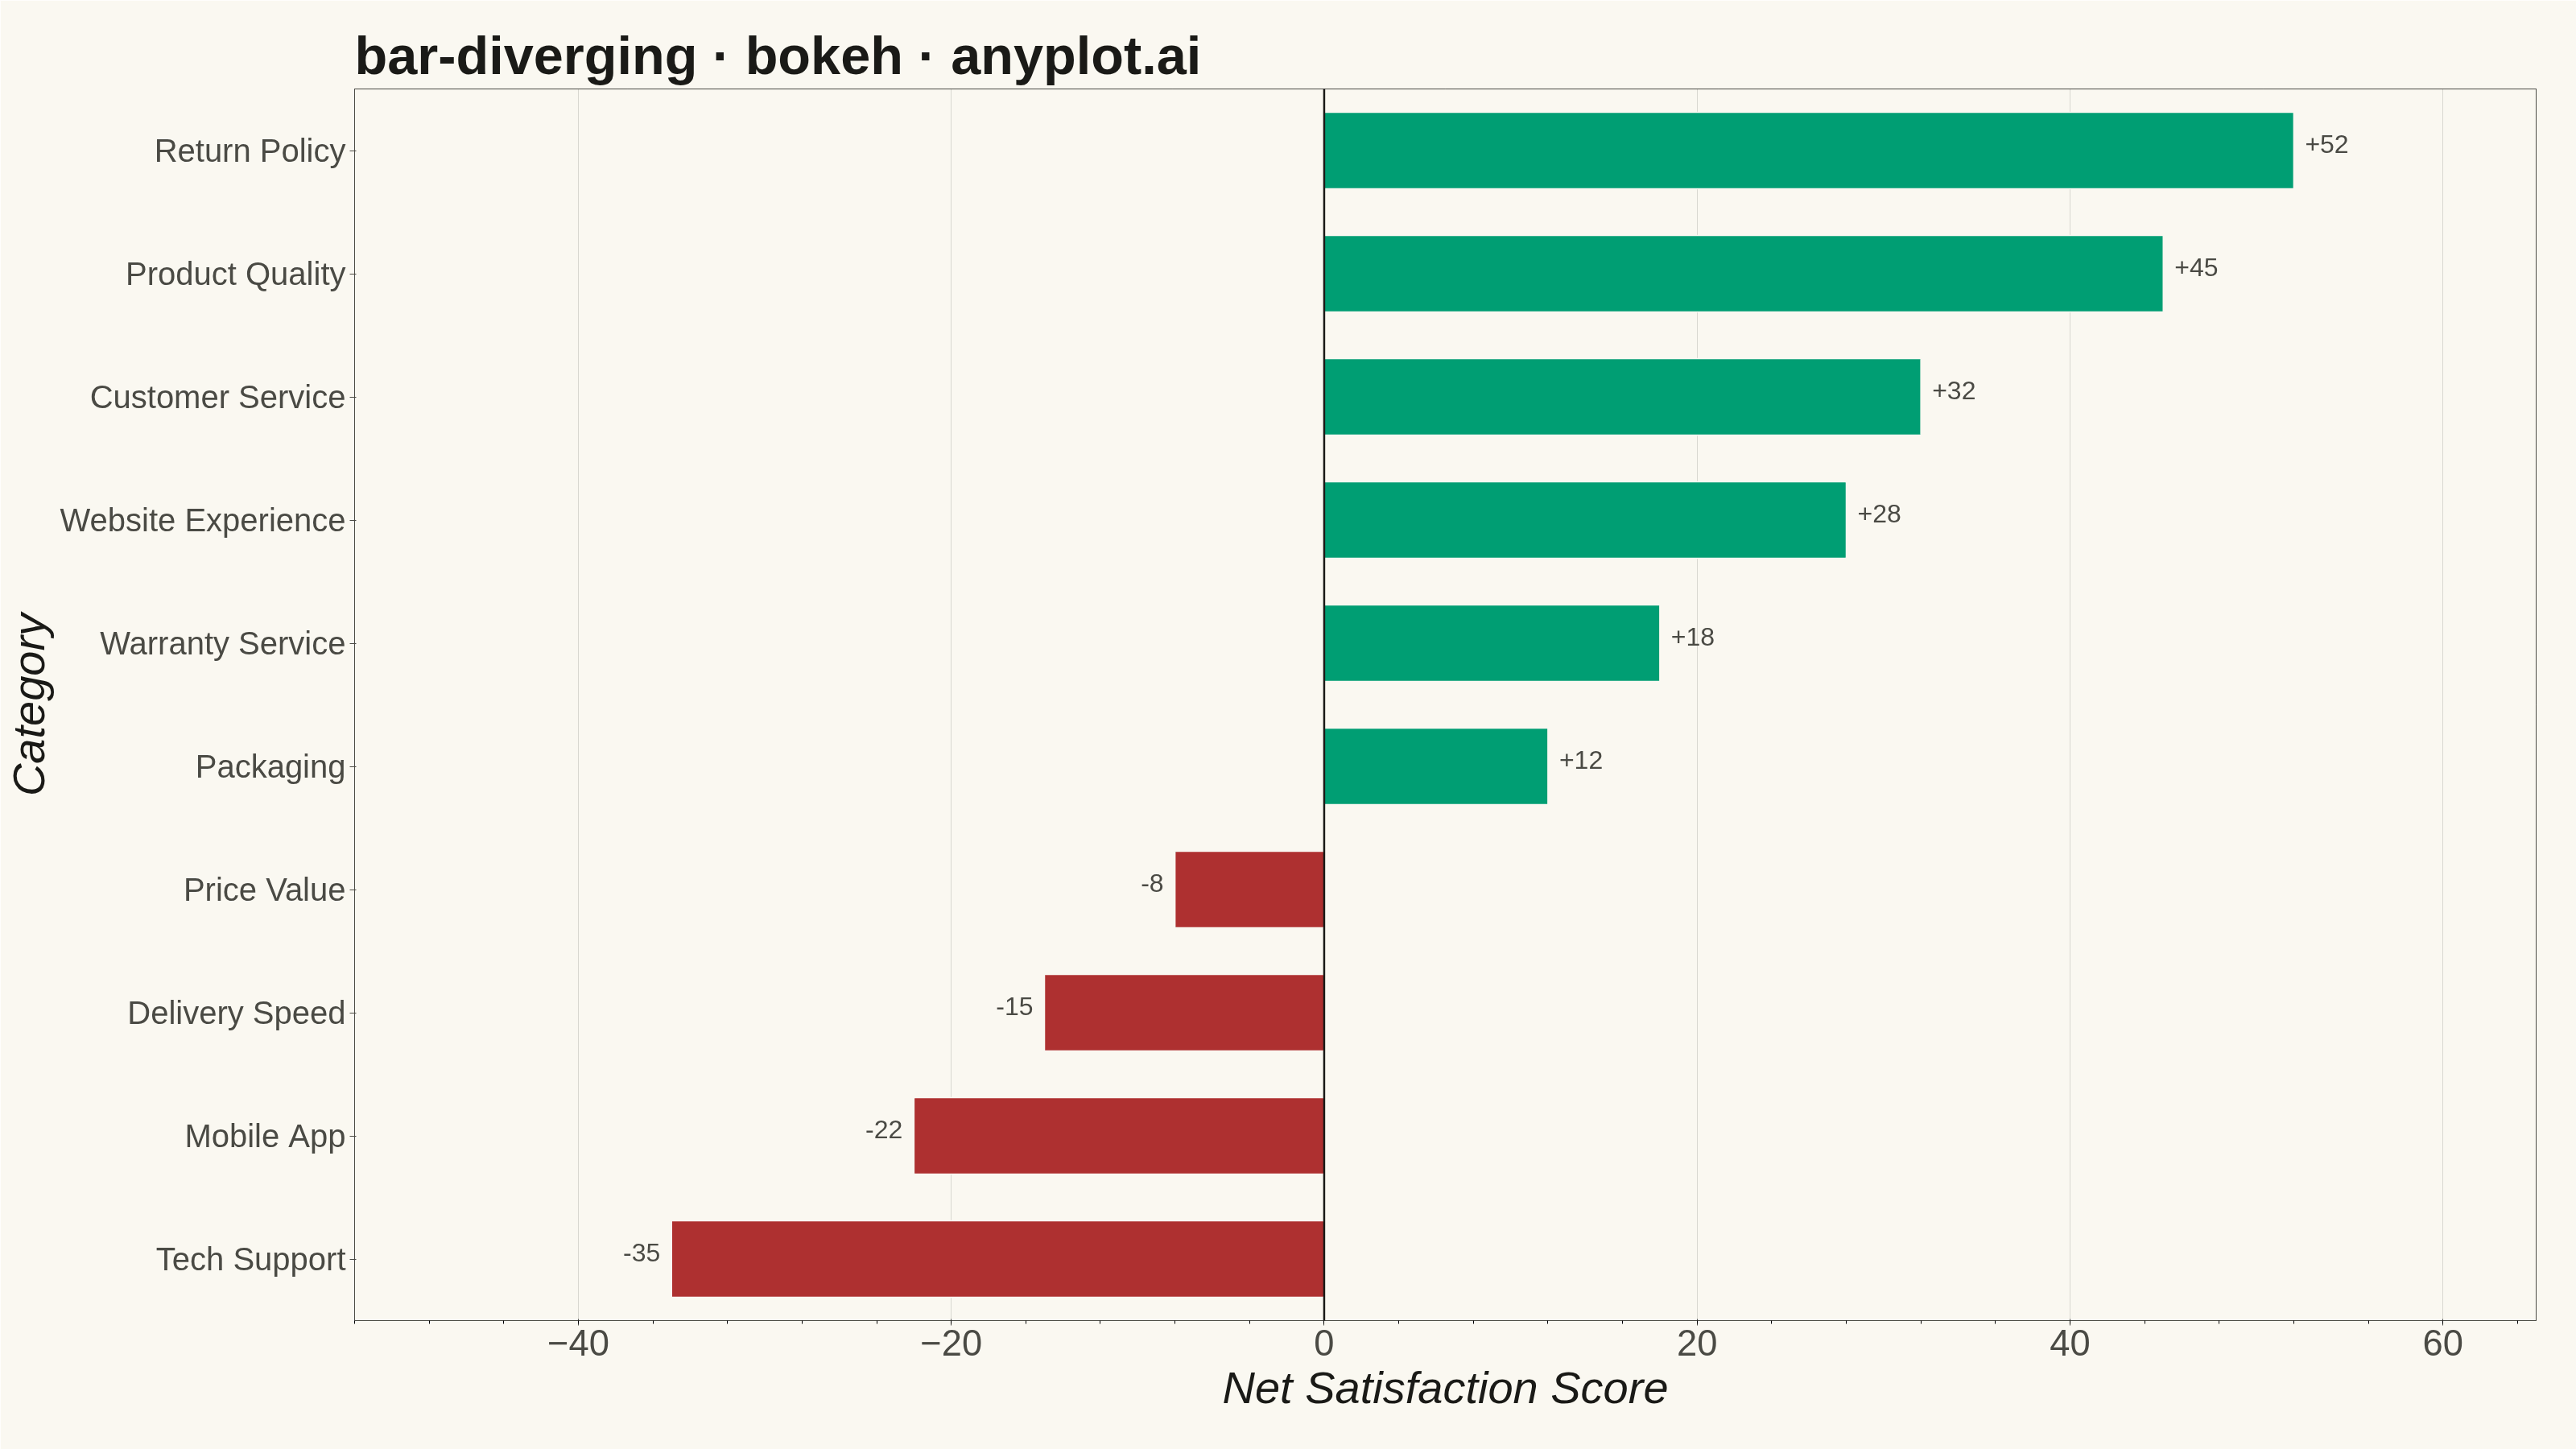
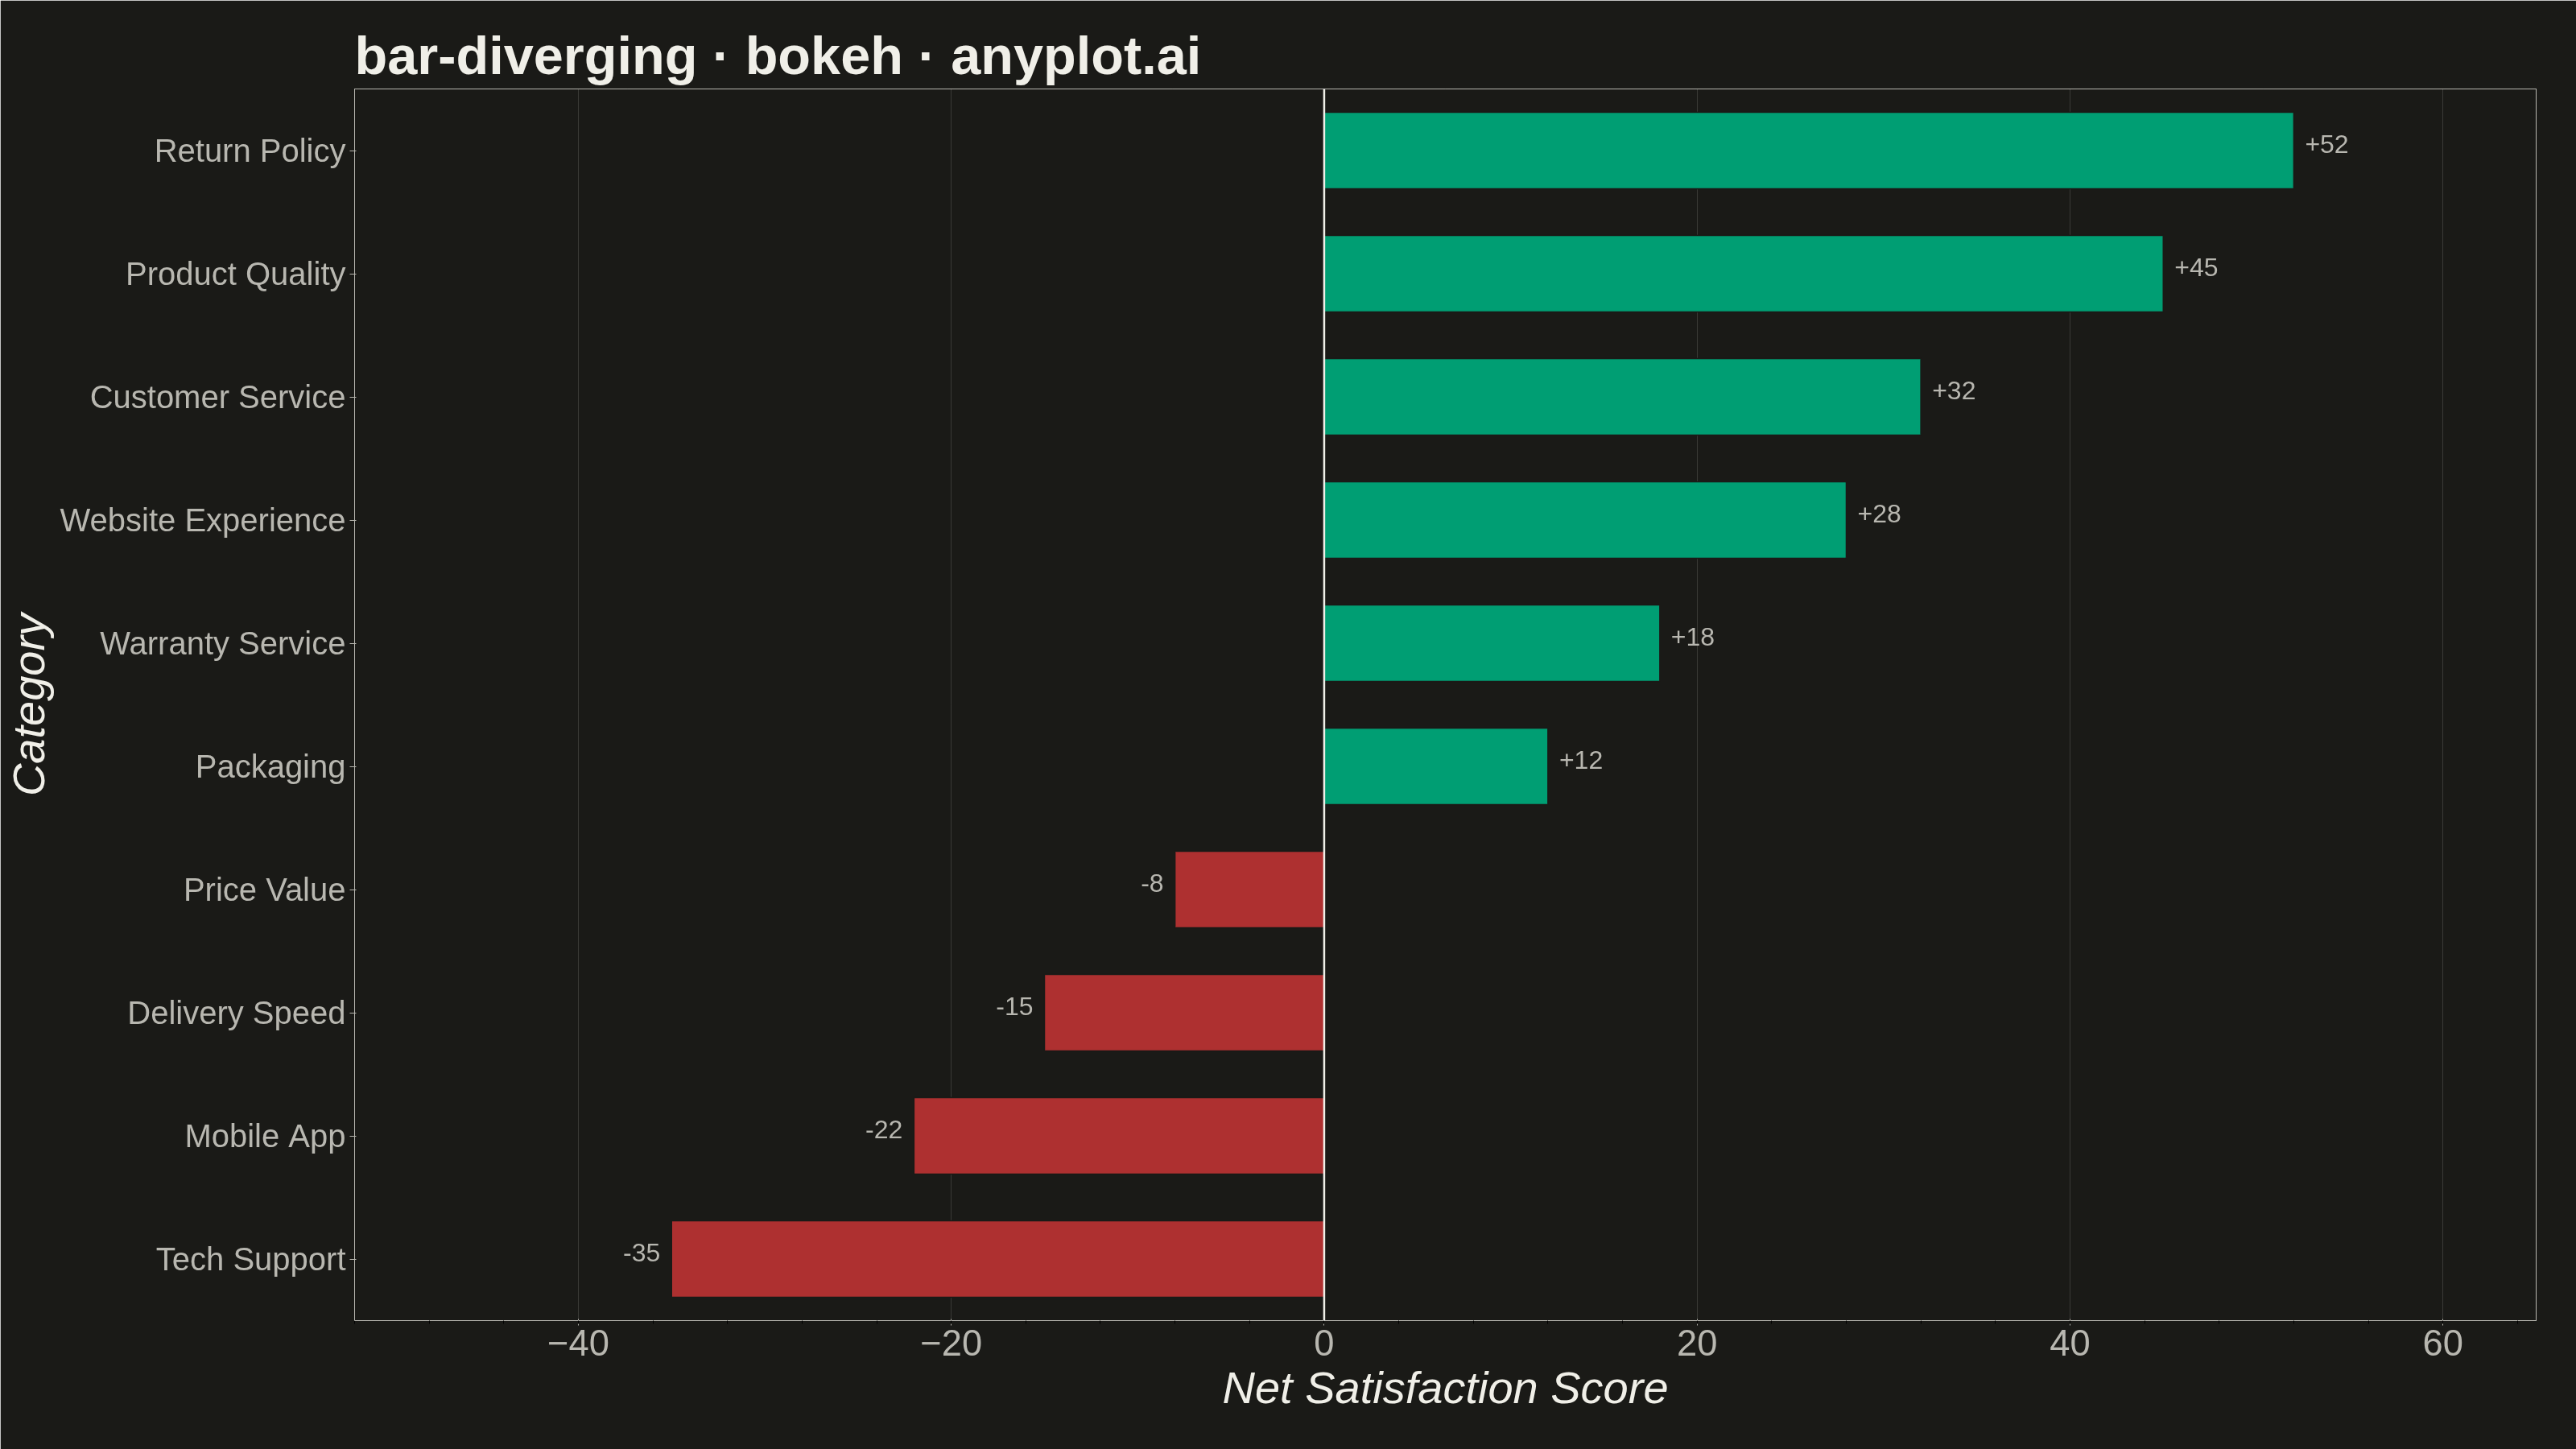
A diverging bar chart displays bars extending in opposite directions from a central baseline, typically at zero. This visualization is ideal for comparing positive and negative values, showing responses above and below a neutral point, or contrasting opposing categories. Different colors distinguish positive from negative values, making it easy to identify magnitude and direction at a glance.
""" anyplot.ai
bar-diverging: Diverging Bar Chart
Library: bokeh 3.9.2 | Python 3.13.15
Quality: 91/100 | Updated: 2026-08-18
"""

import os
import sys
import time
from pathlib import Path


# Prevent this file (bokeh.py) from shadowing the installed bokeh package
_this_dir = os.path.dirname(os.path.abspath(__file__))
sys.path = [p for p in sys.path if not (p and os.path.abspath(p) == _this_dir)]

from bokeh.io import output_file, save
from bokeh.models import ColumnDataSource, HoverTool, LabelSet, Span
from bokeh.plotting import figure
from PIL import Image
from selenium import webdriver
from selenium.webdriver.chrome.options import Options


# Theme tokens — Imprint palette
THEME = os.getenv("ANYPLOT_THEME", "light")
PAGE_BG = "#FAF8F1" if THEME == "light" else "#1A1A17"
INK = "#1A1A17" if THEME == "light" else "#F0EFE8"
INK_SOFT = "#4A4A44" if THEME == "light" else "#B8B7B0"

BRAND_POS = "#009E73"  # Imprint position 1 — brand green, positive / promoter
BRAND_NEG = "#AE3030"  # Imprint position 5 — semantic anchor for negative / detractor

# Data — Customer satisfaction survey responses (Net Promoter Score style)
categories = [
    "Product Quality",
    "Customer Service",
    "Delivery Speed",
    "Website Experience",
    "Price Value",
    "Return Policy",
    "Mobile App",
    "Warranty Service",
    "Tech Support",
    "Packaging",
]

# Net satisfaction scores: positive = more promoters, negative = more detractors
values = [45, 32, -15, 28, -8, 52, -22, 18, -35, 12]

# Sort by value for pattern recognition
sorted_data = sorted(zip(categories, values, strict=True), key=lambda x: x[1])
categories_sorted = [item[0] for item in sorted_data]
values_sorted = [item[1] for item in sorted_data]

colors = [BRAND_POS if v >= 0 else BRAND_NEG for v in values_sorted]
value_fmt = [f"+{v}" if v >= 0 else str(v) for v in values_sorted]

source = ColumnDataSource(
    data={"category": categories_sorted, "value": values_sorted, "color": colors, "value_fmt": value_fmt}
)

# Positive/negative value labels need opposite text alignment — split by sign
label_pos_src = ColumnDataSource(
    data={
        "category": [c for c, v in zip(categories_sorted, values_sorted, strict=True) if v >= 0],
        "value": [v for v in values_sorted if v >= 0],
        "text": [f"+{v}" for v in values_sorted if v >= 0],
    }
)
label_neg_src = ColumnDataSource(
    data={
        "category": [c for c, v in zip(categories_sorted, values_sorted, strict=True) if v < 0],
        "value": [v for v in values_sorted if v < 0],
        "text": [str(v) for v in values_sorted if v < 0],
    }
)

# Plot — 3200×1800 landscape canvas per hard contract
p = figure(
    width=3200,
    height=1800,
    y_range=categories_sorted,
    x_range=(-52, 65),
    title="bar-diverging · bokeh · anyplot.ai",
    x_axis_label="Net Satisfaction Score",
    y_axis_label="Category",
    toolbar_location=None,  # prevents toolbar from shrinking canvas height
    min_border_bottom=160,  # room for 34pt x-ticks + 42pt x-axis label
    min_border_left=440,  # room for categorical y-axis labels + 42pt axis label
    min_border_top=110,  # room for 50pt title
    min_border_right=50,
)

# Horizontal bars diverging from zero (better for long category labels)
bars = p.hbar(
    y="category", right="value", left=0, height=0.62, color="color", source=source, line_color=PAGE_BG, line_width=1.5
)

# HoverTool for interactive HTML exploration — distinctive Bokeh feature
hover = HoverTool(renderers=[bars], tooltips=[("Category", "@category"), ("Net score", "@value_fmt")])
p.add_tools(hover)

# Value labels at bar ends, aligned away from the zero baseline
pos_labels = LabelSet(
    x="value",
    y="category",
    text="text",
    source=label_pos_src,
    text_font_size="24pt",
    text_color=INK_SOFT,
    text_align="left",
    x_offset=14,
    y_offset=-3,
)
p.add_layout(pos_labels)

neg_labels = LabelSet(
    x="value",
    y="category",
    text="text",
    source=label_neg_src,
    text_font_size="24pt",
    text_color=INK_SOFT,
    text_align="right",
    x_offset=-14,
    y_offset=-3,
)
p.add_layout(neg_labels)

# Zero baseline — the diverging focal point
zero_line = Span(location=0, dimension="height", line_color=INK, line_width=2.5, line_dash="solid")
p.add_layout(zero_line)

# Theme-adaptive chrome
p.background_fill_color = PAGE_BG
p.border_fill_color = PAGE_BG
p.outline_line_color = INK_SOFT

p.title.text_font_size = "50pt"
p.title.text_color = INK

p.xaxis.axis_label_text_font_size = "42pt"
p.yaxis.axis_label_text_font_size = "42pt"
p.xaxis.axis_label_text_color = INK
p.yaxis.axis_label_text_color = INK
p.xaxis.major_label_text_font_size = "34pt"
p.yaxis.major_label_text_font_size = "30pt"  # slightly smaller for long categorical labels
p.xaxis.major_label_text_color = INK_SOFT
p.yaxis.major_label_text_color = INK_SOFT
p.xaxis.axis_line_color = INK_SOFT
p.yaxis.axis_line_color = INK_SOFT
p.xaxis.major_tick_line_color = INK_SOFT
p.yaxis.major_tick_line_color = INK_SOFT

# Grid styling - subtle, value-axis only
p.xgrid.grid_line_color = INK
p.xgrid.grid_line_alpha = 0.15
p.ygrid.grid_line_alpha = 0.0

# Save interactive HTML
output_file(f"plot-{THEME}.html")
save(p)

# Screenshot with headless Chrome — CDP override is authoritative:
# --window-size alone loses ~139 px to Chrome chrome in headless mode
W, H = 3200, 1800
opts = Options()
for arg in (
    "--headless=new",
    "--no-sandbox",
    "--disable-dev-shm-usage",
    "--disable-gpu",
    f"--window-size={W},{H}",
    "--hide-scrollbars",
):
    opts.add_argument(arg)
driver = webdriver.Chrome(options=opts)
driver.execute_cdp_cmd(
    "Emulation.setDeviceMetricsOverride", {"width": W, "height": H, "deviceScaleFactor": 1, "mobile": False}
)
driver.get(f"file://{Path(f'plot-{THEME}.html').resolve()}")
time.sleep(3)
driver.save_screenshot(f"plot-{THEME}.png")
driver.quit()

# PIL safety net: pin to exact 3200×1800 in case of sub-pixel rounding
_img = Image.open(f"plot-{THEME}.png").convert("RGB")
if _img.size != (W, H):
    _norm = Image.new("RGB", (W, H), PAGE_BG)
    _norm.paste(_img, ((W - _img.size[0]) // 2, (H - _img.size[1]) // 2))
    _norm.save(f"plot-{THEME}.png")
Runnable source as JSON, for any HTTP client: https://api.anyplot.ai/specs/bar-diverging/bokeh/code. Any spec id and library id listed in llms-full.txt fit the same URL shape; every URL below is complete and callable.
{
  "spec_id": "bar-diverging",
  "language": "python",
  "library": "bokeh",
  "page": "https://anyplot.ai/bar-diverging/python/bokeh",
  "hub": "https://anyplot.ai/bar-diverging",
  "code_json": "https://api.anyplot.ai/specs/bar-diverging/bokeh/code",
  "spec_json": "https://api.anyplot.ai/specs/bar-diverging",
  "render_light_png": "https://storage.googleapis.com/anyplot-images/plots/bar-diverging/python/bokeh/plot-light.png",
  "render_dark_png": "https://storage.googleapis.com/anyplot-images/plots/bar-diverging/python/bokeh/plot-dark.png",
  "interactive_light_html": "https://storage.googleapis.com/anyplot-images/plots/bar-diverging/python/bokeh/plot-light.html",
  "interactive_dark_html": "https://storage.googleapis.com/anyplot-images/plots/bar-diverging/python/bokeh/plot-dark.html",
  "quality_score": 91.0,
  "license": "MIT",
  "guide": "https://anyplot.ai/llms.txt"
}
Part of Diverging Bar Chart on anyplot.ai.