The same plot in 14 other libraries — JavaScript: D3.js, Apache ECharts, Highcharts, MUI X Charts; Python: Altair, Bokeh, lets-plot, Matplotlib, Plotly, plotnine, Pygal, Seaborn; R: ggplot2; Julia: Makie.jl. Compare all 15 side by side: Likert Scale Diverging Bar Chart in Python, R, Julia and JavaScript.
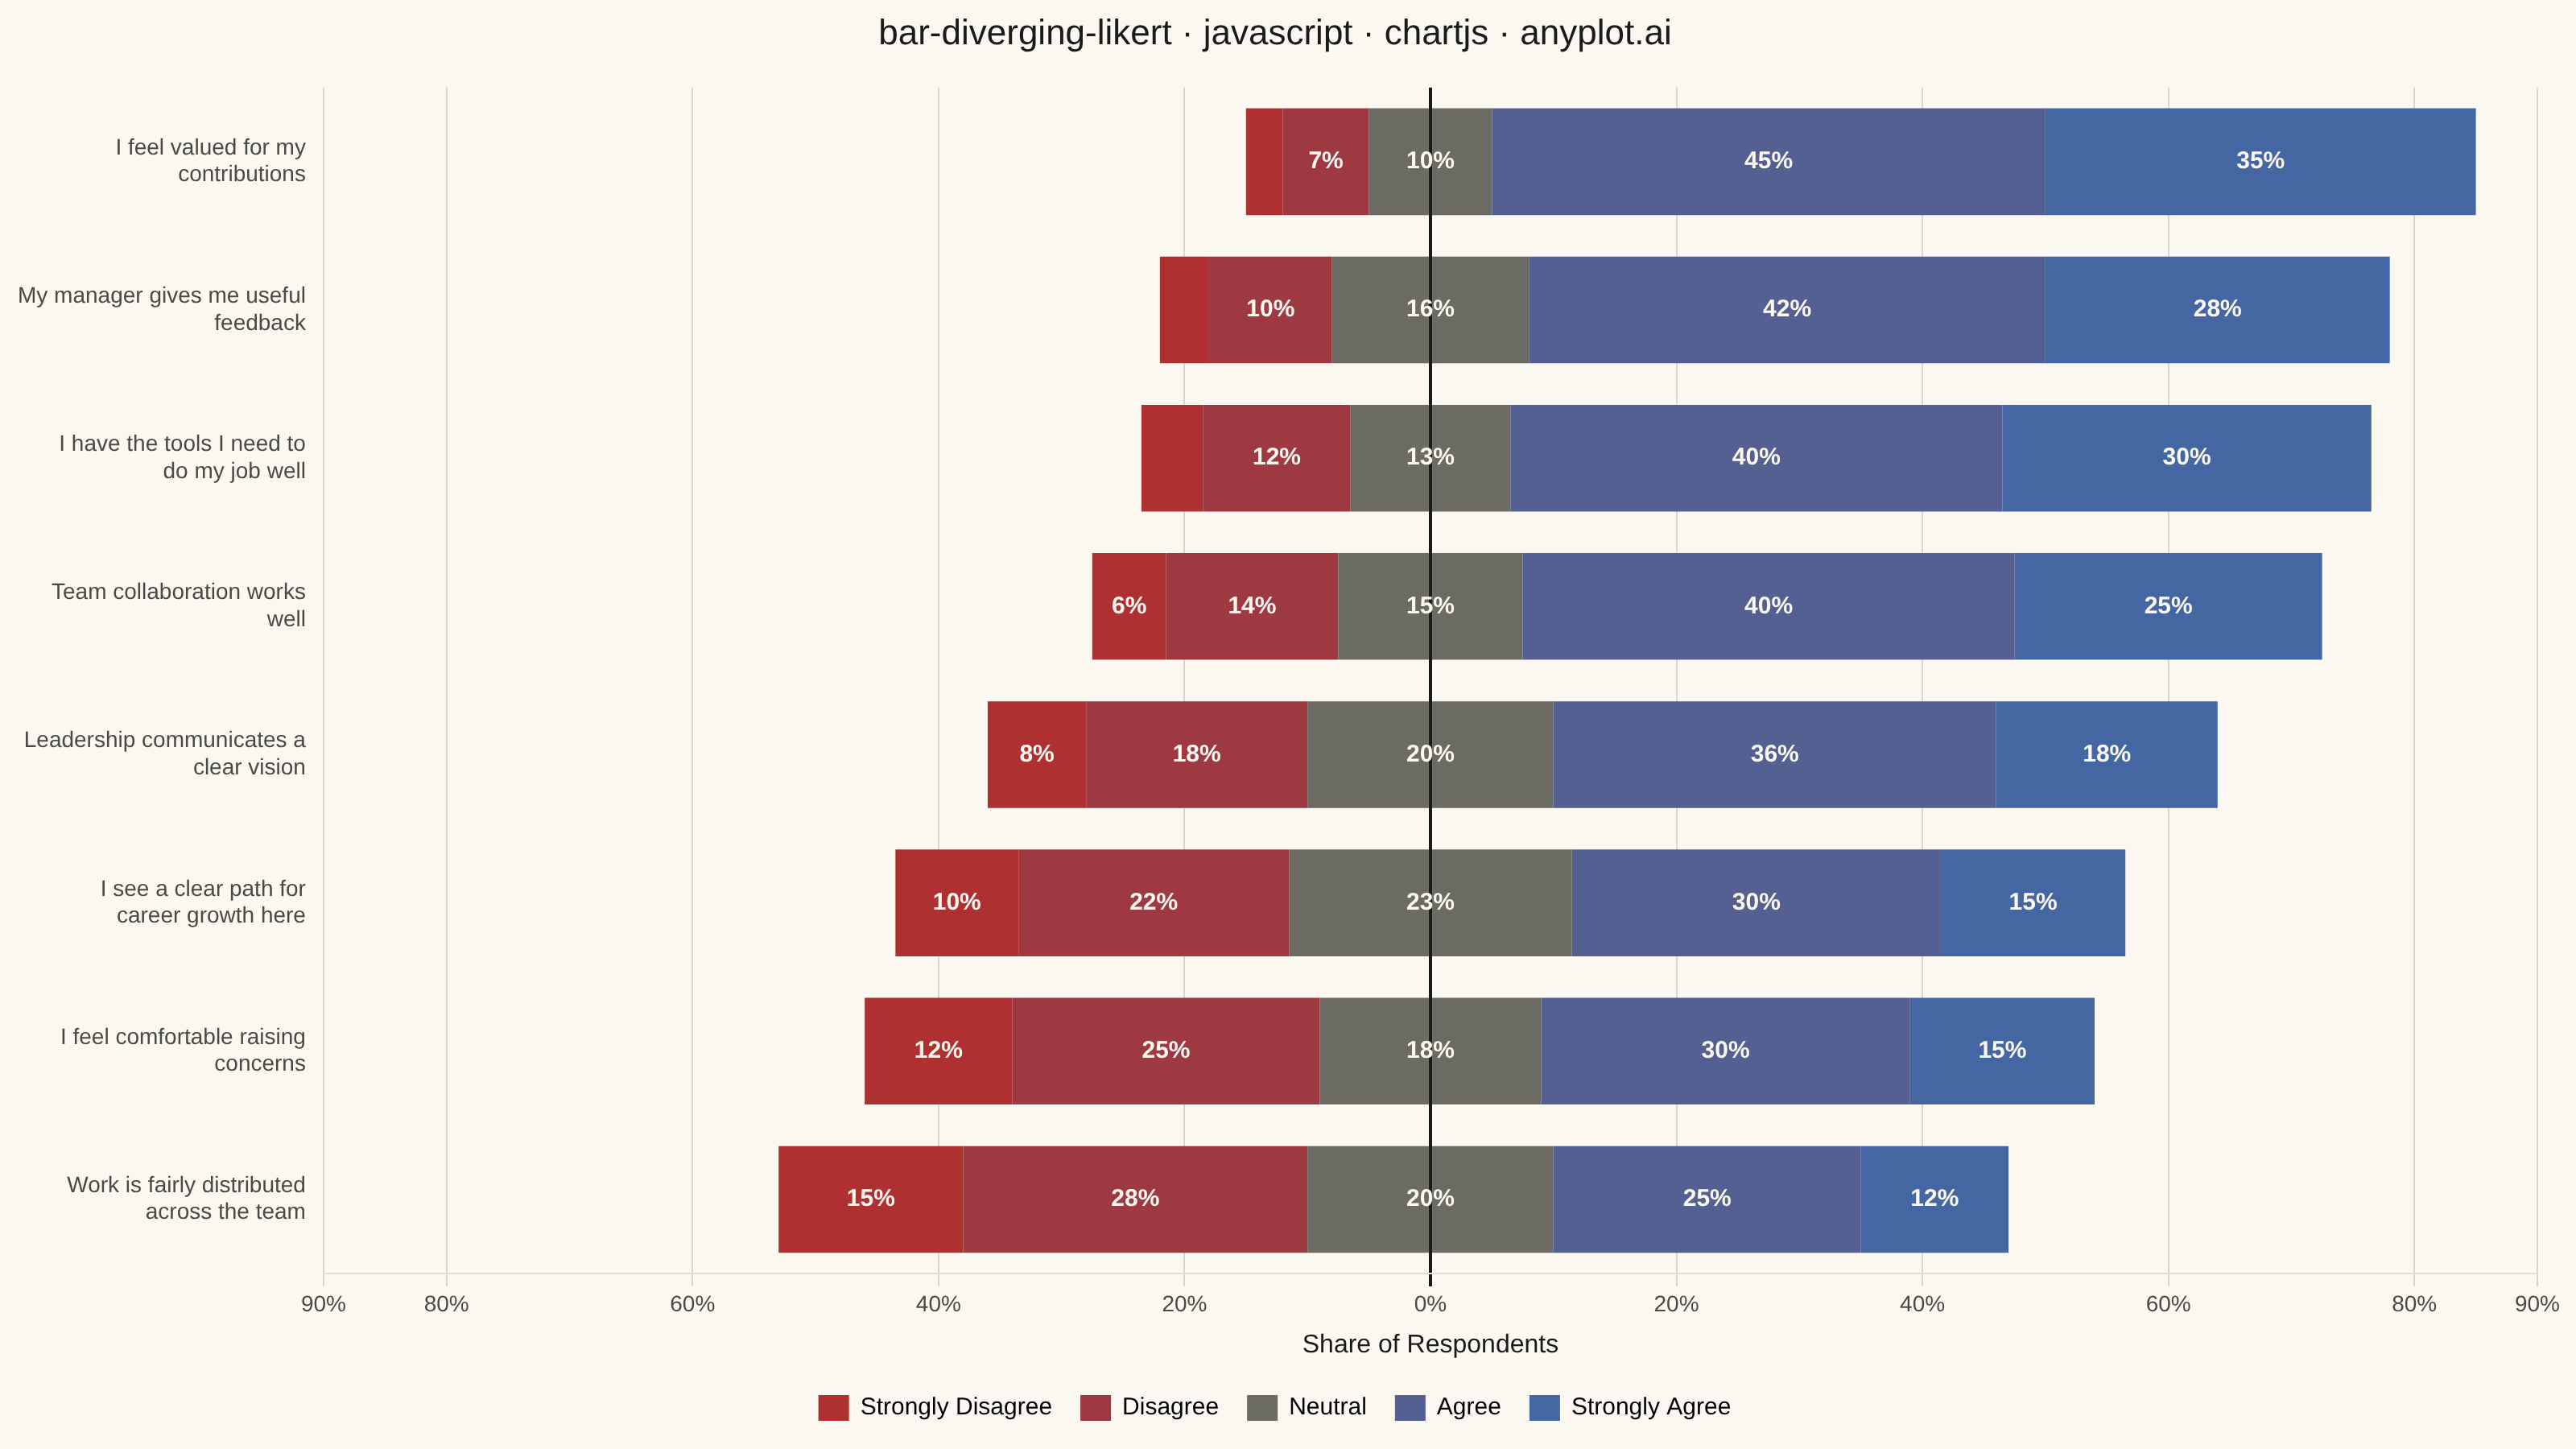
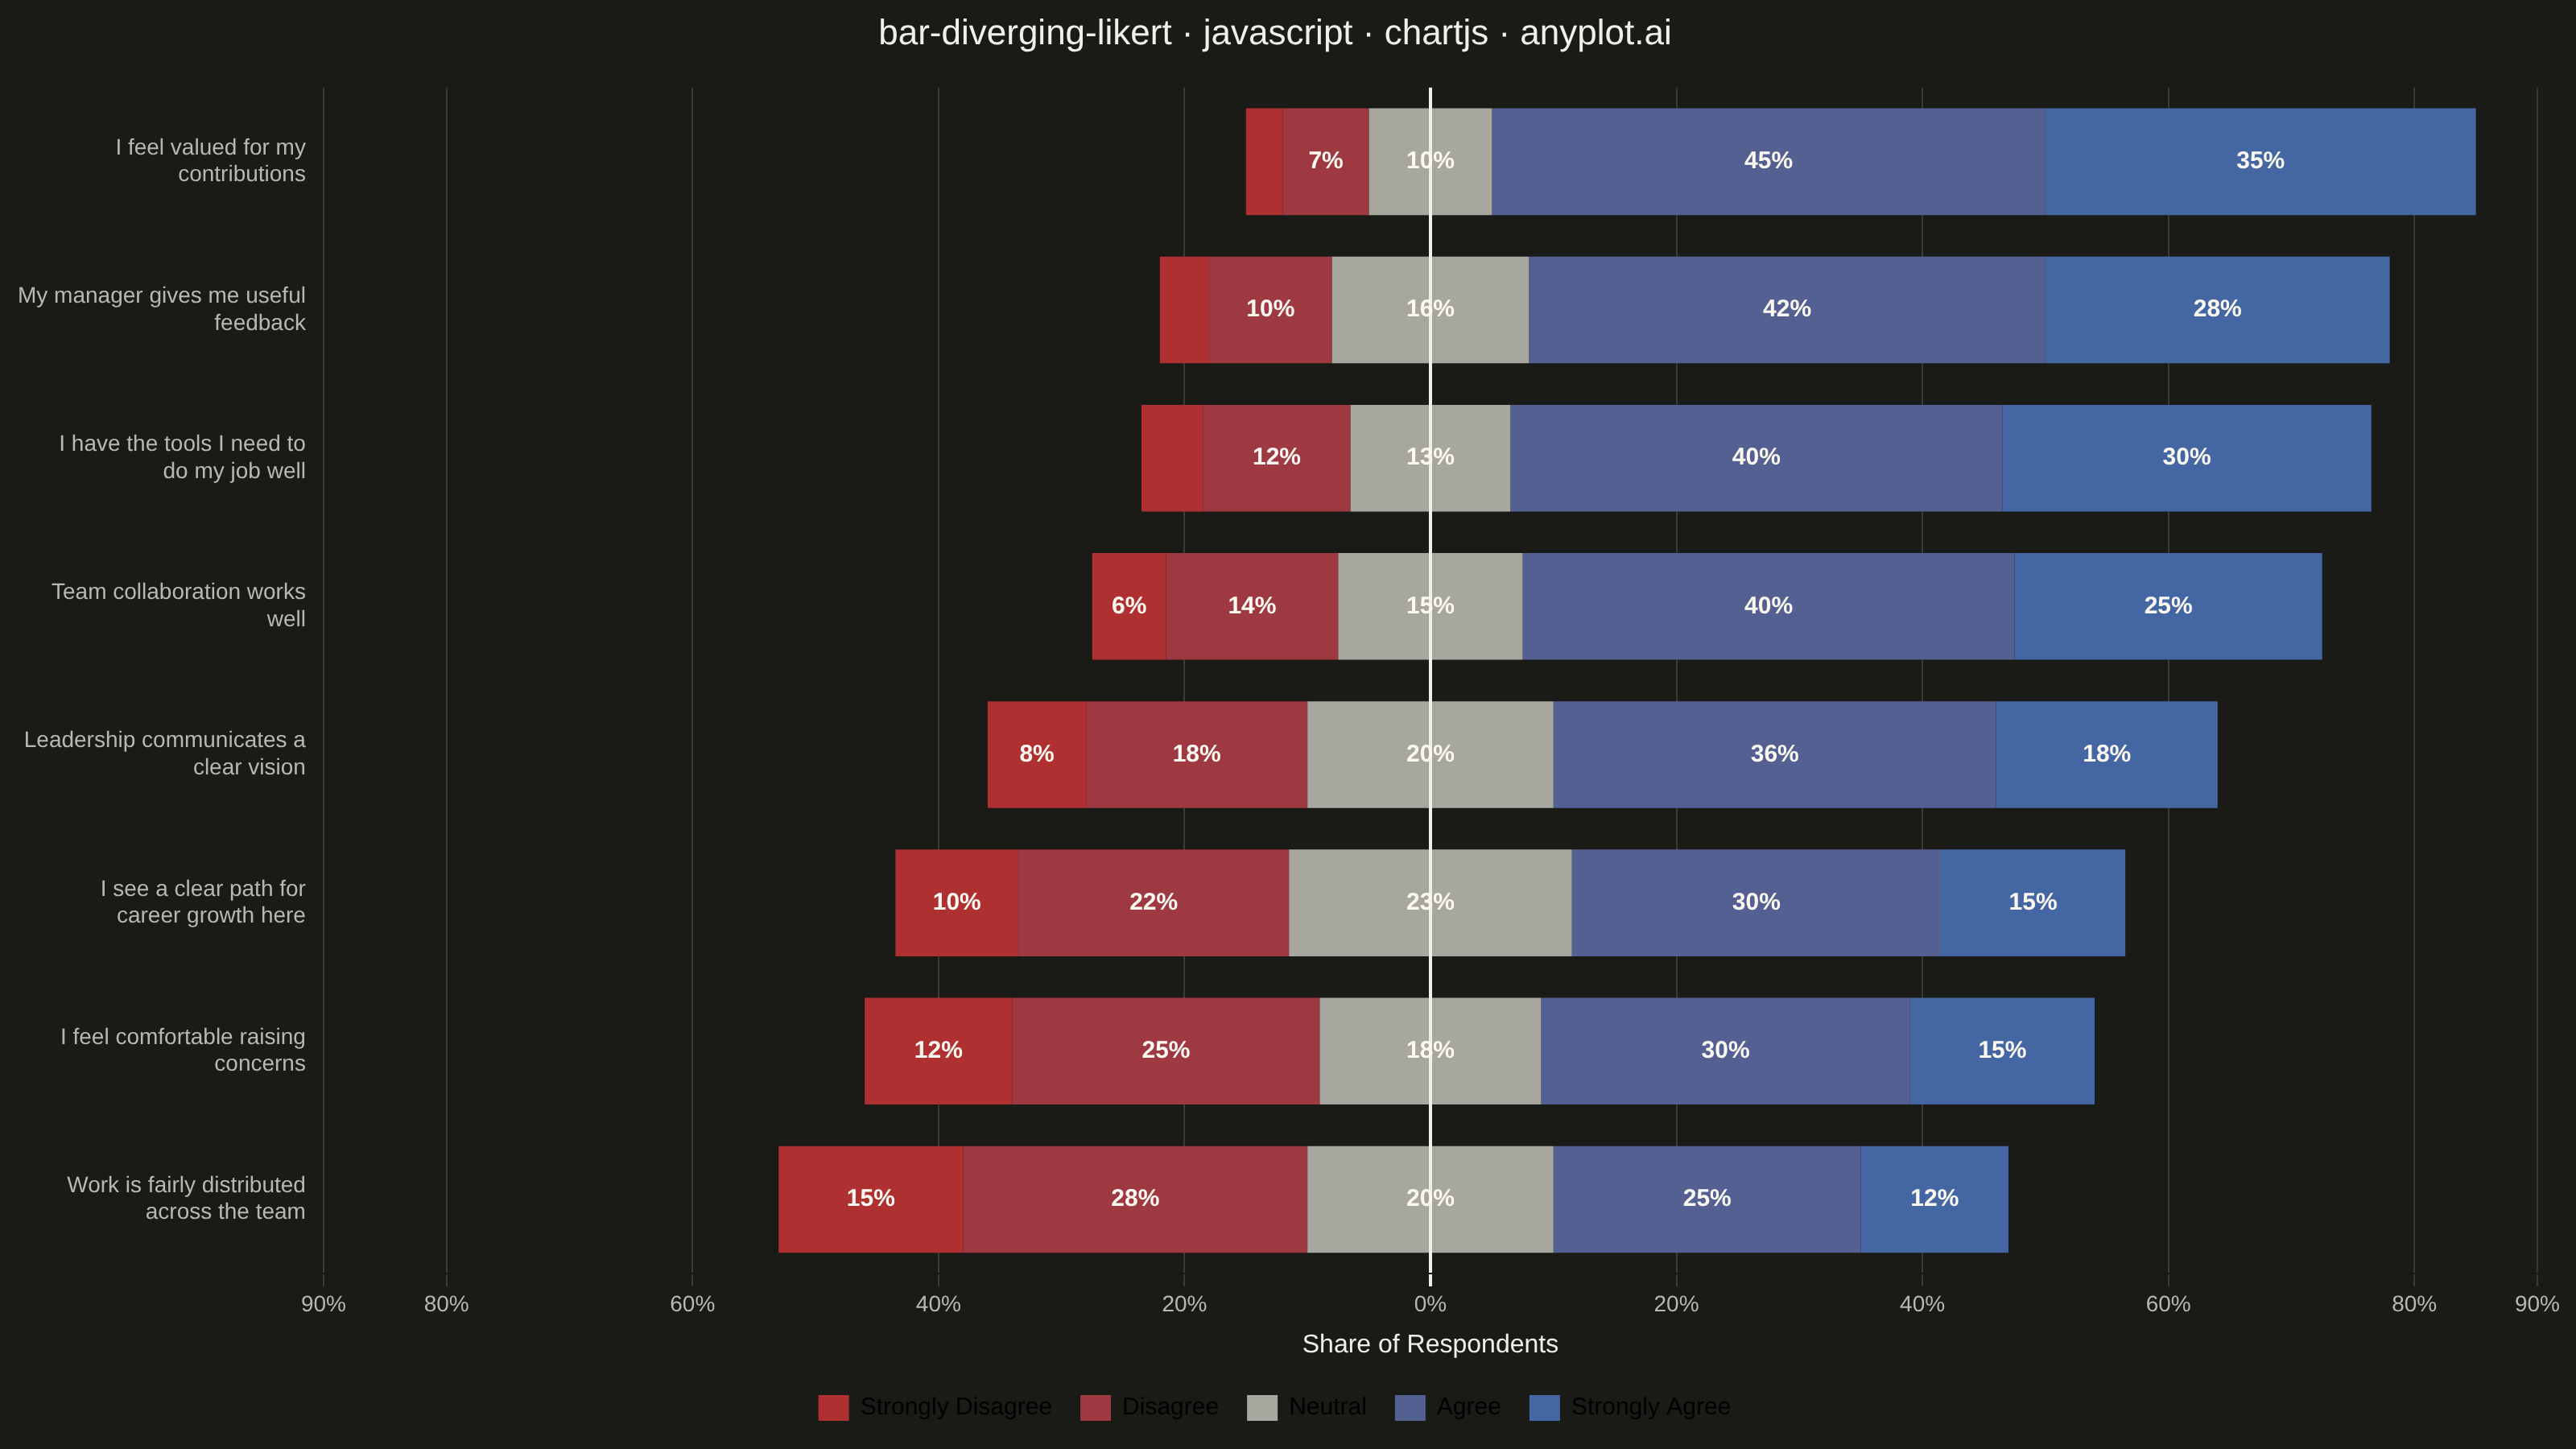
A diverging stacked bar chart designed for Likert scale survey responses (e.g., Strongly Disagree to Strongly Agree). Bars diverge from a central neutral point, with negative responses (Disagree, Strongly Disagree) extending left and positive responses (Agree, Strongly Agree) extending right. This layout makes it easy to compare overall agreement levels across multiple survey questions at a glance.
// anyplot.ai
// bar-diverging-likert: Likert Scale Diverging Bar Chart
// Library: chartjs 4.4.7 | JavaScript 22.23.2
// Quality: 91/100 | Created: 2026-08-24

const t = window.ANYPLOT_TOKENS;

// --- Theme-adaptive chrome not covered by ANYPLOT_TOKENS -------------------
const INK_MUTED = t.theme === "light" ? "#6B6A63" : "#A8A79F";

// --- Color helpers -----------------------------------------------------------
function hexToRgb(hex) {
  const n = parseInt(hex.slice(1), 16);
  return [(n >> 16) & 255, (n >> 8) & 255, n & 255];
}

function mix(hexA, hexB, amount) {
  const a = hexToRgb(hexA);
  const b = hexToRgb(hexB);
  return a.map((c, i) => Math.round(c + (b[i] - c) * amount));
}

function relativeLuminance(rgb) {
  const [r, g, b] = rgb.map((c) => {
    const s = c / 255;
    return s <= 0.03928 ? s / 12.92 : Math.pow((s + 0.055) / 1.055, 2.4);
  });
  return 0.2126 * r + 0.7152 * g + 0.0722 * b;
}

function textColorFor(rgb) {
  // near-white / near-black ink tokens instead of pure #FFFFFF / #000000
  return relativeLuminance(rgb) > 0.4 ? "#1A1A17" : "#FAF8F1";
}

// A red-to-blue diverging scale, sampled at 5 Likert steps. Strongly-* segments
// use the fixed Imprint `div` anchors (t.div[0] red, t.div[2] blue); the mild
// segments are a small red/blue blend of those same fixed anchors, so all four
// stay theme-independent. Only "Neutral" uses the theme-adaptive muted-ink
// anchor — that role is documented as adaptive-by-design in the style guide.
const RED = t.div[0];
const BLUE = t.div[2];
const COLORS = {
  strongly_disagree: hexToRgb(RED),
  disagree: mix(RED, BLUE, 0.15),
  neutral: hexToRgb(INK_MUTED),
  agree: mix(BLUE, RED, 0.15),
  strongly_agree: hexToRgb(BLUE),
};
const rgbStr = (rgb) => `rgb(${rgb[0]}, ${rgb[1]}, ${rgb[2]})`;

// --- Data (in-memory, deterministic) ----------------------------------------
// Employee engagement survey, 8 items on a 5-point Likert scale (% of respondents).
const rawRows = [
  {
    question: "I feel valued for my contributions",
    strongly_disagree: 3,
    disagree: 7,
    neutral: 10,
    agree: 45,
    strongly_agree: 35,
  },
  {
    question: "My manager gives me useful feedback",
    strongly_disagree: 4,
    disagree: 10,
    neutral: 16,
    agree: 42,
    strongly_agree: 28,
  },
  {
    question: "I have the tools I need to do my job well",
    strongly_disagree: 5,
    disagree: 12,
    neutral: 13,
    agree: 40,
    strongly_agree: 30,
  },
  {
    question: "Team collaboration works well",
    strongly_disagree: 6,
    disagree: 14,
    neutral: 15,
    agree: 40,
    strongly_agree: 25,
  },
  {
    question: "Leadership communicates a clear vision",
    strongly_disagree: 8,
    disagree: 18,
    neutral: 20,
    agree: 36,
    strongly_agree: 18,
  },
  {
    question: "I see a clear path for career growth here",
    strongly_disagree: 10,
    disagree: 22,
    neutral: 23,
    agree: 30,
    strongly_agree: 15,
  },
  {
    question: "I feel comfortable raising concerns",
    strongly_disagree: 12,
    disagree: 25,
    neutral: 18,
    agree: 30,
    strongly_agree: 15,
  },
  {
    question: "Work is fairly distributed across the team",
    strongly_disagree: 15,
    disagree: 28,
    neutral: 20,
    agree: 25,
    strongly_agree: 12,
  },
];

// Sort by net agreement: (agree + strongly agree) - (disagree + strongly disagree)
const rows = [...rawRows].sort((a, b) => {
  const netA = a.agree + a.strongly_agree - (a.disagree + a.strongly_disagree);
  const netB = b.agree + b.strongly_agree - (b.disagree + b.strongly_disagree);
  return netB - netA;
});

function wrapLabel(text, maxLen) {
  const words = text.split(" ");
  const lines = [];
  let line = "";
  words.forEach((word) => {
    const candidate = line ? `${line} ${word}` : word;
    if (candidate.length > maxLen && line) {
      lines.push(line);
      line = word;
    } else {
      line = candidate;
    }
  });
  if (line) lines.push(line);
  return lines;
}

const labels = rows.map((r) => wrapLabel(r.question, 28));
const LABEL_MIN_PCT = 6; // skip drawing labels on segments too small to hold text

// --- Mount -------------------------------------------------------------------
const canvas = document.createElement("canvas");
document.getElementById("container").appendChild(canvas);

// --- Diverging stack: neutral split in half around the center, then
// disagree/agree, then strongly-disagree/strongly-agree stacking outward. ----
const datasets = [
  {
    label: "Neutral",
    data: rows.map((r) => -r.neutral / 2),
    backgroundColor: rgbStr(COLORS.neutral),
    stack: "likert",
    labelValues: rows.map((r) => r.neutral),
    labelColor: textColorFor(COLORS.neutral),
    showLabels: false,
  },
  {
    label: "Neutral",
    data: rows.map((r) => r.neutral / 2),
    backgroundColor: rgbStr(COLORS.neutral),
    stack: "likert",
    labelValues: rows.map((r) => r.neutral),
    labelColor: textColorFor(COLORS.neutral),
    showLabels: true,
    labelAtZero: true,
  },
  {
    label: "Disagree",
    data: rows.map((r) => -r.disagree),
    backgroundColor: rgbStr(COLORS.disagree),
    stack: "likert",
    labelValues: rows.map((r) => r.disagree),
    labelColor: textColorFor(COLORS.disagree),
    showLabels: true,
  },
  {
    label: "Agree",
    data: rows.map((r) => r.agree),
    backgroundColor: rgbStr(COLORS.agree),
    stack: "likert",
    labelValues: rows.map((r) => r.agree),
    labelColor: textColorFor(COLORS.agree),
    showLabels: true,
  },
  {
    label: "Strongly Disagree",
    data: rows.map((r) => -r.strongly_disagree),
    backgroundColor: rgbStr(COLORS.strongly_disagree),
    stack: "likert",
    labelValues: rows.map((r) => r.strongly_disagree),
    labelColor: textColorFor(COLORS.strongly_disagree),
    showLabels: true,
  },
  {
    label: "Strongly Agree",
    data: rows.map((r) => r.strongly_agree),
    backgroundColor: rgbStr(COLORS.strongly_agree),
    stack: "likert",
    labelValues: rows.map((r) => r.strongly_agree),
    labelColor: textColorFor(COLORS.strongly_agree),
    showLabels: true,
  },
];

// Symmetric axis extent, rounded up to a friendly step
const extent = Math.max(
  ...rows.map((r) => r.strongly_disagree + r.disagree + r.neutral / 2),
  ...rows.map((r) => r.strongly_agree + r.agree + r.neutral / 2),
);
const axisMax = Math.ceil(extent / 10) * 10;

// --- Custom plugin: draw the percentage inside each segment ----------------
const segmentLabels = {
  id: "segmentLabels",
  afterDatasetsDraw(chart) {
    const { ctx } = chart;
    ctx.save();
    ctx.font = "600 15px Arial, sans-serif";
    ctx.textAlign = "center";
    ctx.textBaseline = "middle";
    chart.data.datasets.forEach((dataset, datasetIndex) => {
      if (!dataset.showLabels) return;
      const meta = chart.getDatasetMeta(datasetIndex);
      meta.data.forEach((bar, index) => {
        const pct = dataset.labelValues[index];
        if (pct < LABEL_MIN_PCT) return;
        const xCenter = dataset.labelAtZero
          ? chart.scales.x.getPixelForValue(0)
          : (bar.x + bar.base) / 2;
        ctx.fillStyle = dataset.labelColor;
        ctx.fillText(`${pct}%`, xCenter, bar.y);
      });
    });
    ctx.restore();
  },
};

// --- Title (fontsize scales with title length — see Title Format rule) -----
const TITLE = "bar-diverging-likert · javascript · chartjs · anyplot.ai";
const titleFontSize = Math.round(
  22 * (TITLE.length > 67 ? 67 / TITLE.length : 1),
);

// --- Chart -------------------------------------------------------------------
new Chart(canvas, {
  type: "bar",
  data: { labels, datasets },
  plugins: [segmentLabels],
  options: {
    indexAxis: "y",
    responsive: true,
    maintainAspectRatio: false,
    animation: false,
    layout: { padding: { top: 8, right: 24, bottom: 8, left: 8 } },
    plugins: {
      title: {
        display: true,
        text: TITLE,
        color: t.ink,
        font: { size: titleFontSize, weight: "500" },
        padding: { bottom: 20 },
      },
      legend: {
        position: "bottom",
        labels: {
          color: t.ink,
          font: { size: 15 },
          boxWidth: 18,
          padding: 18,
          generateLabels() {
            return [
              {
                text: "Strongly Disagree",
                fillStyle: rgbStr(COLORS.strongly_disagree),
                strokeStyle: rgbStr(COLORS.strongly_disagree),
              },
              {
                text: "Disagree",
                fillStyle: rgbStr(COLORS.disagree),
                strokeStyle: rgbStr(COLORS.disagree),
              },
              {
                text: "Neutral",
                fillStyle: rgbStr(COLORS.neutral),
                strokeStyle: rgbStr(COLORS.neutral),
              },
              {
                text: "Agree",
                fillStyle: rgbStr(COLORS.agree),
                strokeStyle: rgbStr(COLORS.agree),
              },
              {
                text: "Strongly Agree",
                fillStyle: rgbStr(COLORS.strongly_agree),
                strokeStyle: rgbStr(COLORS.strongly_agree),
              },
            ];
          },
        },
      },
      tooltip: {
        backgroundColor: t.elevatedBg,
        titleColor: t.ink,
        bodyColor: t.ink,
        borderColor: t.grid,
        borderWidth: 1,
        callbacks: {
          label: (ctx) =>
            `${ctx.dataset.label}: ${ctx.dataset.labelValues[ctx.dataIndex]}%`,
        },
      },
    },
    scales: {
      x: {
        stacked: true,
        min: -axisMax,
        max: axisMax,
        ticks: {
          color: t.inkSoft,
          font: { size: 14 },
          callback: (value) => `${Math.abs(value)}%`,
        },
        grid: {
          color: (ctx) => (ctx.tick.value === 0 ? t.ink : t.grid),
          lineWidth: (ctx) => (ctx.tick.value === 0 ? 2 : 1),
        },
        title: {
          display: true,
          text: "Share of Respondents",
          color: t.ink,
          font: { size: 16 },
        },
      },
      y: {
        stacked: true,
        categoryPercentage: 0.75,
        barPercentage: 0.9,
        ticks: { color: t.inkSoft, font: { size: 14 } },
        grid: { display: false },
        border: { display: false },
      },
    },
  },
});
Runnable source as JSON, for any HTTP client: https://api.anyplot.ai/specs/bar-diverging-likert/chartjs/code. Any spec id and library id listed in llms-full.txt fit the same URL shape; every URL below is complete and callable.
{
  "spec_id": "bar-diverging-likert",
  "language": "javascript",
  "library": "chartjs",
  "page": "https://anyplot.ai/bar-diverging-likert/javascript/chartjs",
  "hub": "https://anyplot.ai/bar-diverging-likert",
  "code_json": "https://api.anyplot.ai/specs/bar-diverging-likert/chartjs/code",
  "spec_json": "https://api.anyplot.ai/specs/bar-diverging-likert",
  "render_light_png": "https://storage.googleapis.com/anyplot-images/plots/bar-diverging-likert/javascript/chartjs/plot-light.png",
  "render_dark_png": "https://storage.googleapis.com/anyplot-images/plots/bar-diverging-likert/javascript/chartjs/plot-dark.png",
  "interactive_light_html": "https://storage.googleapis.com/anyplot-images/plots/bar-diverging-likert/javascript/chartjs/plot-light.html",
  "interactive_dark_html": "https://storage.googleapis.com/anyplot-images/plots/bar-diverging-likert/javascript/chartjs/plot-dark.html",
  "quality_score": 91.0,
  "license": "MIT",
  "guide": "https://anyplot.ai/llms.txt"
}
Part of Likert Scale Diverging Bar Chart on anyplot.ai.