The same plot in 14 other libraries — JavaScript: Chart.js, Apache ECharts, Highcharts, MUI X Charts; Python: Altair, Bokeh, lets-plot, Matplotlib, Plotly, plotnine, Pygal, Seaborn; R: ggplot2; Julia: Makie.jl. Compare all 15 side by side: Likert Scale Diverging Bar Chart in Python, R, Julia and JavaScript.
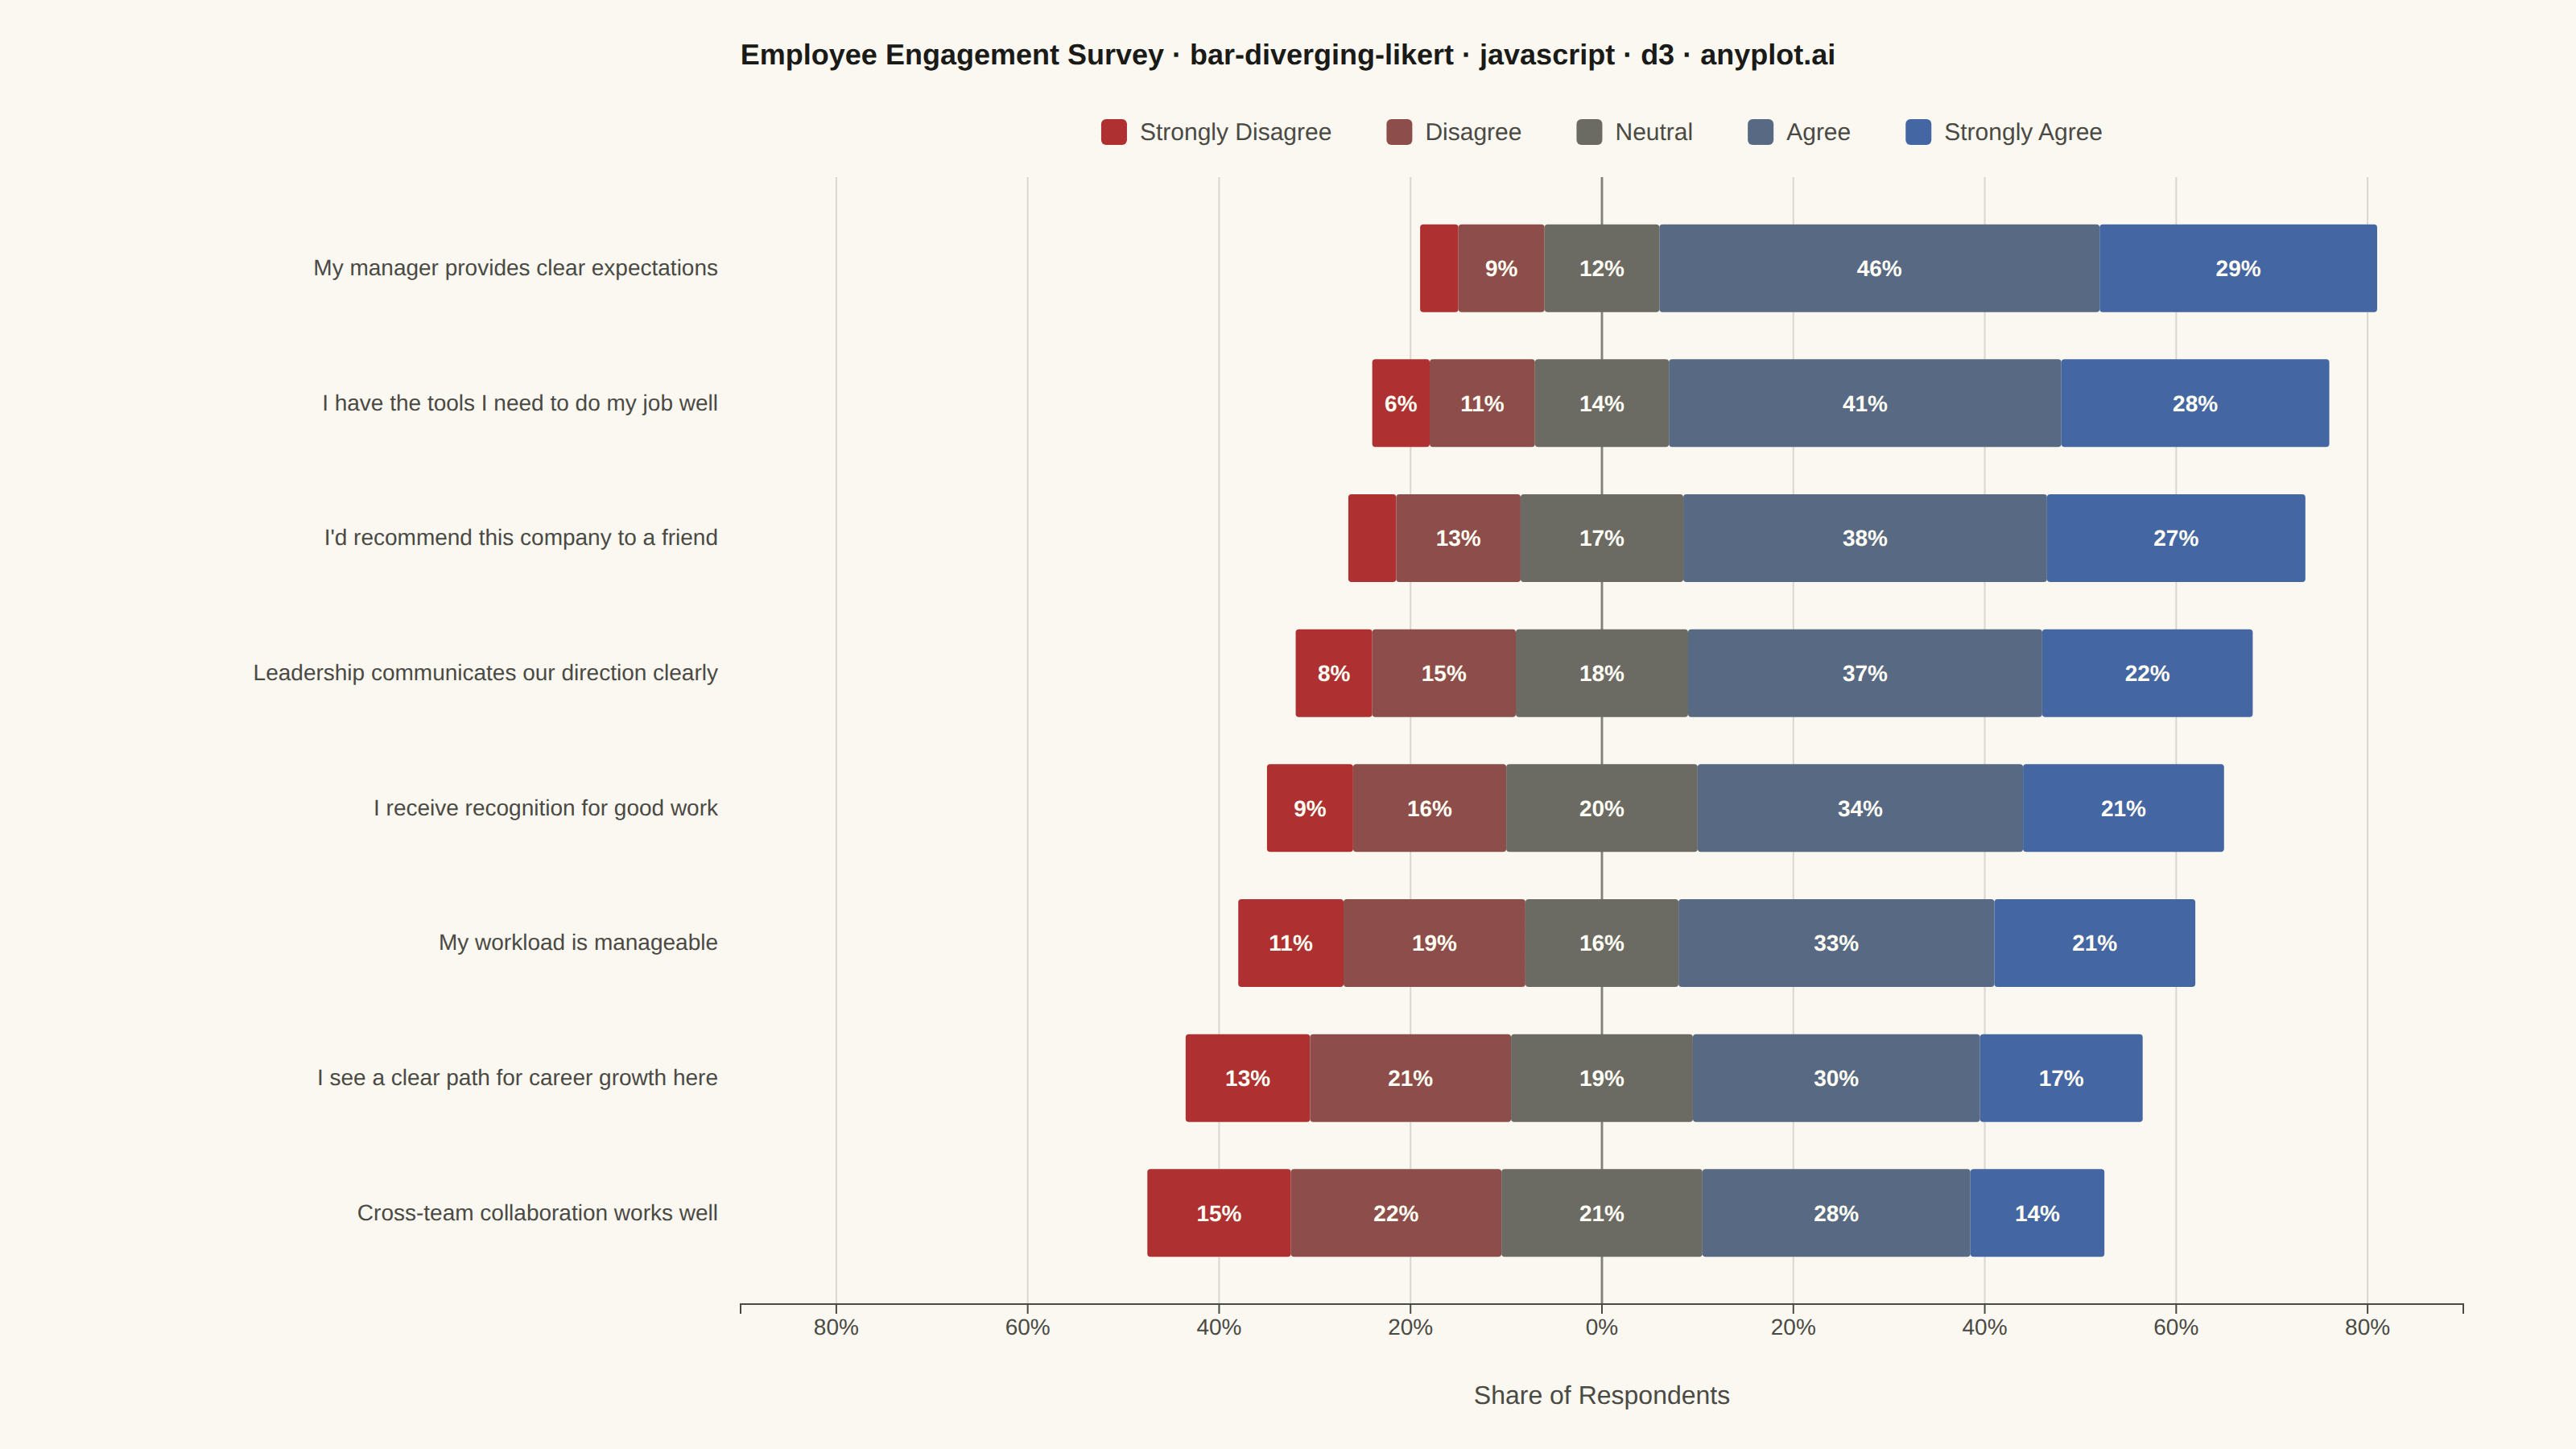
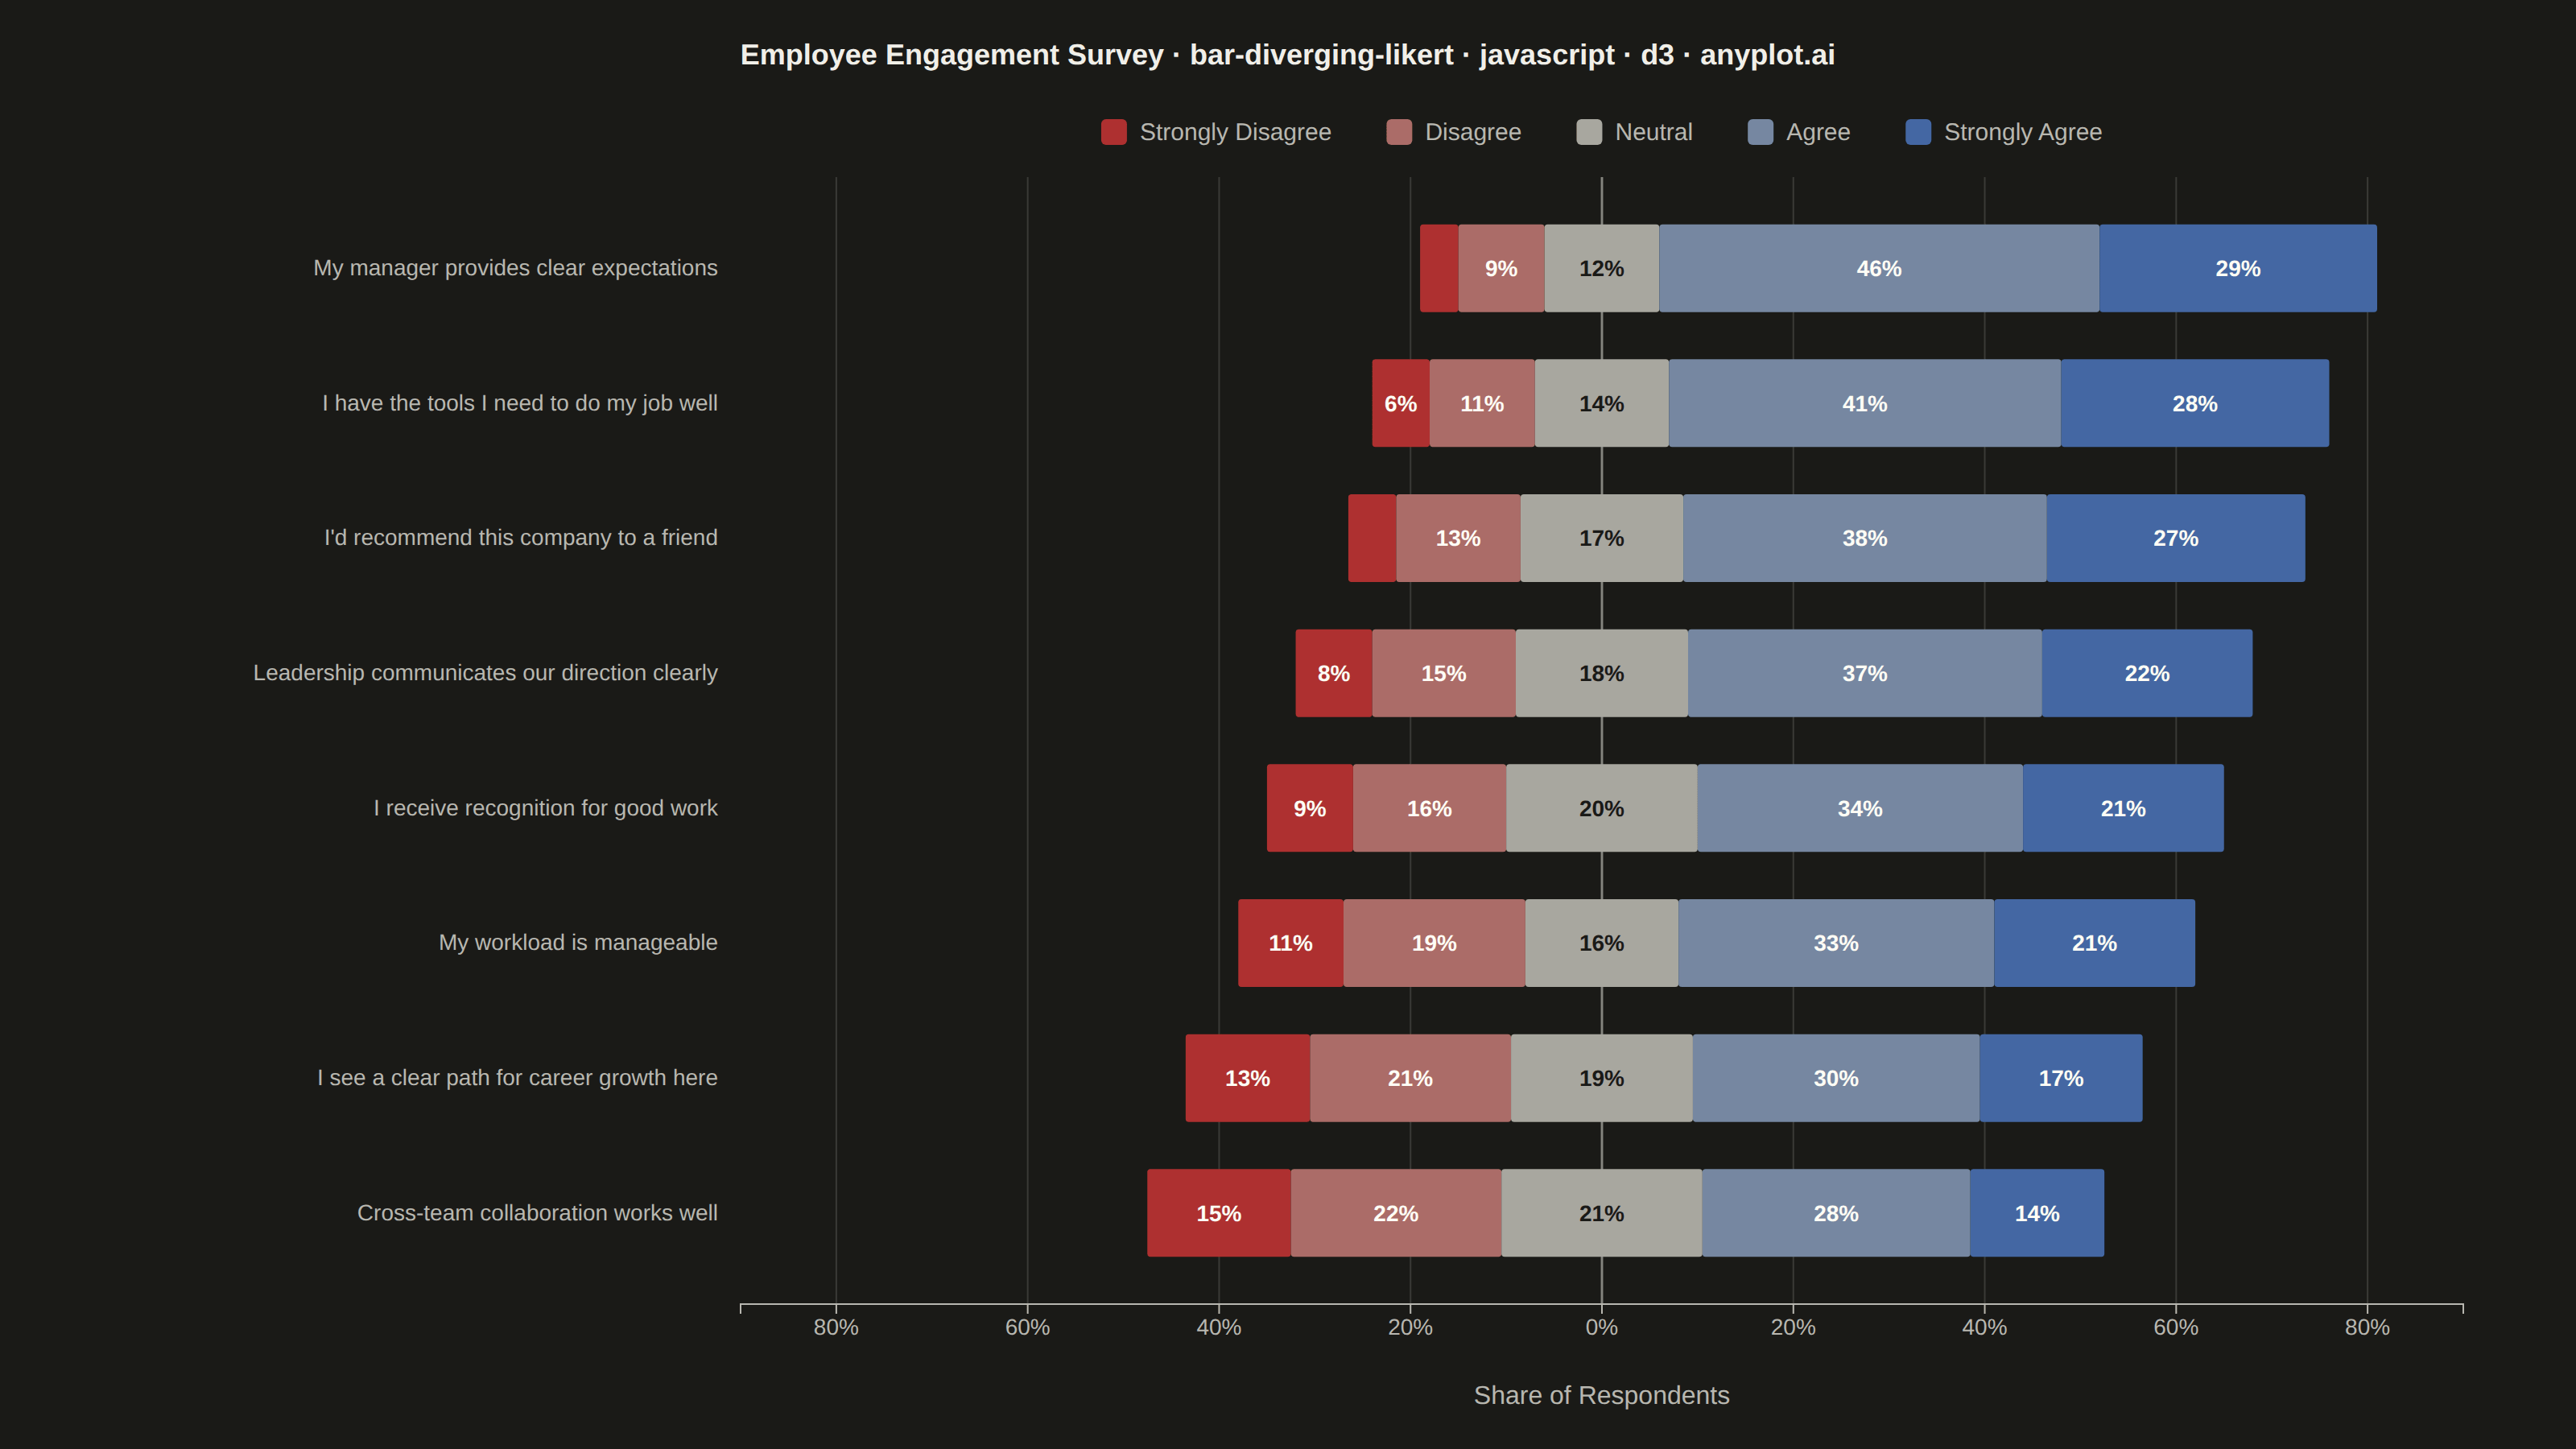
A diverging stacked bar chart designed for Likert scale survey responses (e.g., Strongly Disagree to Strongly Agree). Bars diverge from a central neutral point, with negative responses (Disagree, Strongly Disagree) extending left and positive responses (Agree, Strongly Agree) extending right. This layout makes it easy to compare overall agreement levels across multiple survey questions at a glance.
// anyplot.ai
// bar-diverging-likert: Likert Scale Diverging Bar Chart
// Library: d3 7.9.0 | JavaScript 22.23.2
// Quality: 91/100 | Created: 2026-08-24

//# anyplot-orientation: landscape
const t = window.ANYPLOT_TOKENS;
const { width, height } = window.ANYPLOT_SIZE;
const margin = { top: 110, right: 70, bottom: 90, left: 460 };
const iw = width - margin.left - margin.right;
const ih = height - margin.top - margin.bottom;

// --- Data (in-memory, deterministic; each row sums to 100%) -----------------
// Employee engagement survey, 5-point Likert scale
const questions = [
  { question: "My manager provides clear expectations", strongly_disagree: 4, disagree: 9, neutral: 12, agree: 46, strongly_agree: 29 },
  { question: "I have the tools I need to do my job well", strongly_disagree: 6, disagree: 11, neutral: 14, agree: 41, strongly_agree: 28 },
  { question: "I'd recommend this company to a friend", strongly_disagree: 5, disagree: 13, neutral: 17, agree: 38, strongly_agree: 27 },
  { question: "Leadership communicates our direction clearly", strongly_disagree: 8, disagree: 15, neutral: 18, agree: 37, strongly_agree: 22 },
  { question: "I receive recognition for good work", strongly_disagree: 9, disagree: 16, neutral: 20, agree: 34, strongly_agree: 21 },
  { question: "My workload is manageable", strongly_disagree: 11, disagree: 19, neutral: 16, agree: 33, strongly_agree: 21 },
  { question: "I see a clear path for career growth here", strongly_disagree: 13, disagree: 21, neutral: 19, agree: 30, strongly_agree: 17 },
  { question: "Cross-team collaboration works well", strongly_disagree: 15, disagree: 22, neutral: 21, agree: 28, strongly_agree: 14 },
];

// Sort by net agreement (agree + strongly_agree − disagree − strongly_disagree), descending
const netAgreement = (d) => d.agree + d.strongly_agree - d.disagree - d.strongly_disagree;
questions.sort((a, b) => netAgreement(b) - netAgreement(a));

// --- Categories & diverging colors (Imprint anchors: red <-> muted <-> blue) -
const red = t.palette[4]; // #AE3030 — semantic anchor, negative pole
const blue = t.palette[2]; // #4467A3 — Imprint blue, positive pole
const muted = t.theme === "light" ? "#6B6A63" : "#A8A79F"; // muted semantic anchor (theme-adaptive)
const categories = [
  { key: "strongly_disagree", label: "Strongly Disagree", color: red },
  { key: "disagree", label: "Disagree", color: d3.interpolateRgb(red, muted)(0.5) },
  { key: "neutral", label: "Neutral", color: muted },
  { key: "agree", label: "Agree", color: d3.interpolateRgb(blue, muted)(0.5) },
  { key: "strongly_agree", label: "Strongly Agree", color: blue },
];
const colorOf = new Map(categories.map((c) => [c.key, c.color]));

// --- Diverging segments: neutral splits evenly across the center baseline ---
const segmentsFor = (d) => {
  const half = d.neutral / 2;
  return [
    { key: "strongly_disagree", x0: -(half + d.disagree + d.strongly_disagree), x1: -(half + d.disagree), value: d.strongly_disagree },
    { key: "disagree", x0: -(half + d.disagree), x1: -half, value: d.disagree },
    { key: "neutral", x0: -half, x1: half, value: d.neutral },
    { key: "agree", x0: half, x1: half + d.agree, value: d.agree },
    { key: "strongly_agree", x0: half + d.agree, x1: half + d.agree + d.strongly_agree, value: d.strongly_agree },
  ];
};
const rows = questions.map((d) => ({ question: d.question, segments: segmentsFor(d) }));
const maxExtent = d3.max(rows, (r) => d3.max(r.segments, (s) => Math.max(Math.abs(s.x0), Math.abs(s.x1))));
const roundedMax = Math.ceil(maxExtent / 10) * 10;

// --- Scales -------------------------------------------------------------
const x = d3.scaleLinear().domain([-roundedMax, roundedMax]).range([0, iw]);
const y = d3.scaleBand().domain(questions.map((d) => d.question)).range([0, ih]).padding(0.35);

// --- SVG mount ----------------------------------------------------------
const svg = d3.select("#container").append("svg").attr("width", width).attr("height", height);
const g = svg.append("g").attr("transform", `translate(${margin.left},${margin.top})`);

// --- Value-axis gridlines (vertical, subtle) --------------------------------
g.append("g")
  .attr("class", "grid")
  .attr("transform", `translate(0,${ih})`)
  .call(d3.axisBottom(x).tickSize(-ih).tickFormat(""))
  .call((sel) => sel.select(".domain").remove())
  .selectAll("line")
  .attr("stroke", t.grid);

// --- Center baseline (x = 0) ------------------------------------------------
g.append("line")
  .attr("x1", x(0)).attr("x2", x(0))
  .attr("y1", 0).attr("y2", ih)
  .attr("stroke", t.inkSoft).attr("stroke-width", 1.5).attr("opacity", 0.6);

// --- Bars ---------------------------------------------------------------
const rowG = g.selectAll(".row").data(rows).join("g")
  .attr("class", "row")
  .attr("transform", (d) => `translate(0,${y(d.question)})`);

rowG.selectAll("rect").data((d) => d.segments).join("rect")
  .attr("x", (s) => x(s.x0))
  .attr("width", (s) => x(s.x1) - x(s.x0))
  .attr("y", 0)
  .attr("height", y.bandwidth())
  .attr("rx", 2)
  .attr("fill", (s) => colorOf.get(s.key));

// --- Percentage labels inside segments (where space permits) ---------------
const textColorFor = (fill) => {
  const c = d3.rgb(fill);
  const lum = 0.2126 * (c.r / 255) + 0.7152 * (c.g / 255) + 0.0722 * (c.b / 255);
  return lum > 0.55 ? "#1A1A17" : "#FFFDF6";
};
rowG.selectAll("text.segment-label")
  .data((d) => d.segments.filter((s) => x(s.x1) - x(s.x0) > 34))
  .join("text")
  .attr("class", "segment-label")
  .attr("x", (s) => (x(s.x0) + x(s.x1)) / 2)
  .attr("y", y.bandwidth() / 2)
  .attr("dy", "0.35em")
  .attr("text-anchor", "middle")
  .style("font-size", "14px")
  .style("font-weight", "600")
  .attr("fill", (s) => textColorFor(colorOf.get(s.key)))
  .text((s) => `${Math.round(s.value)}%`);

// --- Y-axis: question labels --------------------------------------------
const yAxis = g.append("g").call(d3.axisLeft(y).tickSize(0).tickPadding(14));
yAxis.select(".domain").remove();
yAxis.selectAll("text").attr("fill", t.inkSoft).style("font-size", "14px");

// --- X-axis: percentage ticks, mirrored around the center -------------------
const xAxis = g.append("g")
  .attr("transform", `translate(0,${ih})`)
  .call(d3.axisBottom(x).tickFormat((d) => `${Math.abs(d)}%`).ticks(6));
xAxis.select(".domain").attr("stroke", t.inkSoft);
xAxis.selectAll("line").attr("stroke", t.inkSoft);
xAxis.selectAll("text").attr("fill", t.inkSoft).style("font-size", "14px");

g.append("text")
  .attr("x", iw / 2).attr("y", ih + 62)
  .attr("text-anchor", "middle")
  .attr("fill", t.inkSoft)
  .style("font-size", "16px")
  .text("Share of Respondents");

// --- Legend (measured, then centered) ---------------------------------------
const legend = svg.append("g").attr("transform", "translate(0,74)");
const swatchSize = 16;
const legendItems = legend.selectAll("g.legend-item").data(categories).join("g")
  .attr("class", "legend-item");
legendItems.append("rect")
  .attr("width", swatchSize).attr("height", swatchSize).attr("rx", 3)
  .attr("fill", (d) => d.color);
legendItems.append("text")
  .attr("x", swatchSize + 8).attr("y", swatchSize - 3)
  .style("font-size", "15px")
  .attr("fill", t.inkSoft)
  .text((d) => d.label);

const itemGap = 34;
const widths = [];
legendItems.each(function () { widths.push(this.getBBox().width); });
const totalWidth = widths.reduce((a, b) => a + b, 0) + itemGap * (widths.length - 1);
let cursor = margin.left + iw / 2 - totalWidth / 2;
legendItems.each(function (d, i) {
  d3.select(this).attr("transform", `translate(${cursor},0)`);
  cursor += widths[i] + itemGap;
});

// --- Title ----------------------------------------------------------------
svg.append("text")
  .attr("x", width / 2).attr("y", 40)
  .attr("text-anchor", "middle")
  .attr("fill", t.ink)
  .style("font-size", "18px")
  .style("font-weight", "600")
  .text("Employee Engagement Survey · bar-diverging-likert · javascript · d3 · anyplot.ai");
Runnable source as JSON, for any HTTP client: https://api.anyplot.ai/specs/bar-diverging-likert/d3/code. Any spec id and library id listed in llms-full.txt fit the same URL shape; every URL below is complete and callable.
{
  "spec_id": "bar-diverging-likert",
  "language": "javascript",
  "library": "d3",
  "page": "https://anyplot.ai/bar-diverging-likert/javascript/d3",
  "hub": "https://anyplot.ai/bar-diverging-likert",
  "code_json": "https://api.anyplot.ai/specs/bar-diverging-likert/d3/code",
  "spec_json": "https://api.anyplot.ai/specs/bar-diverging-likert",
  "render_light_png": "https://storage.googleapis.com/anyplot-images/plots/bar-diverging-likert/javascript/d3/plot-light.png",
  "render_dark_png": "https://storage.googleapis.com/anyplot-images/plots/bar-diverging-likert/javascript/d3/plot-dark.png",
  "interactive_light_html": "https://storage.googleapis.com/anyplot-images/plots/bar-diverging-likert/javascript/d3/plot-light.html",
  "interactive_dark_html": "https://storage.googleapis.com/anyplot-images/plots/bar-diverging-likert/javascript/d3/plot-dark.html",
  "quality_score": 91.0,
  "license": "MIT",
  "guide": "https://anyplot.ai/llms.txt"
}
Part of Likert Scale Diverging Bar Chart on anyplot.ai.