The same plot in 14 other libraries — JavaScript: Chart.js, D3.js, Highcharts, MUI X Charts; Python: Altair, Bokeh, lets-plot, Matplotlib, Plotly, plotnine, Pygal, Seaborn; R: ggplot2; Julia: Makie.jl. Compare all 15 side by side: Likert Scale Diverging Bar Chart in Python, R, Julia and JavaScript.
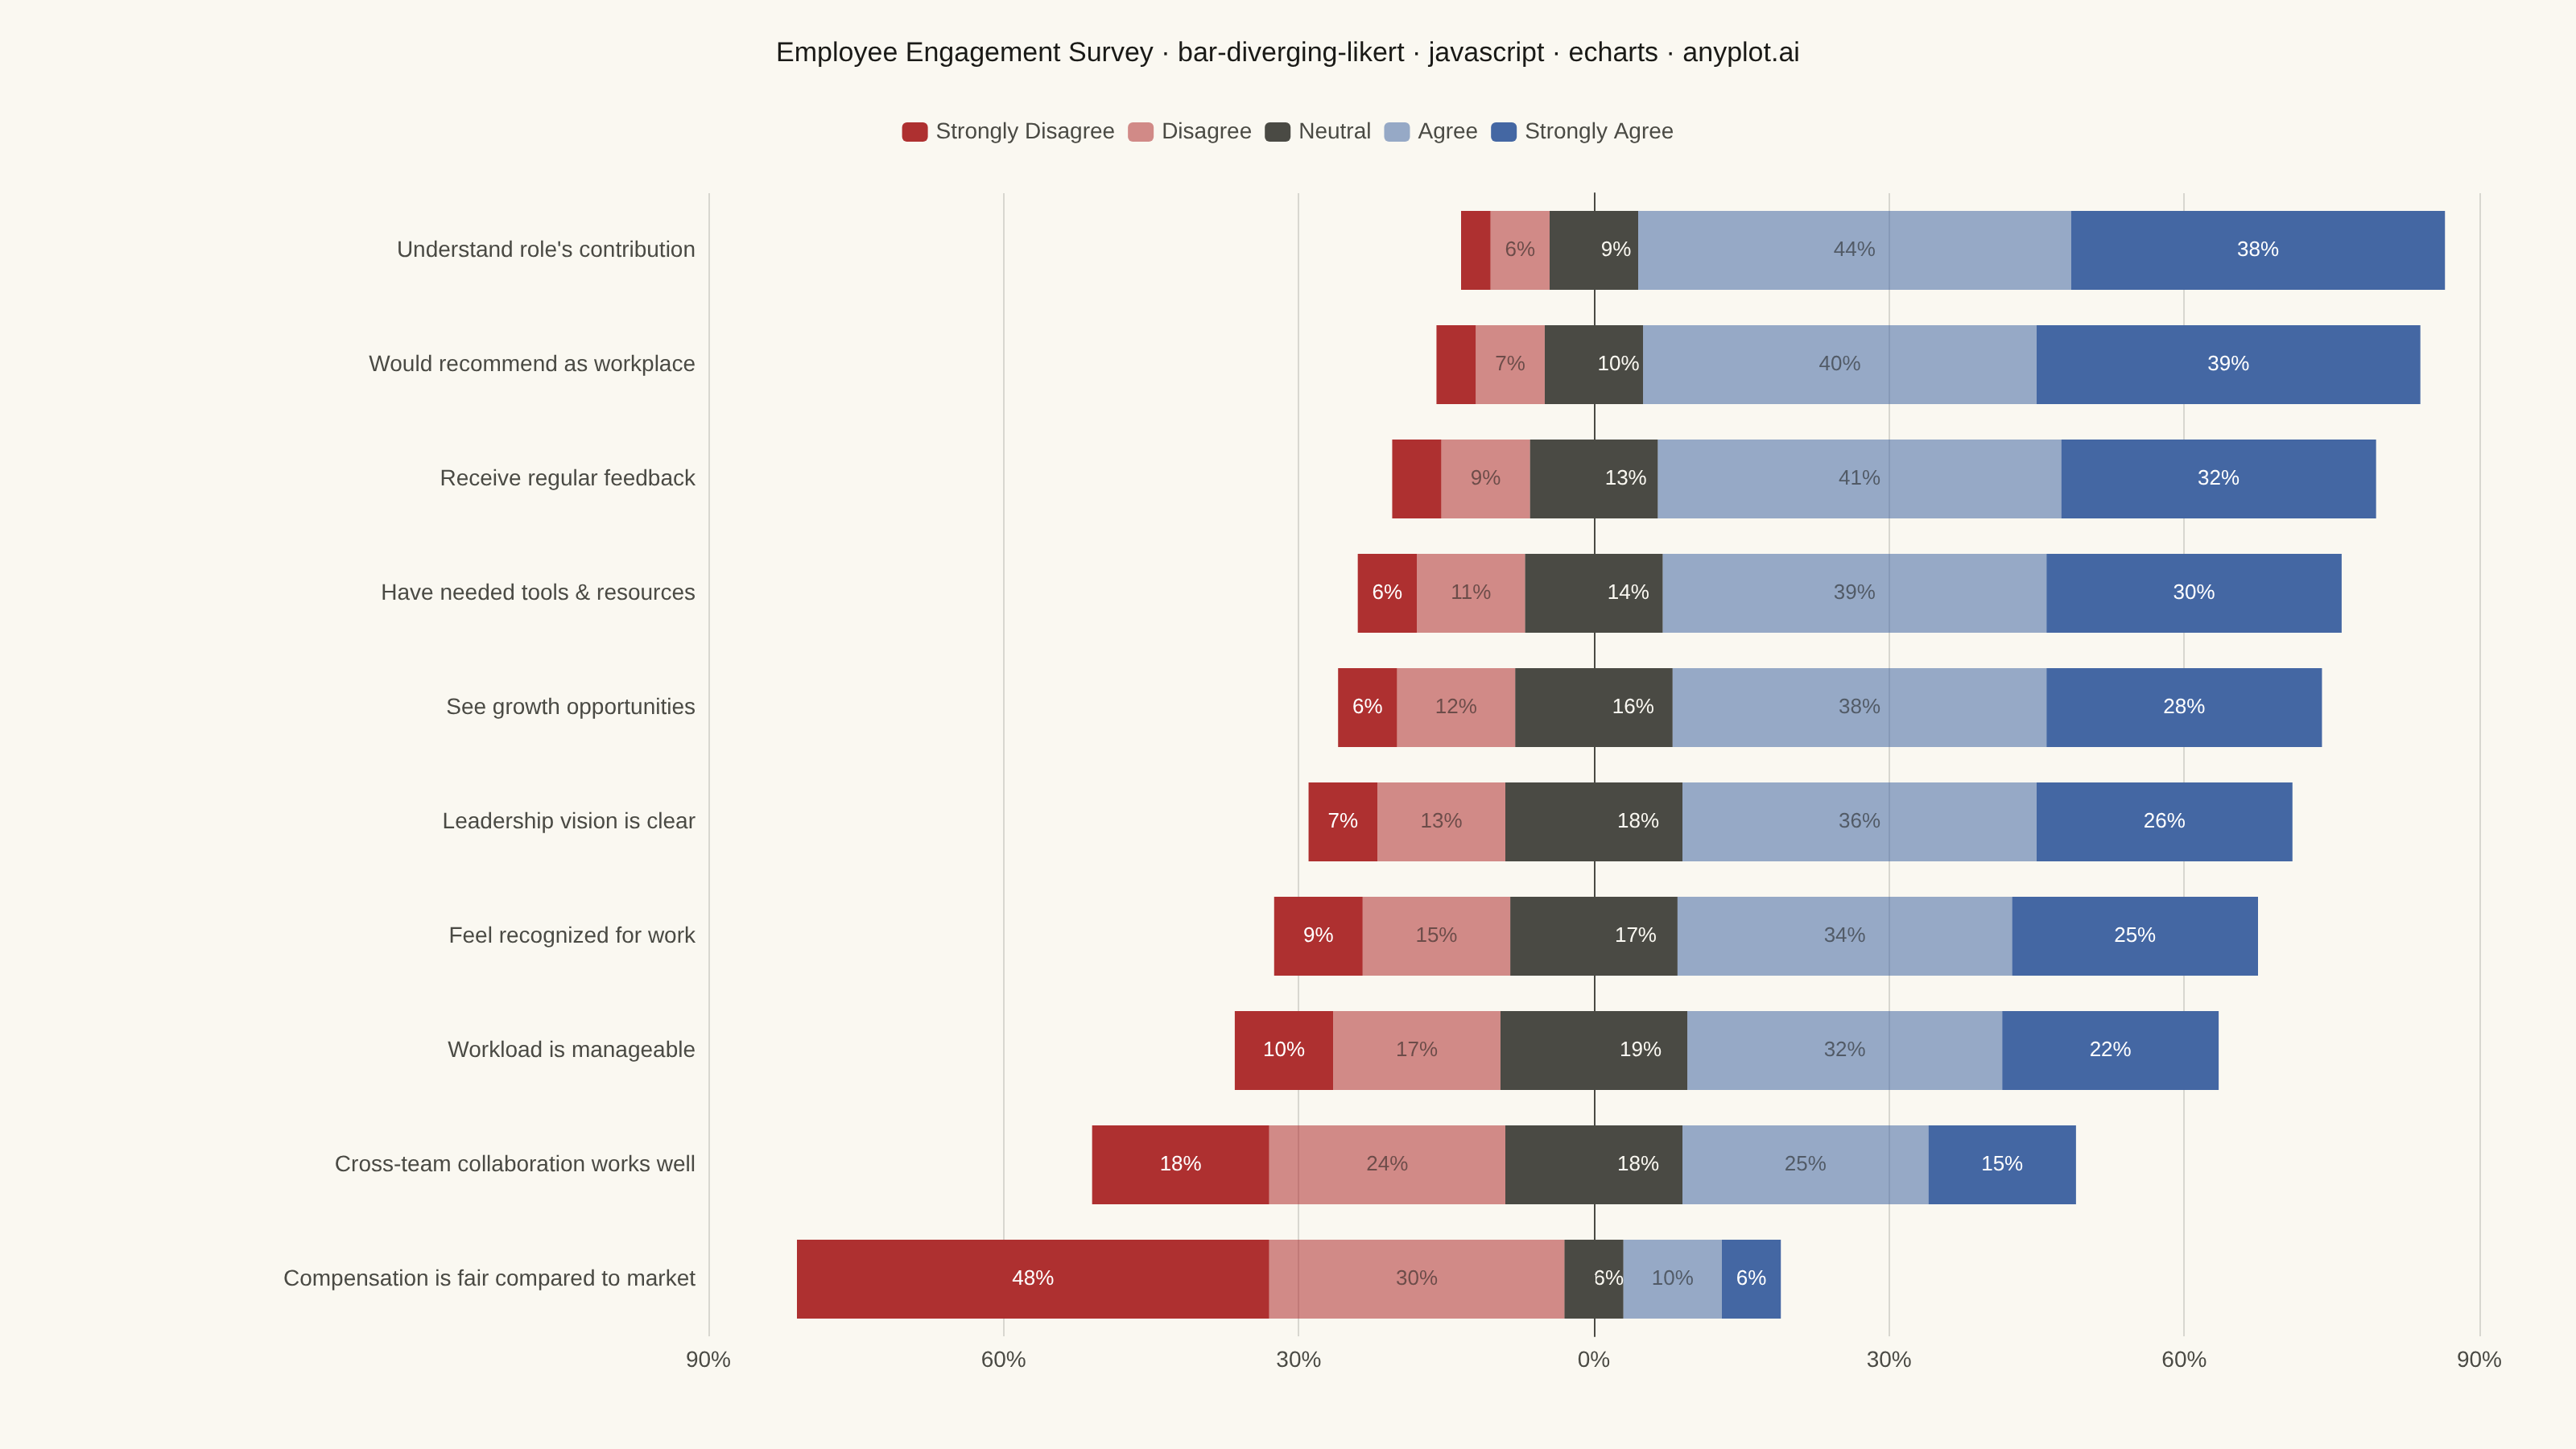
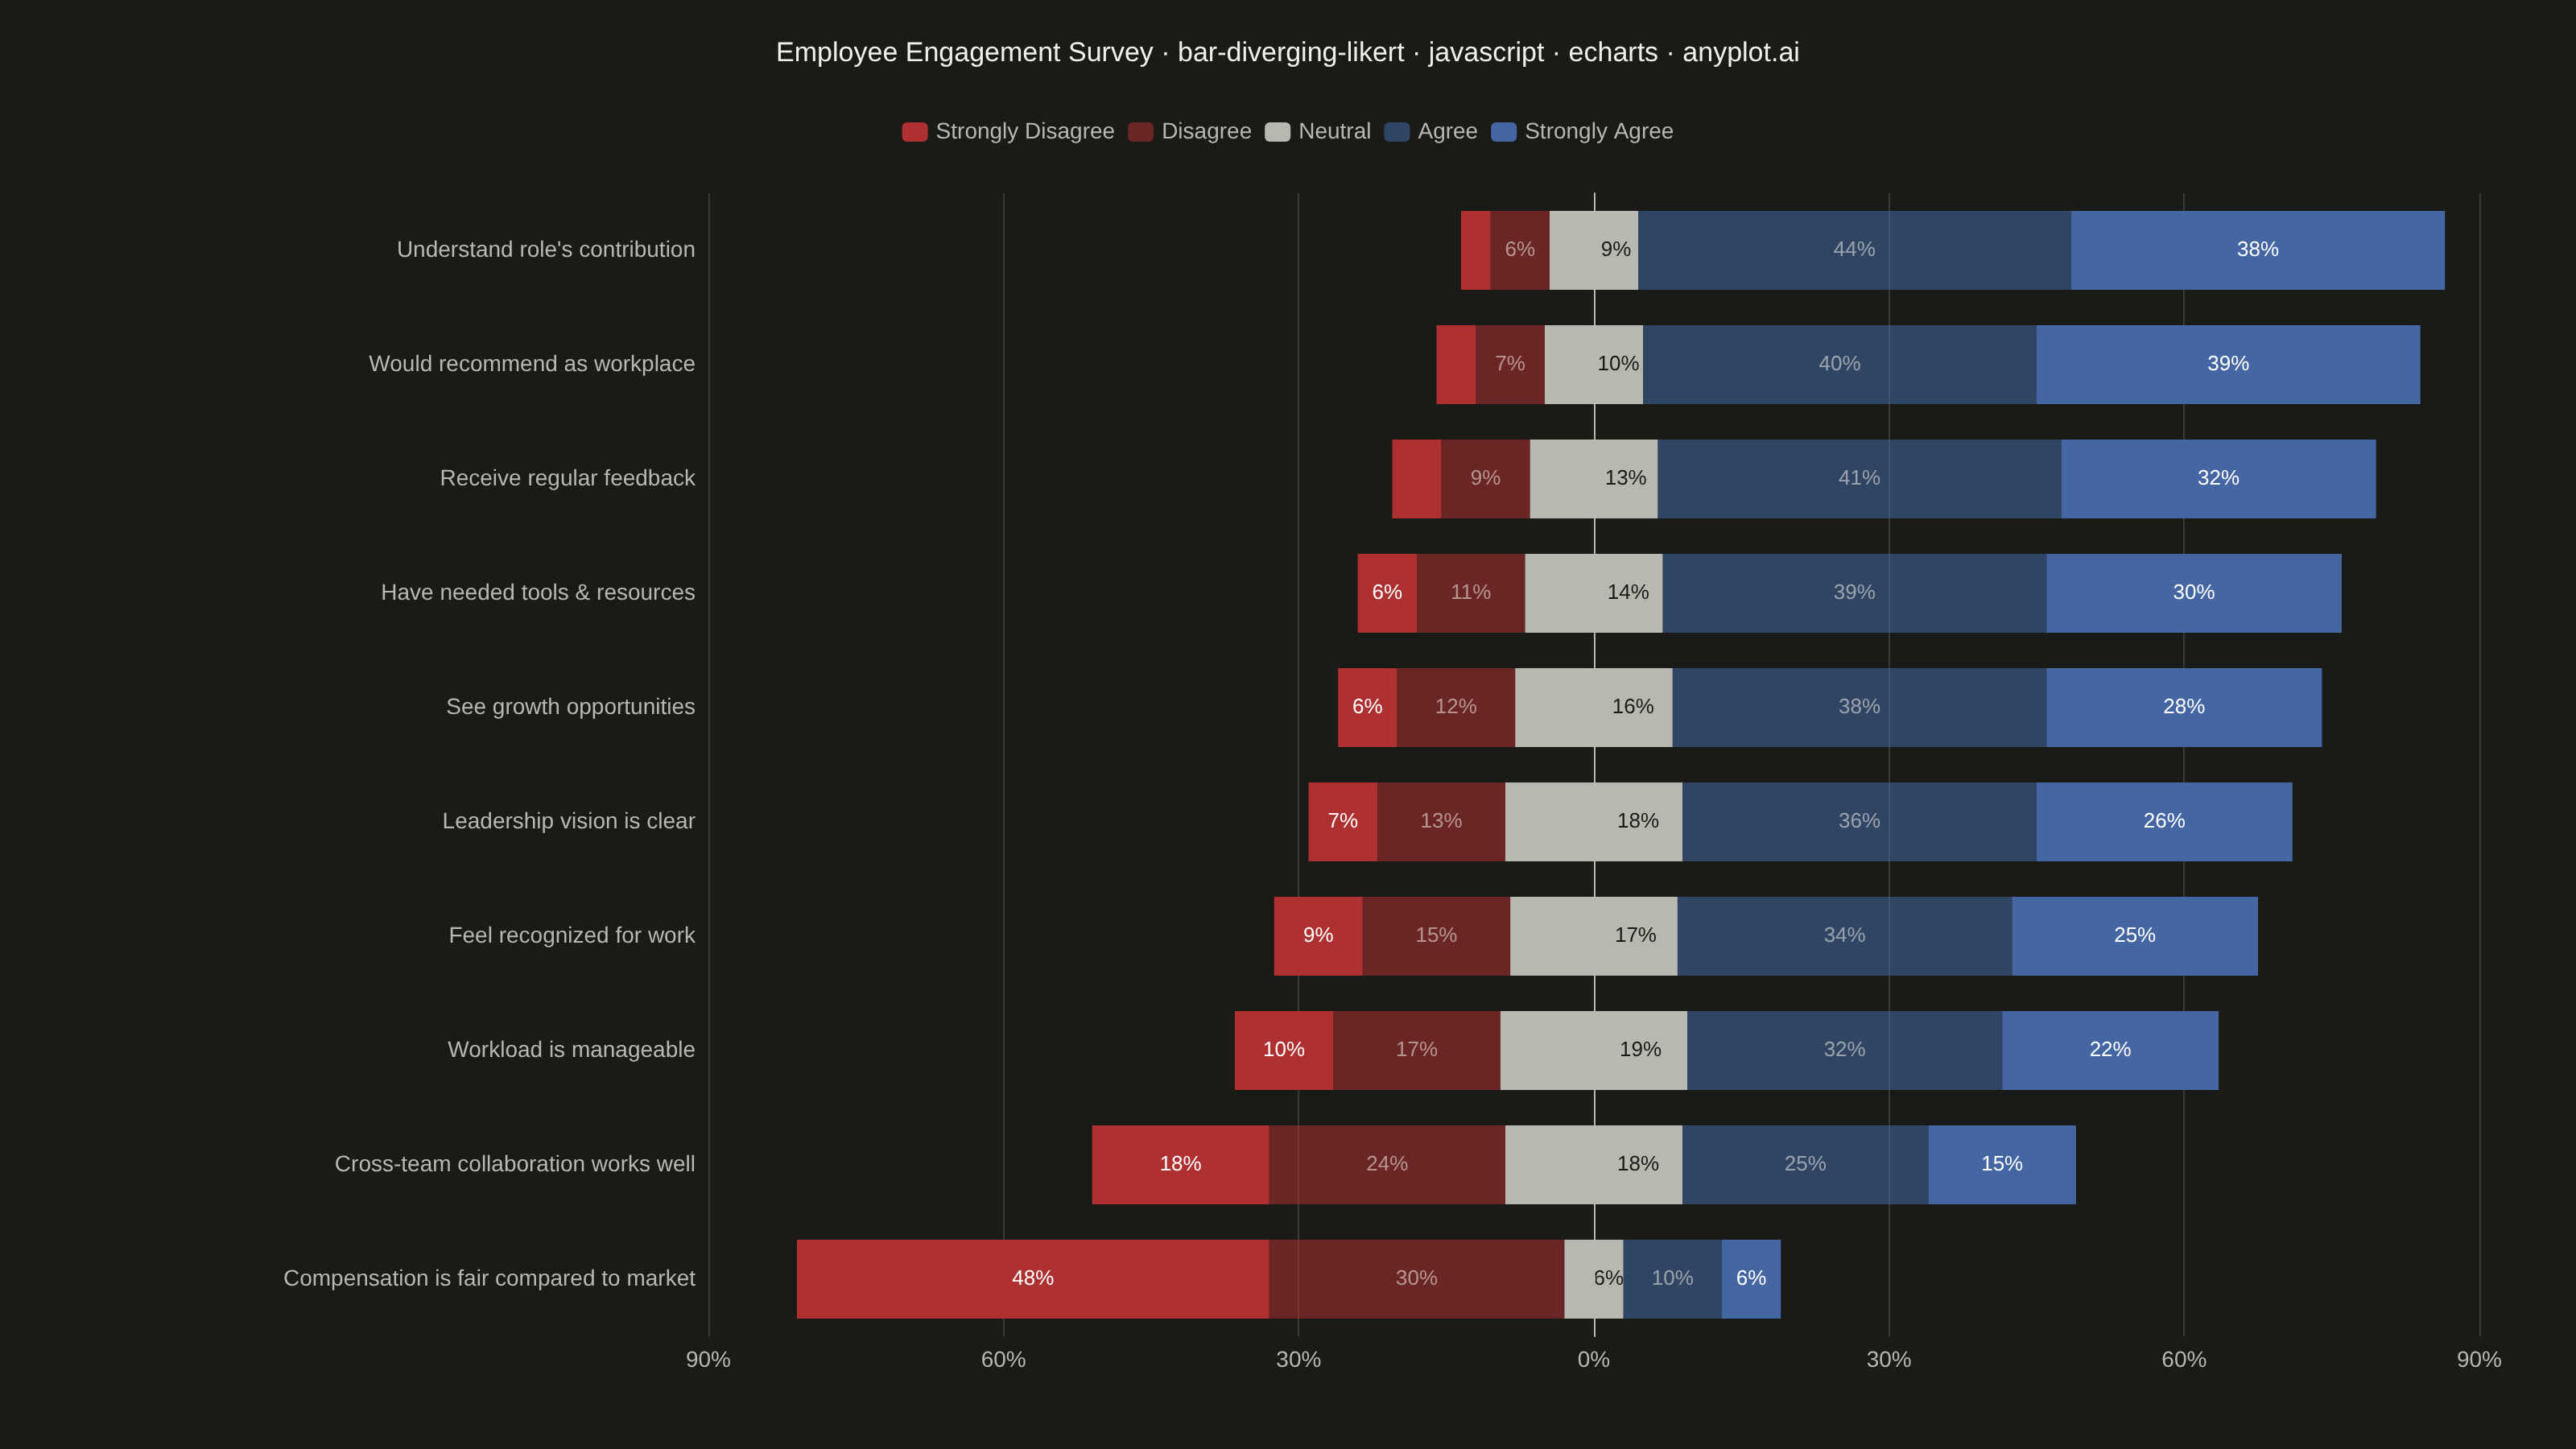
A diverging stacked bar chart designed for Likert scale survey responses (e.g., Strongly Disagree to Strongly Agree). Bars diverge from a central neutral point, with negative responses (Disagree, Strongly Disagree) extending left and positive responses (Agree, Strongly Agree) extending right. This layout makes it easy to compare overall agreement levels across multiple survey questions at a glance.
// anyplot.ai
// bar-diverging-likert: Likert Scale Diverging Bar Chart
// Library: echarts 6.1.0 | JavaScript 22.23.2
// Quality: 93/100 | Created: 2026-08-24

const t = window.ANYPLOT_TOKENS;

// --- Data (in-memory, deterministic) ----------------------------------------
// Employee engagement survey, 5-point Likert scale, percentages sum to 100 per question.
const responses = [
  { question: "Understand role's contribution", sd: 3, d: 6, n: 9, a: 44, sa: 38 },
  { question: "Would recommend as workplace", sd: 4, d: 7, n: 10, a: 40, sa: 39 },
  { question: "Receive regular feedback", sd: 5, d: 9, n: 13, a: 41, sa: 32 },
  { question: "Have needed tools & resources", sd: 6, d: 11, n: 14, a: 39, sa: 30 },
  { question: "See growth opportunities", sd: 6, d: 12, n: 16, a: 38, sa: 28 },
  { question: "Leadership vision is clear", sd: 7, d: 13, n: 18, a: 36, sa: 26 },
  { question: "Feel recognized for work", sd: 9, d: 15, n: 17, a: 34, sa: 25 },
  { question: "Workload is manageable", sd: 10, d: 17, n: 19, a: 32, sa: 22 },
  { question: "Cross-team collaboration works well", sd: 18, d: 24, n: 18, a: 25, sa: 15 },
  { question: "Compensation is fair compared to market", sd: 48, d: 30, n: 6, a: 10, sa: 6 },
];

// Sort by net agreement (agree + strongly_agree - disagree - strongly_disagree), best first.
responses.sort((r1, r2) => (r2.a + r2.sa - r2.d - r2.sd) - (r1.a + r1.sa - r1.d - r1.sd));

const questions = responses.map((r) => r.question);

// Sentiment diverging scheme (Imprint semantic exception): red = disagreement,
// blue = agreement, muted = neutral — avoids a red/green pairing that would be
// ambiguous for deuteranopia/protanopia readers, per the spec's own guidance.
const RED = t.palette[4];
const BLUE = t.palette[2];
const MUTED = t.inkSoft; // theme-adaptive muted gray — no dedicated "muted" token in the JS harness

const maxExtent = Math.max(
  ...responses.map((r) => r.sd + r.d + r.n / 2),
  ...responses.map((r) => r.sa + r.a + r.n / 2)
);
// Round up to a multiple of 30 so the axis renders 3 evenly-spaced ticks per side.
const axisExtent = Math.ceil(maxExtent / 30) * 30;

const insideLabel = (color) => ({
  show: true,
  position: "inside",
  color,
  fontSize: 13,
  formatter: (p) => (Math.abs(p.value) >= 6 ? `${Math.round(Math.abs(p.value))}%` : ""),
});

const series = [
  {
    name: "Neutral",
    type: "bar",
    stack: "likert",
    data: responses.map((r) => -r.n / 2),
    itemStyle: { color: MUTED },
    label: { show: false },
  },
  {
    name: "Neutral",
    type: "bar",
    stack: "likert",
    data: responses.map((r) => r.n / 2),
    itemStyle: { color: MUTED },
    label: {
      show: true,
      position: "inside",
      color: t.pageBg,
      fontSize: 13,
      formatter: (p) => (responses[p.dataIndex].n >= 6 ? `${responses[p.dataIndex].n}%` : ""),
    },
    markLine: {
      silent: true,
      symbol: "none",
      lineStyle: { color: t.inkSoft, width: 1 },
      label: { show: false },
      data: [{ xAxis: 0 }],
    },
  },
  {
    name: "Disagree",
    type: "bar",
    stack: "likert",
    data: responses.map((r) => -r.d),
    itemStyle: { color: RED, opacity: 0.55 },
    label: insideLabel(t.ink),
  },
  {
    name: "Agree",
    type: "bar",
    stack: "likert",
    data: responses.map((r) => r.a),
    itemStyle: { color: BLUE, opacity: 0.55 },
    label: insideLabel(t.ink),
  },
  {
    name: "Strongly Disagree",
    type: "bar",
    stack: "likert",
    data: responses.map((r) => -r.sd),
    itemStyle: { color: RED },
    label: insideLabel("#FFFFFF"),
  },
  {
    name: "Strongly Agree",
    type: "bar",
    stack: "likert",
    data: responses.map((r) => r.sa),
    itemStyle: { color: BLUE },
    label: insideLabel("#FFFFFF"),
  },
];

// --- Init --------------------------------------------------------------------
const chart = echarts.init(document.getElementById("container"));

// --- Option --------------------------------------------------------------------
const title = "Employee Engagement Survey · bar-diverging-likert · javascript · echarts · anyplot.ai";
const titleFontSize = Math.max(14, Math.round(22 * Math.min(1, 67 / title.length)));

chart.setOption({
  animation: false,
  backgroundColor: "transparent",
  title: {
    text: title,
    left: "center",
    top: 20,
    textStyle: { color: t.ink, fontSize: titleFontSize, fontWeight: 500 },
  },
  legend: {
    data: ["Strongly Disagree", "Disagree", "Neutral", "Agree", "Strongly Agree"],
    top: 70,
    textStyle: { color: t.inkSoft, fontSize: 14 },
    itemWidth: 16,
    itemHeight: 12,
    selectedMode: false,
    icon: "roundRect",
  },
  grid: { left: 440, right: 60, top: 120, bottom: 70, containLabel: false },
  xAxis: {
    type: "value",
    min: -axisExtent,
    max: axisExtent,
    interval: axisExtent / 3,
    axisLabel: { color: t.inkSoft, fontSize: 14, formatter: (v) => `${Math.round(Math.abs(v))}%` },
    axisLine: { lineStyle: { color: t.inkSoft } },
    splitLine: { lineStyle: { color: t.grid } },
  },
  yAxis: {
    type: "category",
    inverse: true,
    data: questions,
    axisLabel: { color: t.inkSoft, fontSize: 14 },
    axisLine: { lineStyle: { color: t.inkSoft } },
    axisTick: { show: false },
    splitLine: { show: false },
  },
  series,
});
Runnable source as JSON, for any HTTP client: https://api.anyplot.ai/specs/bar-diverging-likert/echarts/code. Any spec id and library id listed in llms-full.txt fit the same URL shape; every URL below is complete and callable.
{
  "spec_id": "bar-diverging-likert",
  "language": "javascript",
  "library": "echarts",
  "page": "https://anyplot.ai/bar-diverging-likert/javascript/echarts",
  "hub": "https://anyplot.ai/bar-diverging-likert",
  "code_json": "https://api.anyplot.ai/specs/bar-diverging-likert/echarts/code",
  "spec_json": "https://api.anyplot.ai/specs/bar-diverging-likert",
  "render_light_png": "https://storage.googleapis.com/anyplot-images/plots/bar-diverging-likert/javascript/echarts/plot-light.png",
  "render_dark_png": "https://storage.googleapis.com/anyplot-images/plots/bar-diverging-likert/javascript/echarts/plot-dark.png",
  "interactive_light_html": "https://storage.googleapis.com/anyplot-images/plots/bar-diverging-likert/javascript/echarts/plot-light.html",
  "interactive_dark_html": "https://storage.googleapis.com/anyplot-images/plots/bar-diverging-likert/javascript/echarts/plot-dark.html",
  "quality_score": 93.0,
  "license": "MIT",
  "guide": "https://anyplot.ai/llms.txt"
}
Part of Likert Scale Diverging Bar Chart on anyplot.ai.