The same plot in 14 other libraries — Python: Altair, Bokeh, lets-plot, Matplotlib, Plotly, plotnine, Pygal, Seaborn; Julia: Makie.jl; JavaScript: Chart.js, D3.js, Apache ECharts, Highcharts, MUI X Charts. Compare all 15 side by side: Likert Scale Diverging Bar Chart in Python, R, Julia and JavaScript.
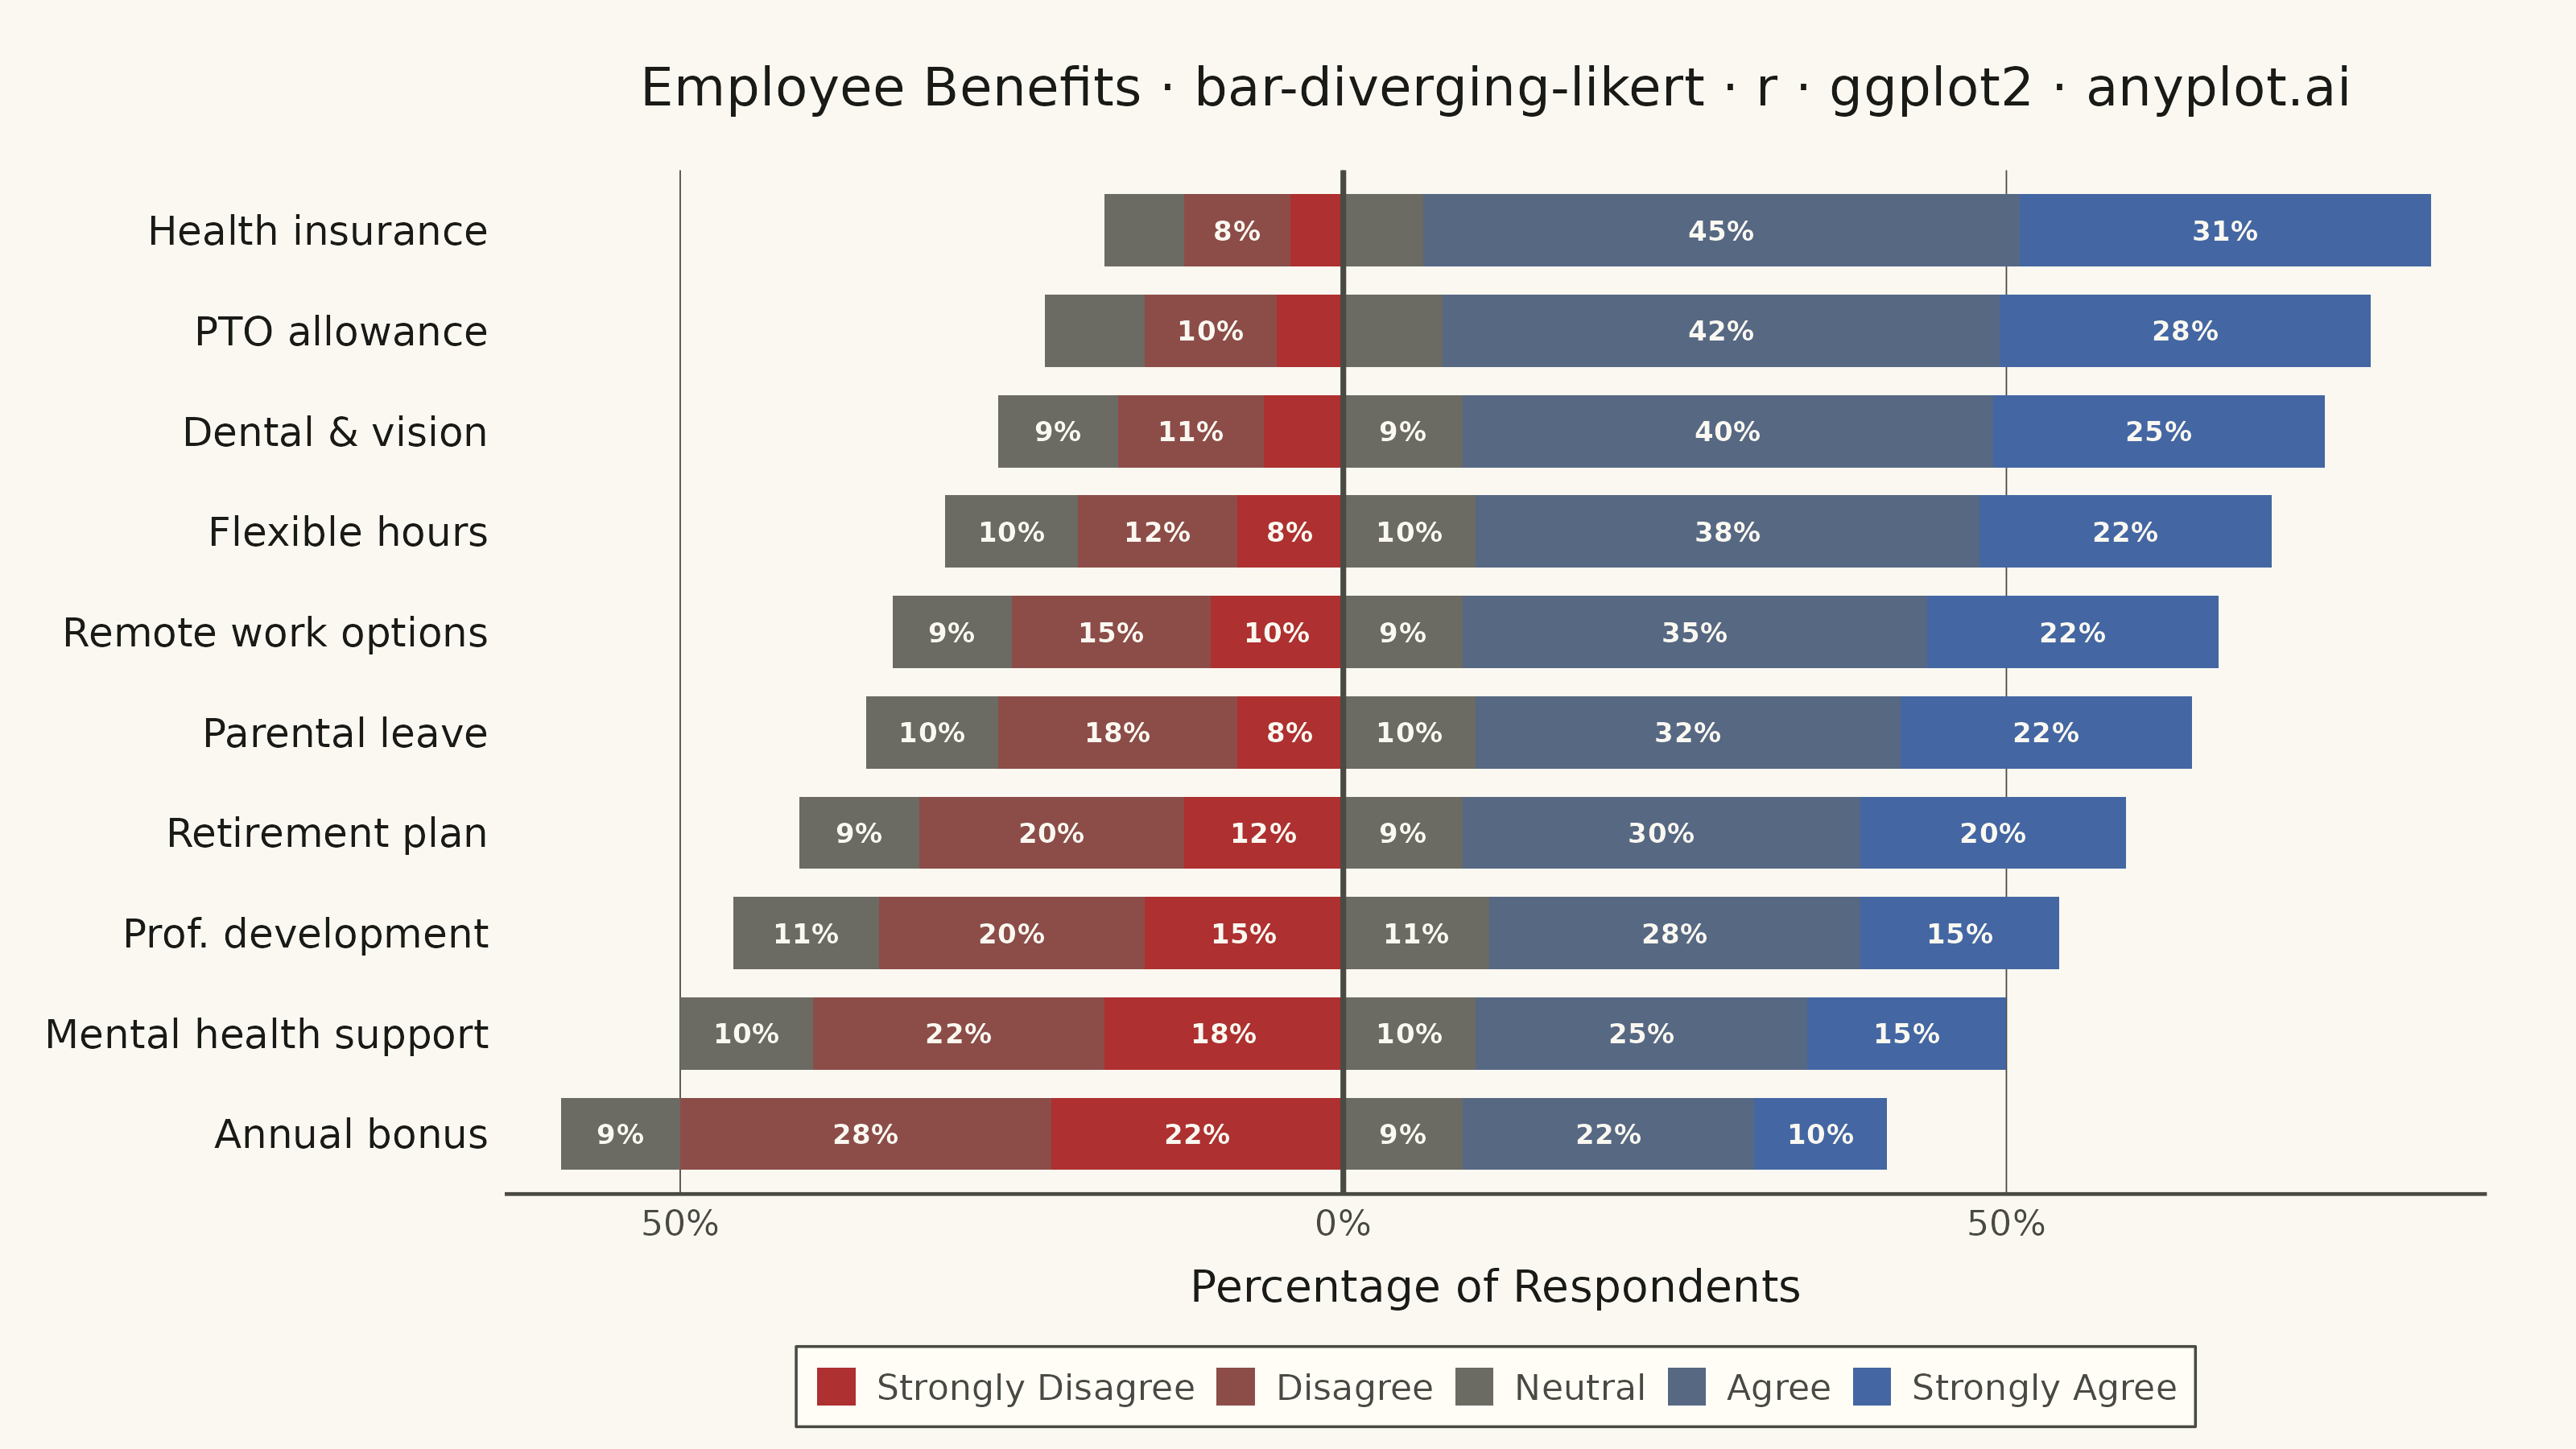
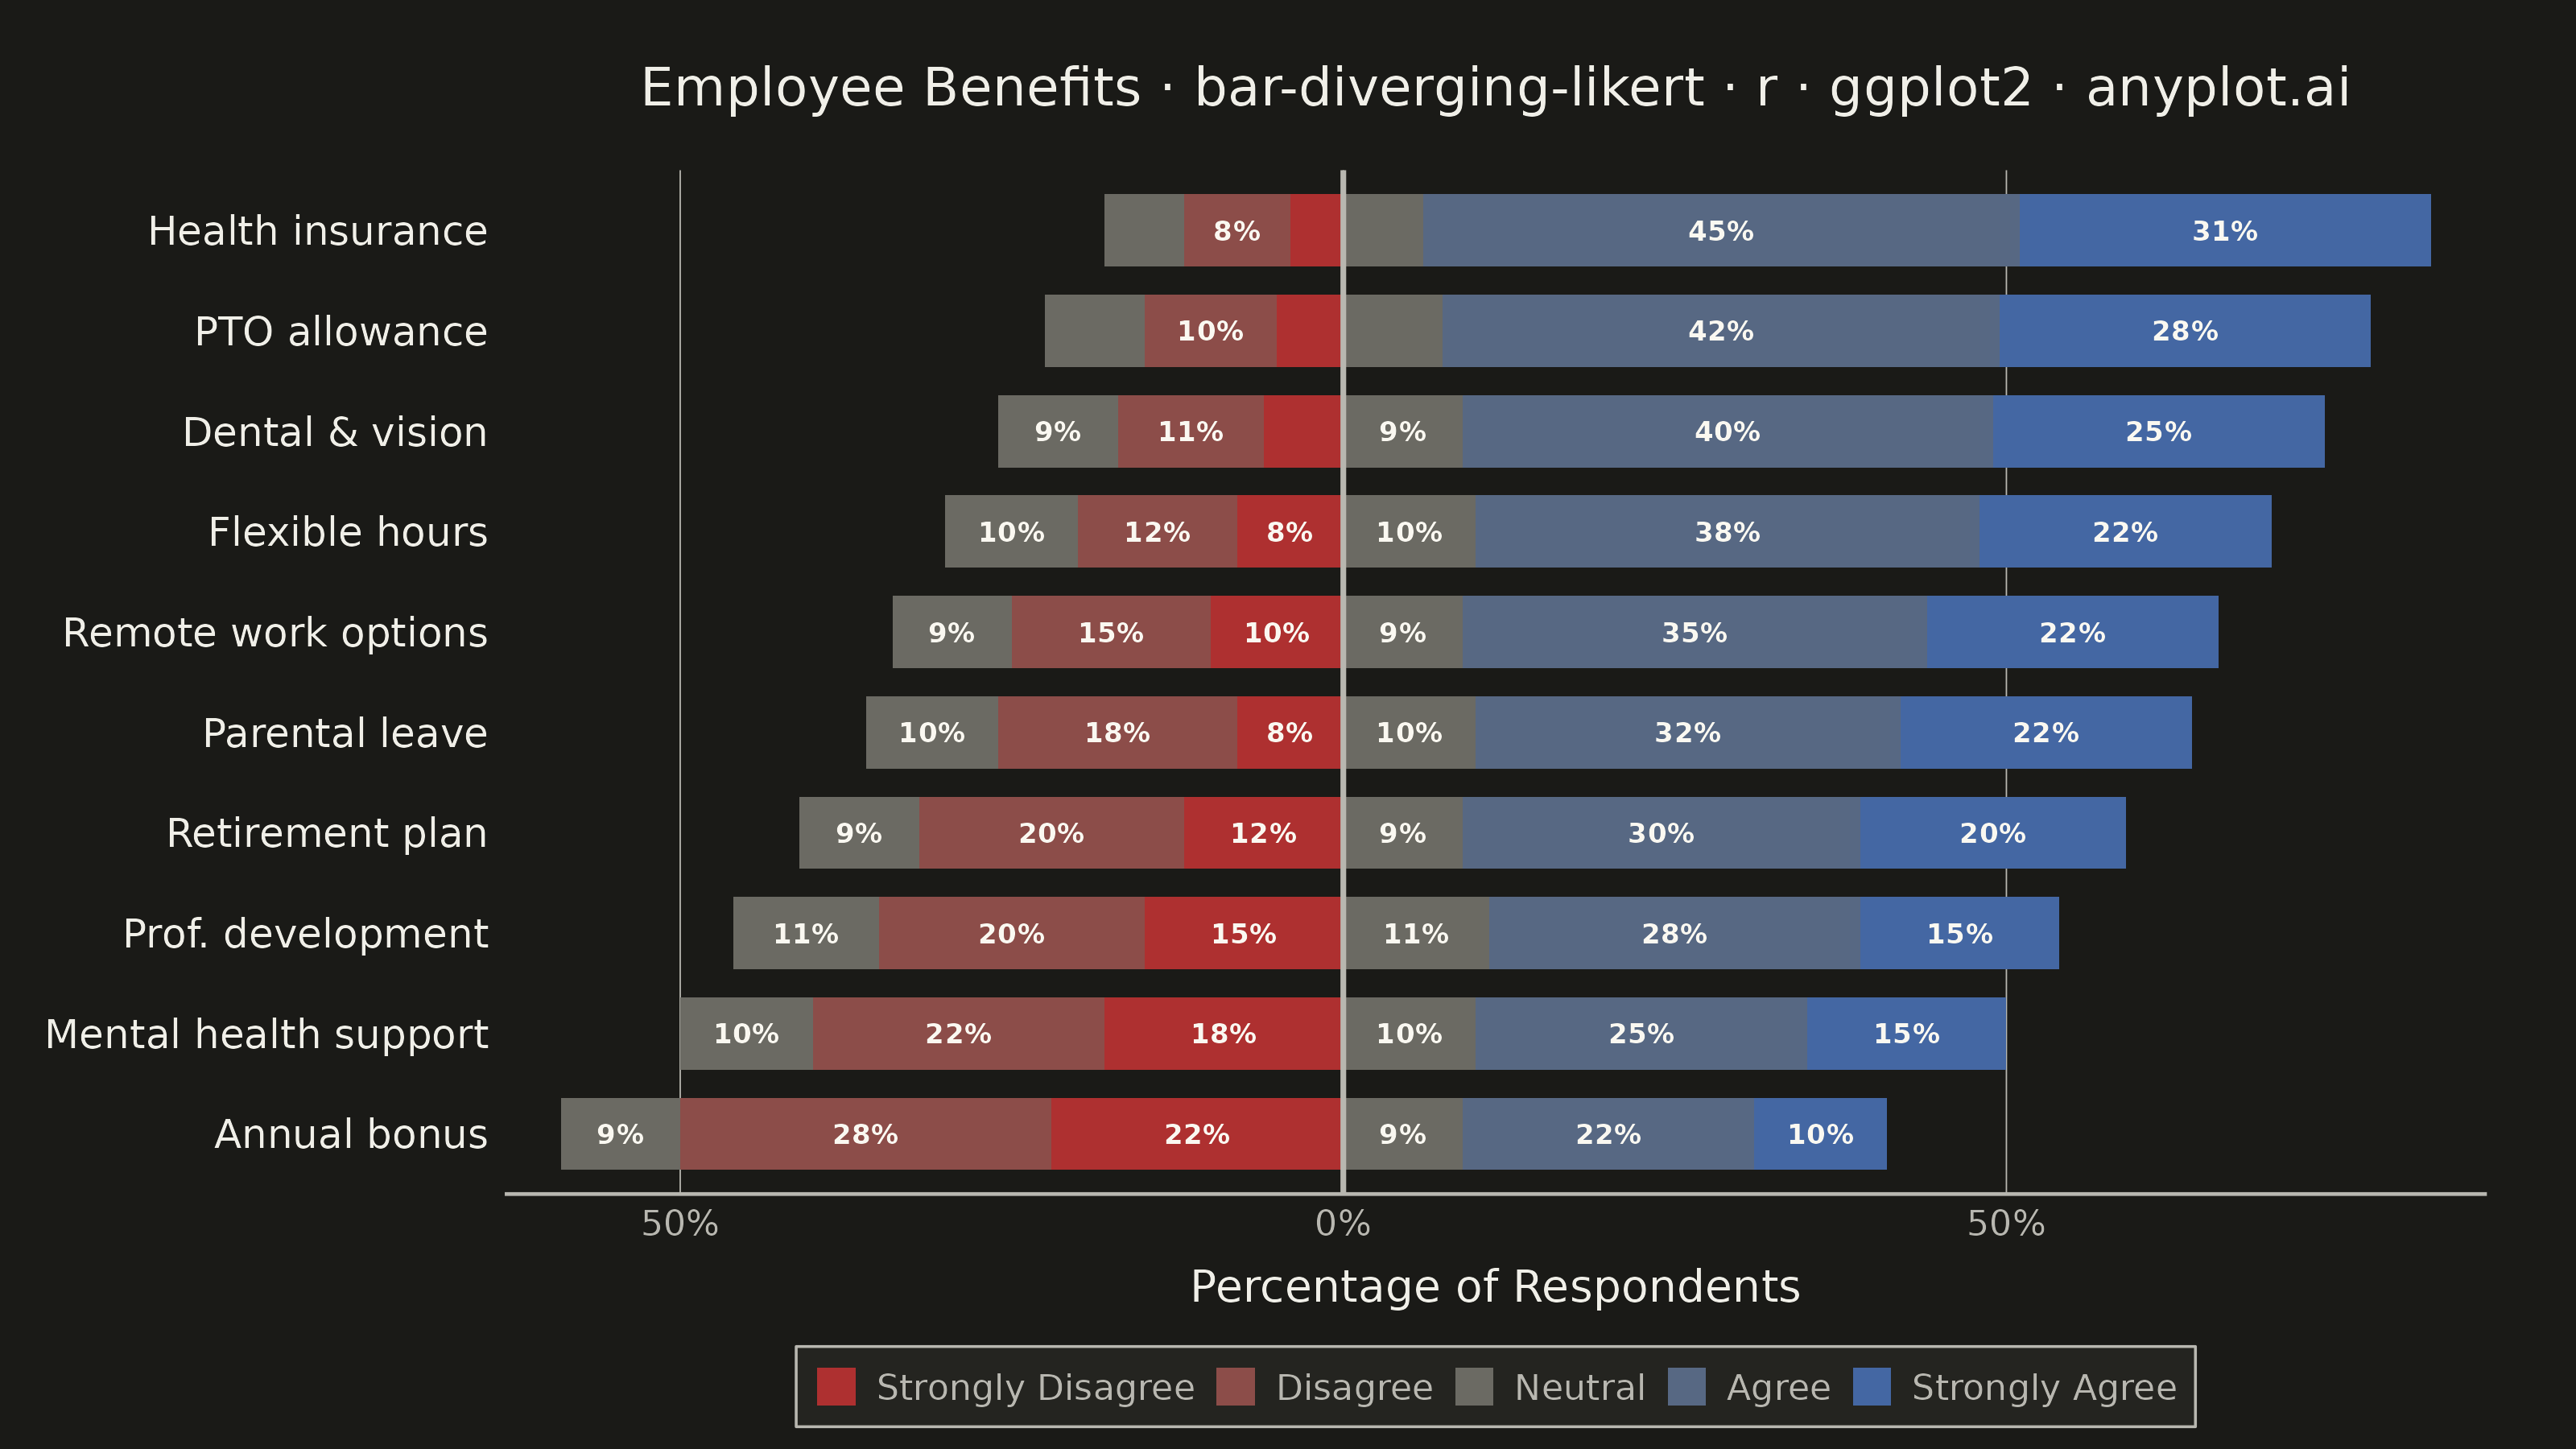
A diverging stacked bar chart designed for Likert scale survey responses (e.g., Strongly Disagree to Strongly Agree). Bars diverge from a central neutral point, with negative responses (Disagree, Strongly Disagree) extending left and positive responses (Agree, Strongly Agree) extending right. This layout makes it easy to compare overall agreement levels across multiple survey questions at a glance.
#' anyplot.ai
#' bar-diverging-likert: Likert Scale Diverging Bar Chart
#' Library: ggplot2 3.5.1 | R 4.4.1
#' Quality: 89/100 | Created: 2026-06-01

library(ggplot2)
library(dplyr)
library(tidyr)
library(scales)
library(ragg)

set.seed(42)

# --- Theme tokens ---
THEME       <- Sys.getenv("ANYPLOT_THEME", "light")
PAGE_BG     <- if (THEME == "light") "#FAF8F1" else "#1A1A17"
ELEVATED_BG <- if (THEME == "light") "#FFFDF6" else "#242420"
INK         <- if (THEME == "light") "#1A1A17" else "#F0EFE8"
INK_SOFT    <- if (THEME == "light") "#4A4A44" else "#B8B7B0"
INK_MUTED   <- if (THEME == "light") "#6B6A63" else "#A8A79F"

# Diverging colors from Imprint palette: red (bad) -> muted (neutral) -> blue (good)
# Semantic exception: negative sentiment = red (#AE3030), positive = blue (#4467A3)
likert_palette <- colorRampPalette(c("#AE3030", "#6B6A63", "#4467A3"))(5)

# --- Survey data: Employee Benefits Survey ---
questions <- c(
  "Health insurance",
  "PTO allowance",
  "Dental & vision",
  "Flexible hours",
  "Remote work options",
  "Parental leave",
  "Retirement plan",
  "Prof. development",
  "Mental health support",
  "Annual bonus"
)

survey_raw <- data.frame(
  question          = questions,
  strongly_disagree = c( 4,  5,  6,  8, 10,  8, 12, 15, 18, 22),
  disagree          = c( 8, 10, 11, 12, 15, 18, 20, 20, 22, 28),
  neutral           = c(12, 15, 18, 20, 18, 20, 18, 22, 20, 18),
  agree             = c(45, 42, 40, 38, 35, 32, 30, 28, 25, 22),
  strongly_agree    = c(31, 28, 25, 22, 22, 22, 20, 15, 15, 10)
)

# Sort by net agreement (agree + strongly_agree - disagree - strongly_disagree)
survey_sorted <- survey_raw %>%
  mutate(net_agreement = (agree + strongly_agree) - (disagree + strongly_disagree)) %>%
  arrange(net_agreement) %>%
  mutate(question = factor(question, levels = question))

# Reshape to long format for diverging bar chart
# Neutral is split in half: negative half on left, positive half on right
# Factor level order controls stacking direction: neutral nearest center, strong responses outermost
df_long <- survey_sorted %>%
  select(question, strongly_disagree, disagree, neutral, agree, strongly_agree) %>%
  mutate(
    neutral_neg       = -neutral / 2,
    neutral_pos       =  neutral / 2,
    disagree          = -disagree,
    strongly_disagree = -strongly_disagree
  ) %>%
  select(-neutral) %>%
  pivot_longer(
    cols      = -question,
    names_to  = "response",
    values_to = "pct"
  ) %>%
  mutate(
    # For horizontal diverging bars in ggplot2 position_stack:
    # negatives: lowest factor level = innermost (nearest 0)
    # positives: highest factor level = innermost (nearest 0)
    # So positive levels must be ordered: strongly_agree < agree < neutral_pos
    response = factor(response, levels = c(
      "neutral_neg", "disagree", "strongly_disagree",
      "strongly_agree", "agree", "neutral_pos"
    )),
    abs_pct    = abs(pct),
    label_text = ifelse(abs_pct >= 8, paste0(round(abs_pct), "%"), "")
  )

# Fill colors: neutral_neg and neutral_pos share the muted center color
fill_colors <- c(
  "neutral_neg"       = likert_palette[3],
  "disagree"          = likert_palette[2],
  "strongly_disagree" = likert_palette[1],
  "neutral_pos"       = likert_palette[3],
  "agree"             = likert_palette[4],
  "strongly_agree"    = likert_palette[5]
)

# Title: 66 chars (within 67-char baseline → fontsize stays at 12)
plot_title <- "Employee Benefits · bar-diverging-likert · r · ggplot2 · anyplot.ai"

# --- Plot ---
p <- ggplot(df_long, aes(x = pct, y = question, fill = response)) +
  geom_col(position = "stack", width = 0.72) +
  geom_text(
    aes(label = label_text),
    position = position_stack(vjust = 0.5),
    color    = "#FAF8F1",
    size     = 2.2,
    fontface = "bold"
  ) +
  geom_vline(xintercept = 0, color = INK_SOFT, linewidth = 0.6) +
  scale_fill_manual(
    values = fill_colors,
    breaks = c("strongly_disagree", "disagree", "neutral_neg", "agree", "strongly_agree"),
    labels = c("Strongly Disagree", "Disagree", "Neutral", "Agree", "Strongly Agree"),
    name   = NULL
  ) +
  scale_x_continuous(
    labels = function(x) paste0(abs(x), "%"),
    expand = expansion(mult = c(0.03, 0.03))
  ) +
  labs(
    title = plot_title,
    x     = "Percentage of Respondents",
    y     = NULL
  ) +
  theme_minimal(base_size = 8) +
  theme(
    plot.background    = element_rect(fill = PAGE_BG, color = PAGE_BG),
    panel.background   = element_rect(fill = PAGE_BG, color = NA),
    panel.grid.major.x = element_line(color = INK_SOFT, linewidth = 0.15),
    panel.grid.major.y = element_blank(),
    panel.grid.minor   = element_blank(),
    panel.border       = element_blank(),
    axis.title.x       = element_text(color = INK, size = 10, margin = margin(t = 6)),
    axis.title.y       = element_blank(),
    axis.text.x        = element_text(color = INK_SOFT, size = 8),
    axis.text.y        = element_text(color = INK, size = 9, hjust = 1),
    axis.line.x        = element_line(color = INK_SOFT, linewidth = 0.4),
    axis.line.y        = element_blank(),
    axis.ticks         = element_blank(),
    plot.title         = element_text(
      color  = INK,
      size   = 12,
      hjust  = 0.5,
      margin = margin(b = 12)
    ),
    legend.background  = element_rect(fill = ELEVATED_BG, color = INK_SOFT, linewidth = 0.3),
    legend.text        = element_text(color = INK_SOFT, size = 8),
    legend.title       = element_blank(),
    legend.position    = "bottom",
    legend.direction   = "horizontal",
    legend.key.size    = unit(10, "pt"),
    legend.margin      = margin(4, 4, 4, 4),
    plot.margin        = margin(15, 20, 5, 10)
  )

# --- Save ---
ggsave(
  filename = sprintf("plot-%s.png", THEME),
  plot     = p,
  device   = ragg::agg_png,
  width    = 8,
  height   = 4.5,
  units    = "in",
  dpi      = 400
)
Runnable source as JSON, for any HTTP client: https://api.anyplot.ai/specs/bar-diverging-likert/ggplot2/code. Any spec id and library id listed in llms-full.txt fit the same URL shape; every URL below is complete and callable.
{
  "spec_id": "bar-diverging-likert",
  "language": "r",
  "library": "ggplot2",
  "page": "https://anyplot.ai/bar-diverging-likert/r/ggplot2",
  "hub": "https://anyplot.ai/bar-diverging-likert",
  "code_json": "https://api.anyplot.ai/specs/bar-diverging-likert/ggplot2/code",
  "spec_json": "https://api.anyplot.ai/specs/bar-diverging-likert",
  "render_light_png": "https://storage.googleapis.com/anyplot-images/plots/bar-diverging-likert/r/ggplot2/plot-light.png",
  "render_dark_png": "https://storage.googleapis.com/anyplot-images/plots/bar-diverging-likert/r/ggplot2/plot-dark.png",
  "quality_score": 89.0,
  "license": "MIT",
  "guide": "https://anyplot.ai/llms.txt"
}
Part of Likert Scale Diverging Bar Chart on anyplot.ai.