The same plot in 14 other libraries — Python: Altair, Bokeh, lets-plot, Matplotlib, Plotly, plotnine, Pygal, Seaborn; R: ggplot2; JavaScript: Chart.js, D3.js, Apache ECharts, Highcharts, MUI X Charts. Compare all 15 side by side: Likert Scale Diverging Bar Chart in Python, R, Julia and JavaScript.
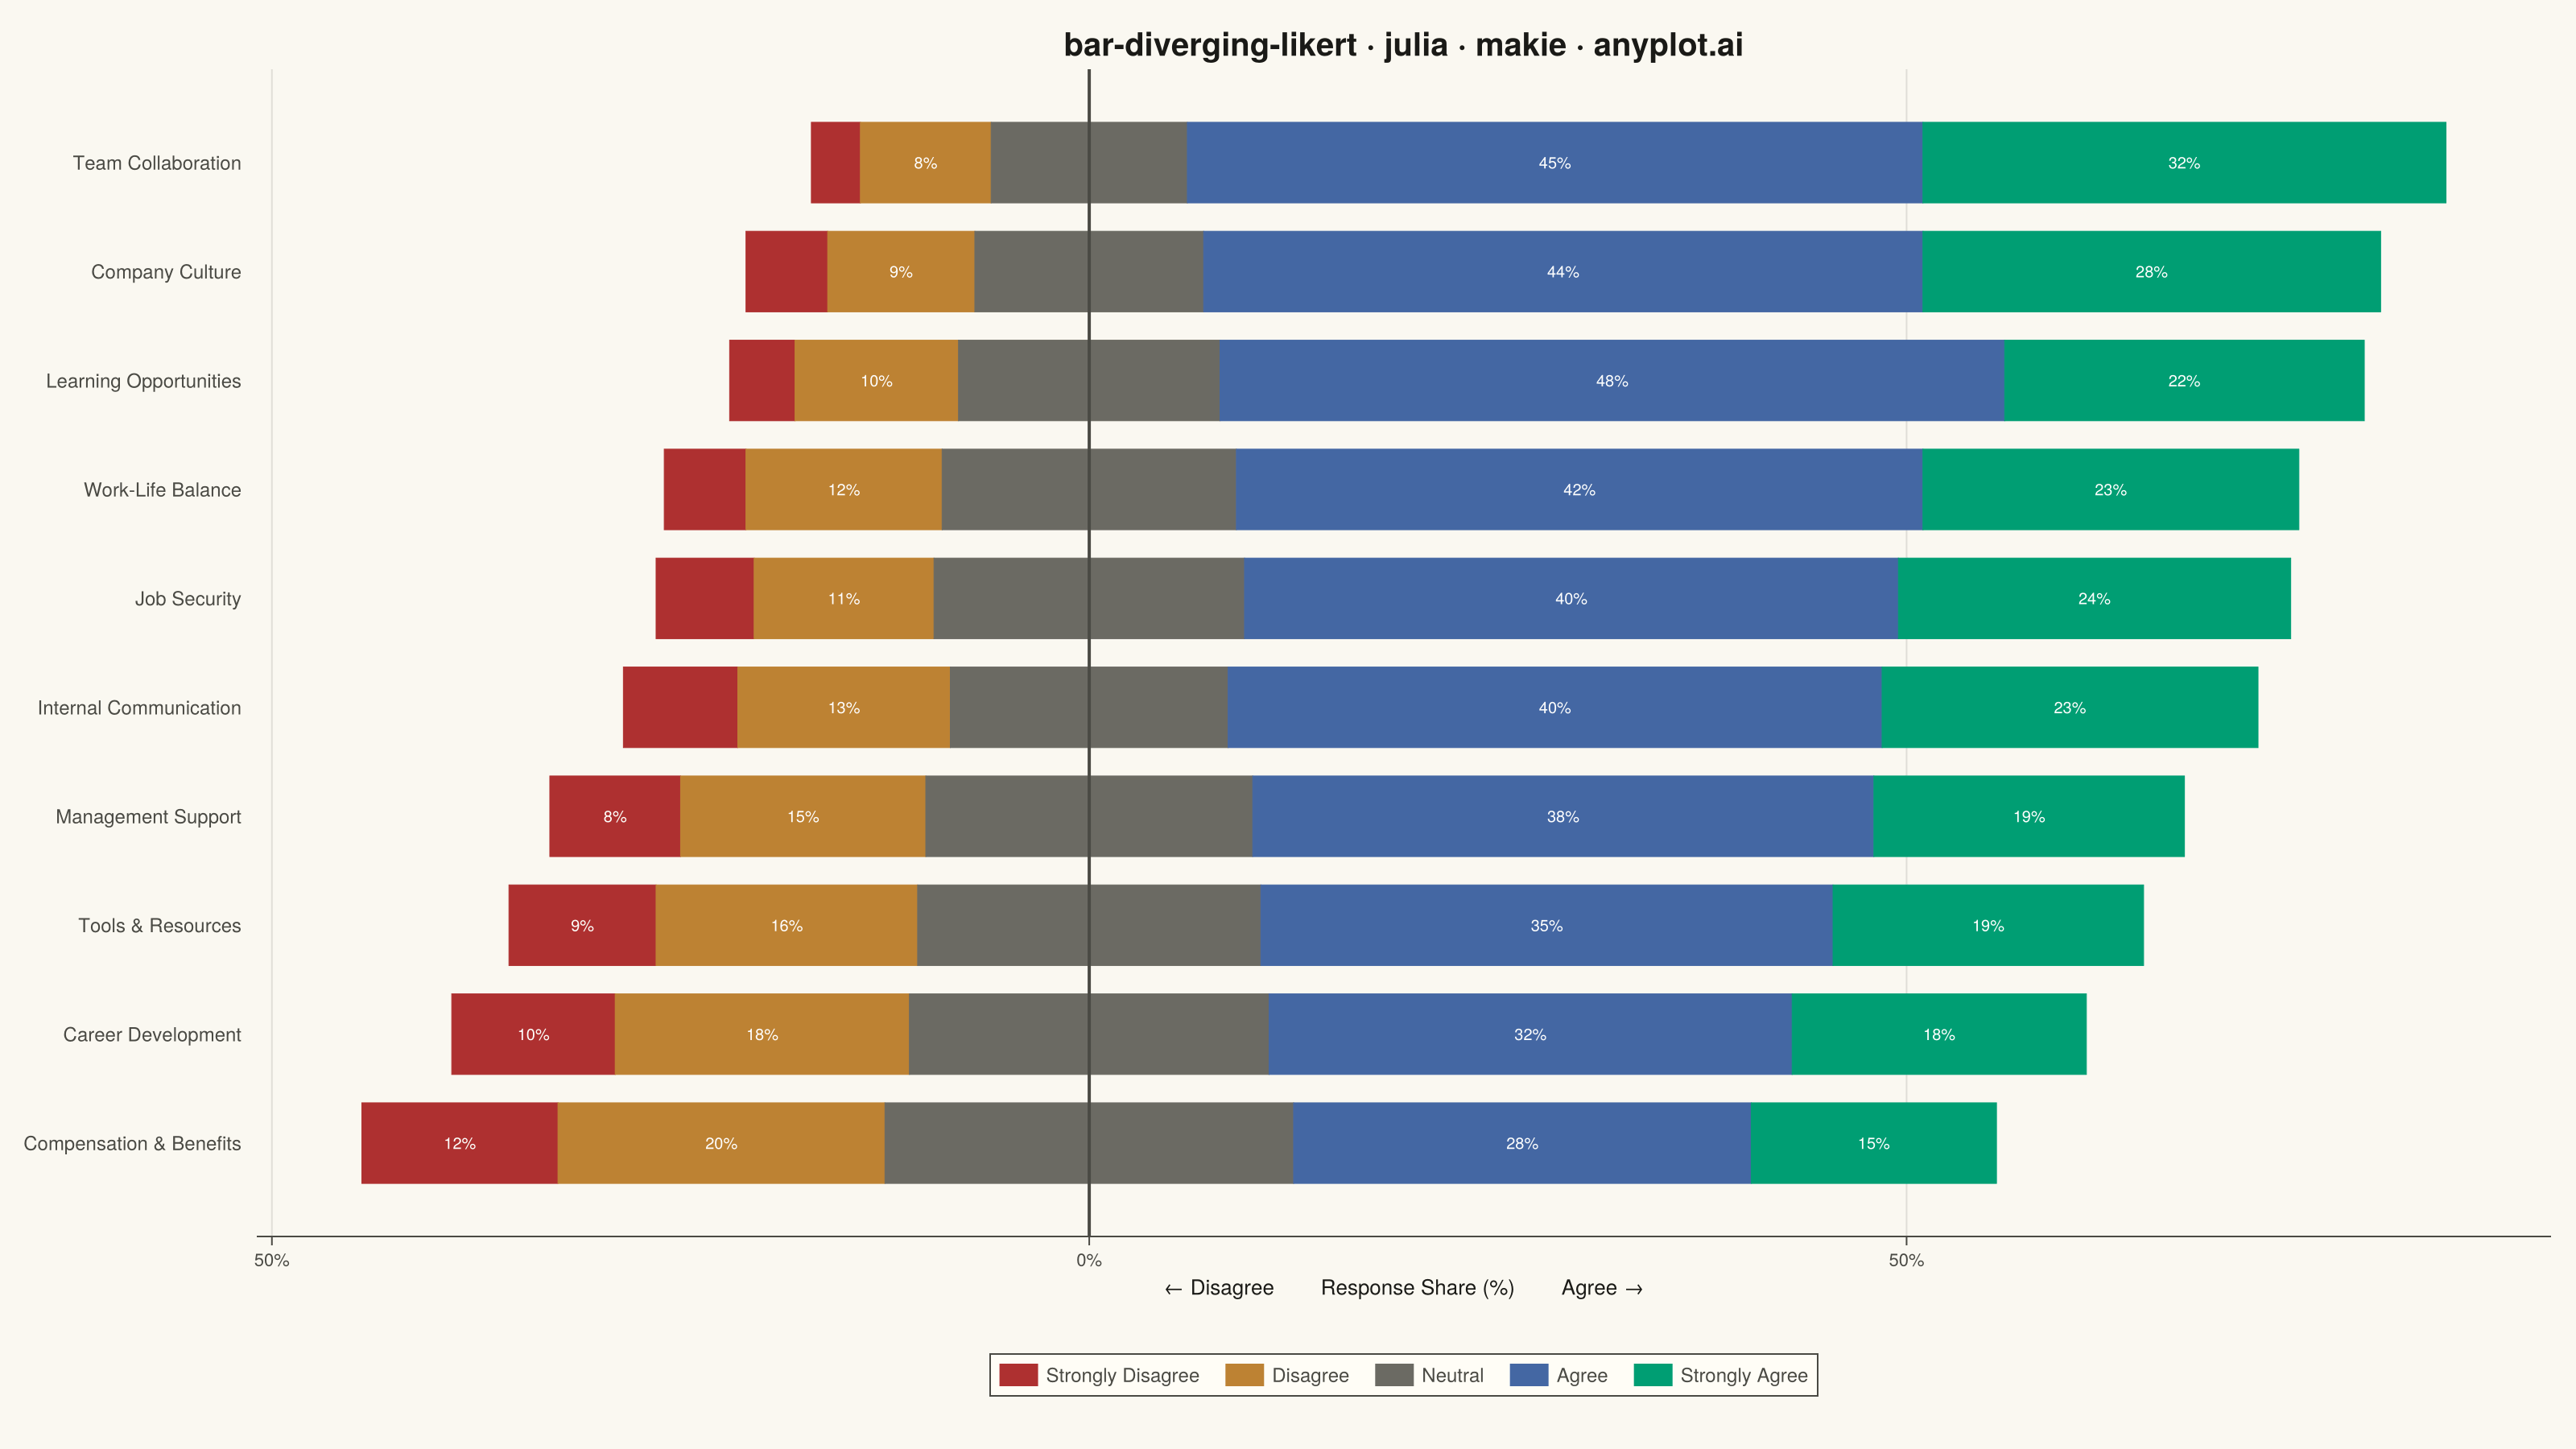
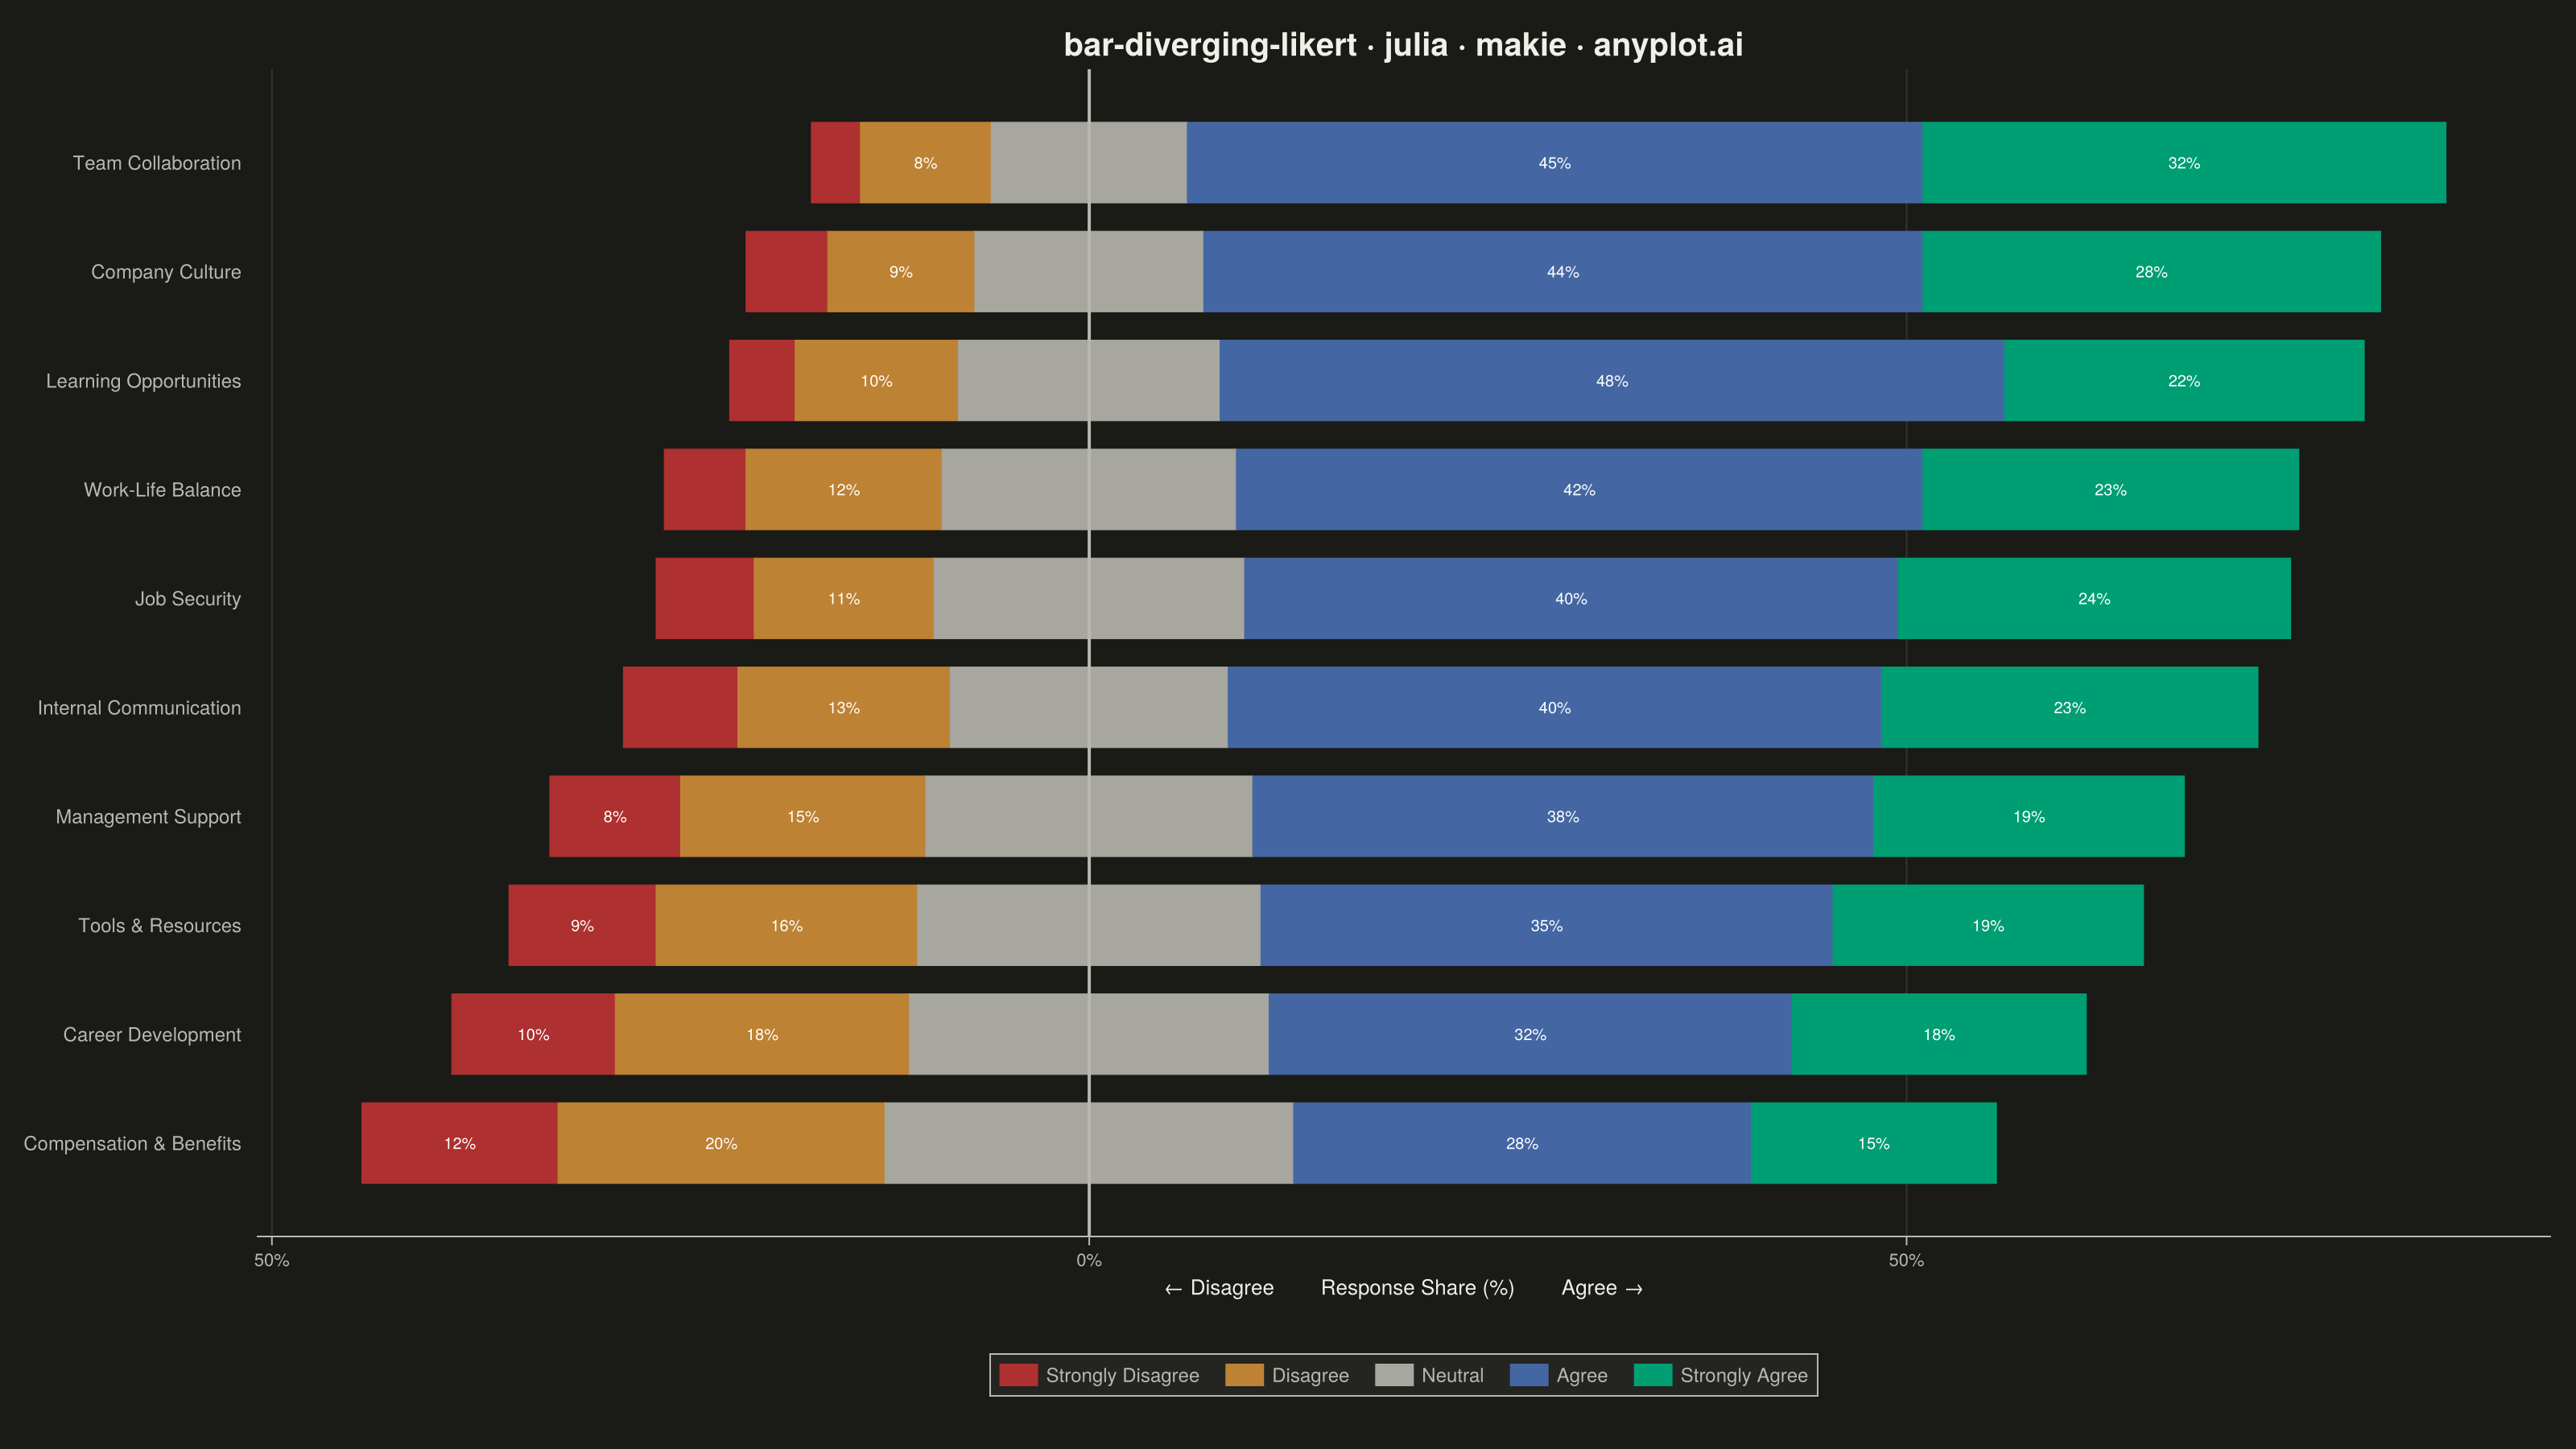
A diverging stacked bar chart designed for Likert scale survey responses (e.g., Strongly Disagree to Strongly Agree). Bars diverge from a central neutral point, with negative responses (Disagree, Strongly Disagree) extending left and positive responses (Agree, Strongly Agree) extending right. This layout makes it easy to compare overall agreement levels across multiple survey questions at a glance.
# anyplot.ai
# bar-diverging-likert: Likert Scale Diverging Bar Chart
# Library: makie 0.22.10 | Julia 1.11.9
# Quality: 88/100 | Created: 2026-06-01

using CairoMakie
using Colors
using Random

Random.seed!(42)

# Theme tokens
const THEME       = get(ENV, "ANYPLOT_THEME", "light")
const PAGE_BG     = THEME == "light" ? colorant"#FAF8F1" : colorant"#1A1A17"
const ELEVATED_BG = THEME == "light" ? colorant"#FFFDF6" : colorant"#242420"
const INK         = THEME == "light" ? colorant"#1A1A17" : colorant"#F0EFE8"
const INK_SOFT    = THEME == "light" ? colorant"#4A4A44" : colorant"#B8B7B0"
const INK_MUTED   = THEME == "light" ? colorant"#6B6A63" : colorant"#A8A79F"

# Imprint palette — semantic mapping: positive→green, negative→red
const COL_SA = colorant"#009E73"  # Strongly Agree: Imprint brand green (positive)
const COL_A  = colorant"#4467A3"  # Agree: Imprint blue
const COL_D  = colorant"#BD8233"  # Disagree: Imprint ochre
const COL_SD = colorant"#AE3030"  # Strongly Disagree: Imprint matte red (negative)

# Data — employee engagement survey (10 items, 5-point Likert scale)
const questions_raw = [
    "Work-Life Balance",
    "Team Collaboration",
    "Management Support",
    "Career Development",
    "Compensation & Benefits",
    "Learning Opportunities",
    "Job Security",
    "Company Culture",
    "Tools & Resources",
    "Internal Communication",
]

# Rows: [SD, D, N, A, SA] as percentages (each row sums to 100)
const resp_matrix = Float64[
     5  12  18  42  23;
     3   8  12  45  32;
     8  15  20  38  19;
    10  18  22  32  18;
    12  20  25  28  15;
     4  10  16  48  22;
     6  11  19  40  24;
     5   9  14  44  28;
     9  16  21  35  19;
     7  13  17  40  23;
]

n_q  = length(questions_raw)
sd_v = resp_matrix[:, 1]
d_v  = resp_matrix[:, 2]
n_v  = resp_matrix[:, 3]
a_v  = resp_matrix[:, 4]
sa_v = resp_matrix[:, 5]

# Sort ascending by net agreement (SA + A − SD − D): most negative at bottom
net_score = sa_v .+ a_v .- sd_v .- d_v
order     = sortperm(net_score)

questions = questions_raw[order]
sd = sd_v[order]; d = d_v[order]; n = n_v[order]
a  = a_v[order];  sa = sa_v[order]

y_pos  = collect(1.0:Float64(n_q))
n_half = n ./ 2.0

# Segment x-offsets for percentage label placement
sd_off = -(sd .+ d .+ n_half)
d_off  = -(d .+ n_half)
a_off  =  n_half
sa_off =  n_half .+ a

# Title with length-aware fontsize
title_str = "Employee Engagement Survey · bar-diverging-likert · julia · makie · anyplot.ai"
title_fs  = length(title_str) > 67 ? round(Int, 20 * 67 / length(title_str)) : 20

# Figure
fig = Figure(
    size            = (1600, 900),
    fontsize        = 14,
    backgroundcolor = PAGE_BG,
)

ax = Axis(
    fig[1, 1];
    title              = title_str,
    titlesize          = title_fs,
    titlecolor         = INK,
    xlabel             = "← Disagree        Response Share (%)        Agree →",
    xlabelcolor        = INK,
    xlabelsize         = 13,
    xticklabelcolor    = INK_SOFT,
    xticklabelsize     = 11,
    yticklabelcolor    = INK_SOFT,
    yticklabelsize     = 12,
    xtickcolor         = INK_SOFT,
    ytickcolor         = :transparent,
    backgroundcolor    = PAGE_BG,
    topspinevisible    = false,
    rightspinevisible  = false,
    leftspinevisible   = false,
    bottomspinecolor   = INK_SOFT,
    xgridvisible       = true,
    ygridvisible       = false,
    xgridcolor         = RGBAf(INK.r, INK.g, INK.b, 0.12f0),
    yticks             = (y_pos, questions),
)

ax.xtickformat = vs -> ["$(abs(round(Int, v)))%" for v in vs]

# Stacked horizontal bars using barplot! with direction=:x — idiomatic Makie approach.
# Left side: N/2 (innermost, stack=1), D (stack=2), SD (stack=3) — negative widths stack leftward.
barplot!(ax,
    vcat(y_pos, y_pos, y_pos),
    vcat(-n_half, -d, -sd);
    direction   = :x,
    stack       = vcat(fill(1, n_q), fill(2, n_q), fill(3, n_q)),
    color       = vcat(fill(INK_MUTED, n_q), fill(COL_D, n_q), fill(COL_SD, n_q)),
    gap         = 0.26,
    strokewidth = 0,
)

# Right side: N/2 (innermost, stack=1), A (stack=2), SA (stack=3) — positive widths stack rightward.
barplot!(ax,
    vcat(y_pos, y_pos, y_pos),
    vcat(n_half, a, sa);
    direction   = :x,
    stack       = vcat(fill(1, n_q), fill(2, n_q), fill(3, n_q)),
    color       = vcat(fill(INK_MUTED, n_q), fill(COL_A, n_q), fill(COL_SA, n_q)),
    gap         = 0.26,
    strokewidth = 0,
)

# Center reference line
vlines!(ax, [0.0]; color = INK_SOFT, linewidth = 2.0, linestyle = :solid)

# Percentage labels inside segments ≥ 8%
label_fs = 10

for i in 1:n_q
    yi = y_pos[i]
    for (x0, w) in [
        (sd_off[i], sd[i]),
        (d_off[i],  d[i]),
        (a_off[i],  a[i]),
        (sa_off[i], sa[i]),
    ]
        if w >= 8.0
            text!(ax, x0 + w / 2, yi;
                  text     = "$(round(Int, w))%",
                  align    = (:center, :center),
                  color    = colorant"#FFFFFF",
                  fontsize = label_fs)
        end
    end
end

# x-axis padding to avoid tight right/left margins
max_right = maximum(n_half .+ a .+ sa)
max_left  = maximum(sd .+ d .+ n_half)
xlims!(ax, -(max_left + 8), max_right + 8)

# Legend (horizontal, frameless)
Legend(
    fig[2, 1],
    [
        PolyElement(color = COL_SD,    strokecolor = :transparent),
        PolyElement(color = COL_D,     strokecolor = :transparent),
        PolyElement(color = INK_MUTED, strokecolor = :transparent),
        PolyElement(color = COL_A,     strokecolor = :transparent),
        PolyElement(color = COL_SA,    strokecolor = :transparent),
    ],
    ["Strongly Disagree", "Disagree", "Neutral", "Agree", "Strongly Agree"];
    orientation     = :horizontal,
    framevisible    = false,
    backgroundcolor = ELEVATED_BG,
    labelcolor      = INK_SOFT,
    labelsize       = 12,
    patchsize       = (24, 14),
    tellwidth       = false,
    tellheight      = true,
)

rowsize!(fig.layout, 2, Fixed(60))

save("plot-$(THEME).png", fig; px_per_unit = 2)
Runnable source as JSON, for any HTTP client: https://api.anyplot.ai/specs/bar-diverging-likert/makie/code. Any spec id and library id listed in llms-full.txt fit the same URL shape; every URL below is complete and callable.
{
  "spec_id": "bar-diverging-likert",
  "language": "julia",
  "library": "makie",
  "page": "https://anyplot.ai/bar-diverging-likert/julia/makie",
  "hub": "https://anyplot.ai/bar-diverging-likert",
  "code_json": "https://api.anyplot.ai/specs/bar-diverging-likert/makie/code",
  "spec_json": "https://api.anyplot.ai/specs/bar-diverging-likert",
  "render_light_png": "https://storage.googleapis.com/anyplot-images/plots/bar-diverging-likert/julia/makie/plot-light.png",
  "render_dark_png": "https://storage.googleapis.com/anyplot-images/plots/bar-diverging-likert/julia/makie/plot-dark.png",
  "quality_score": 88.0,
  "license": "MIT",
  "guide": "https://anyplot.ai/llms.txt"
}
Part of Likert Scale Diverging Bar Chart on anyplot.ai.