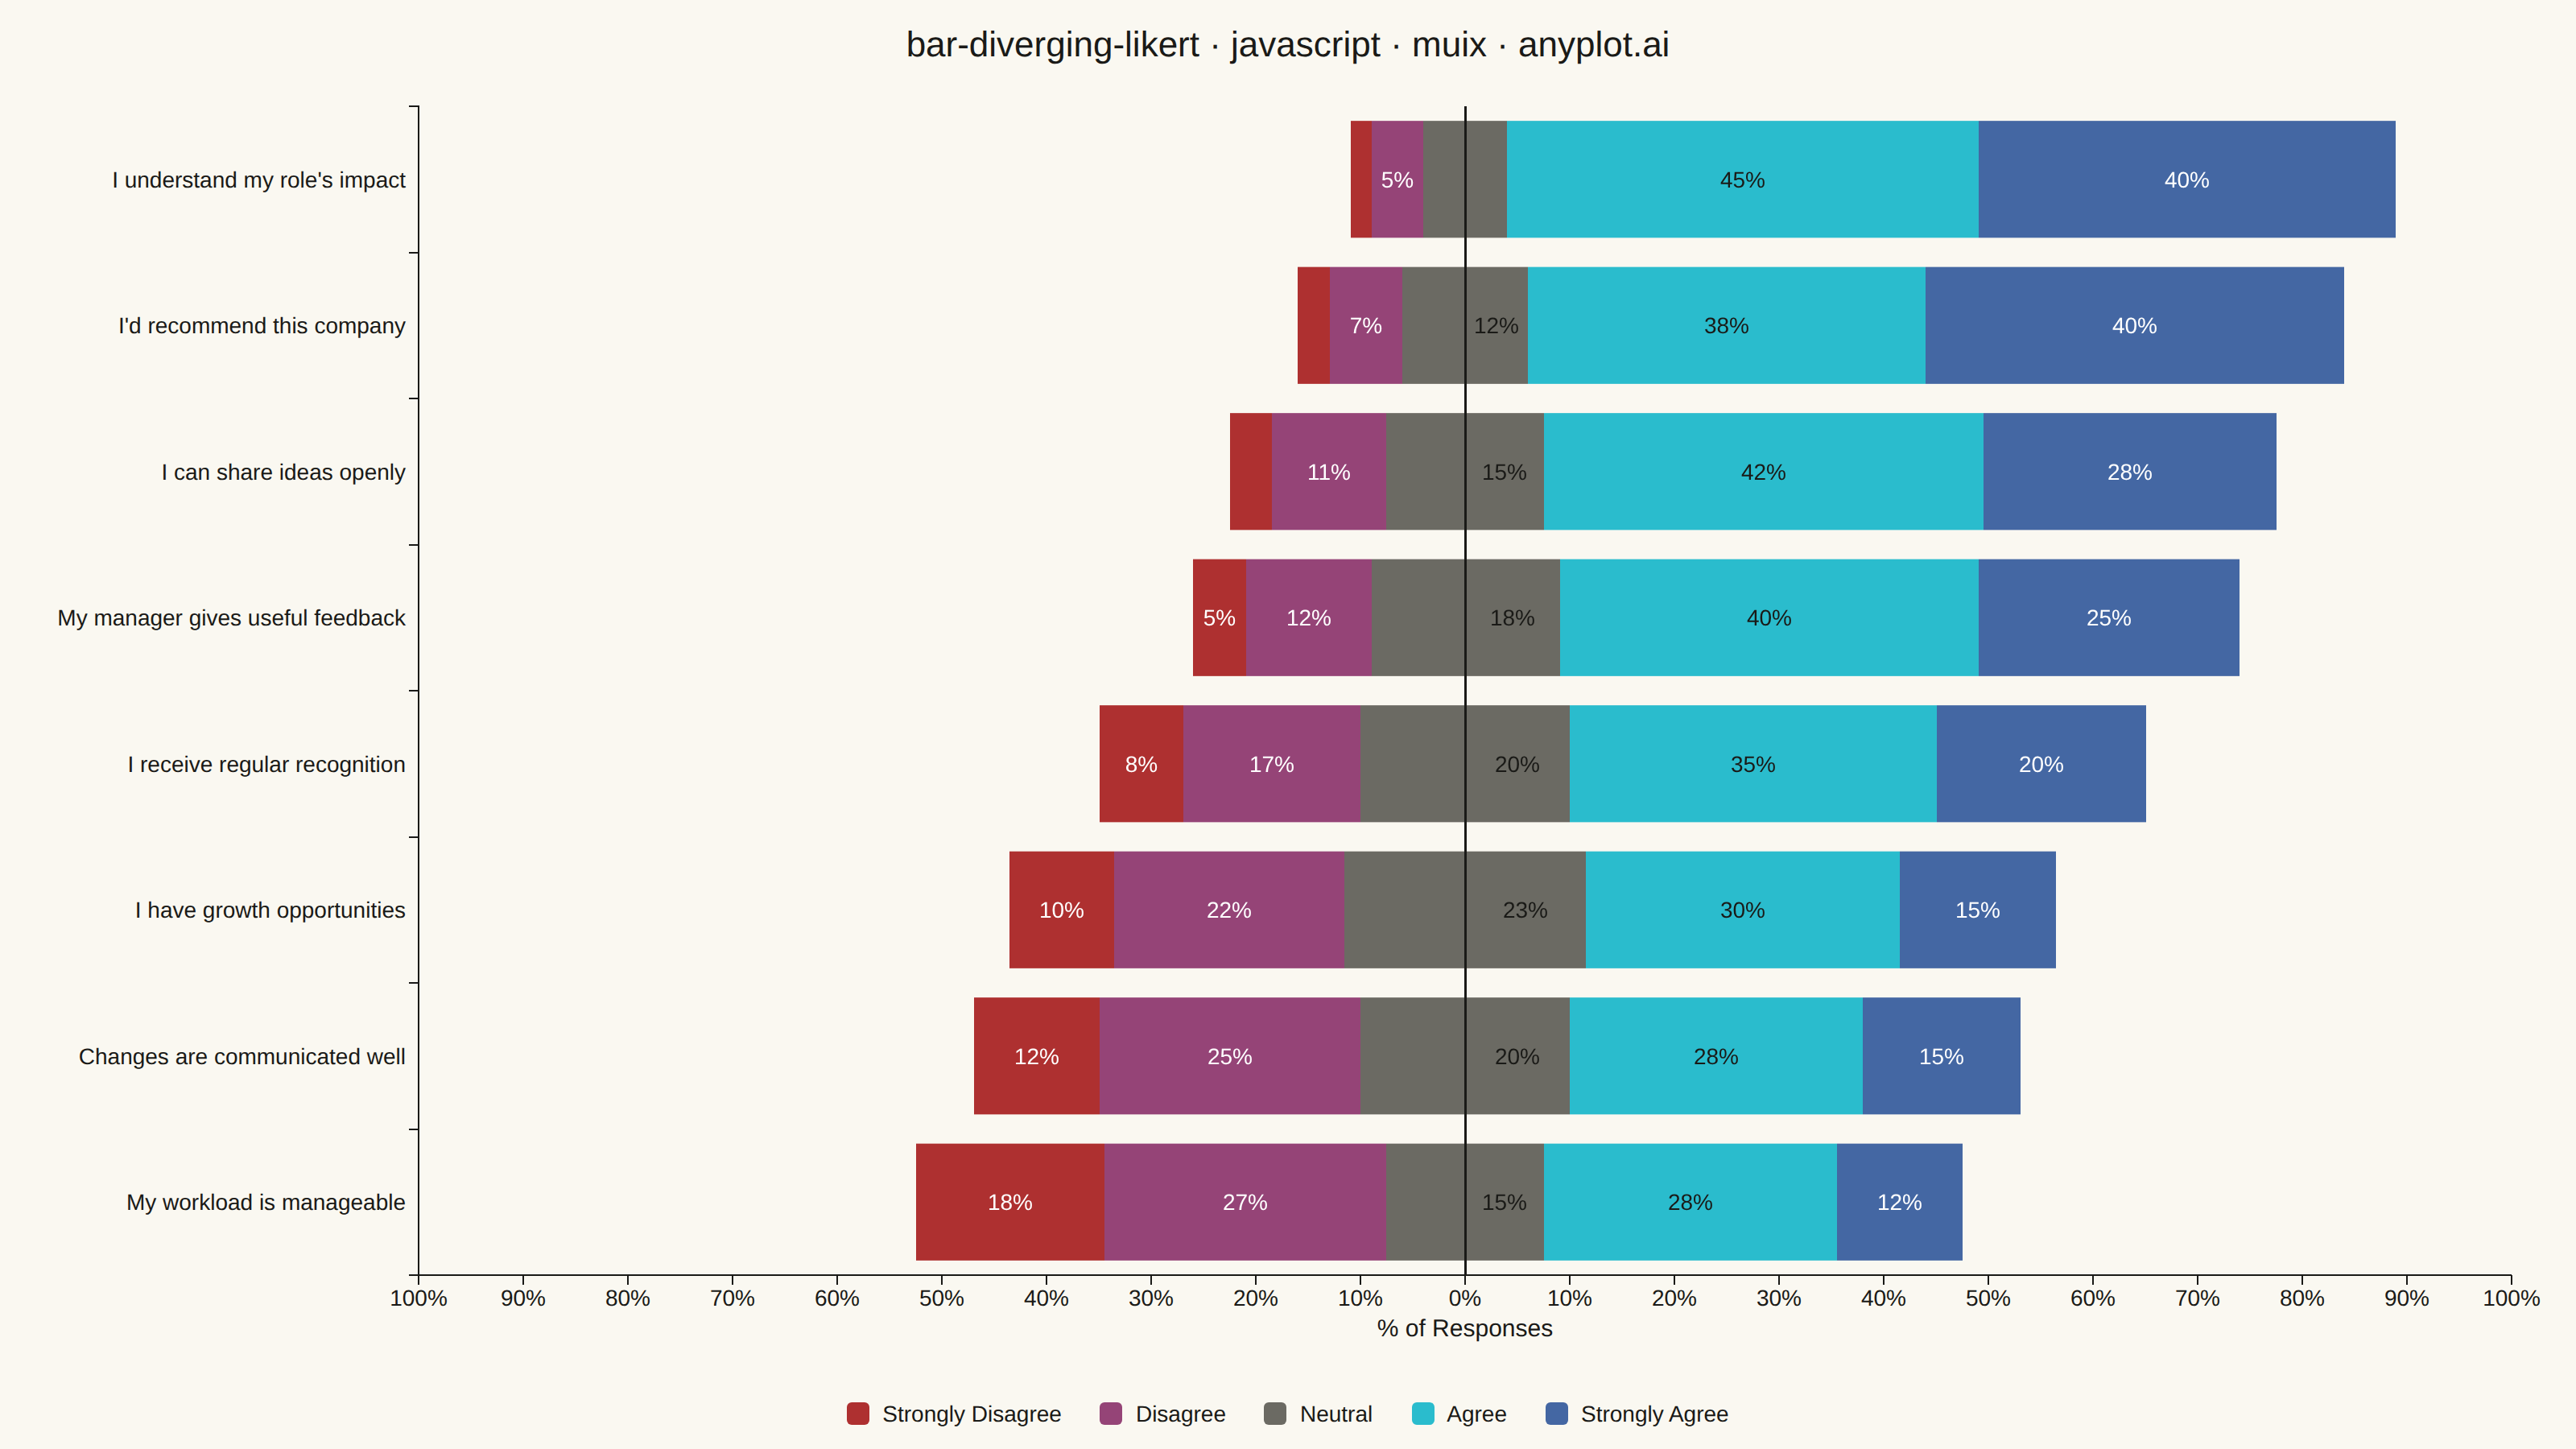
The same plot in 14 other libraries — JavaScript: Chart.js, D3.js, Apache ECharts, Highcharts; Python: Altair, Bokeh, lets-plot, Matplotlib, Plotly, plotnine, Pygal, Seaborn; R: ggplot2; Julia: Makie.jl. Compare all 15 side by side: Likert Scale Diverging Bar Chart in Python, R, Julia and JavaScript.
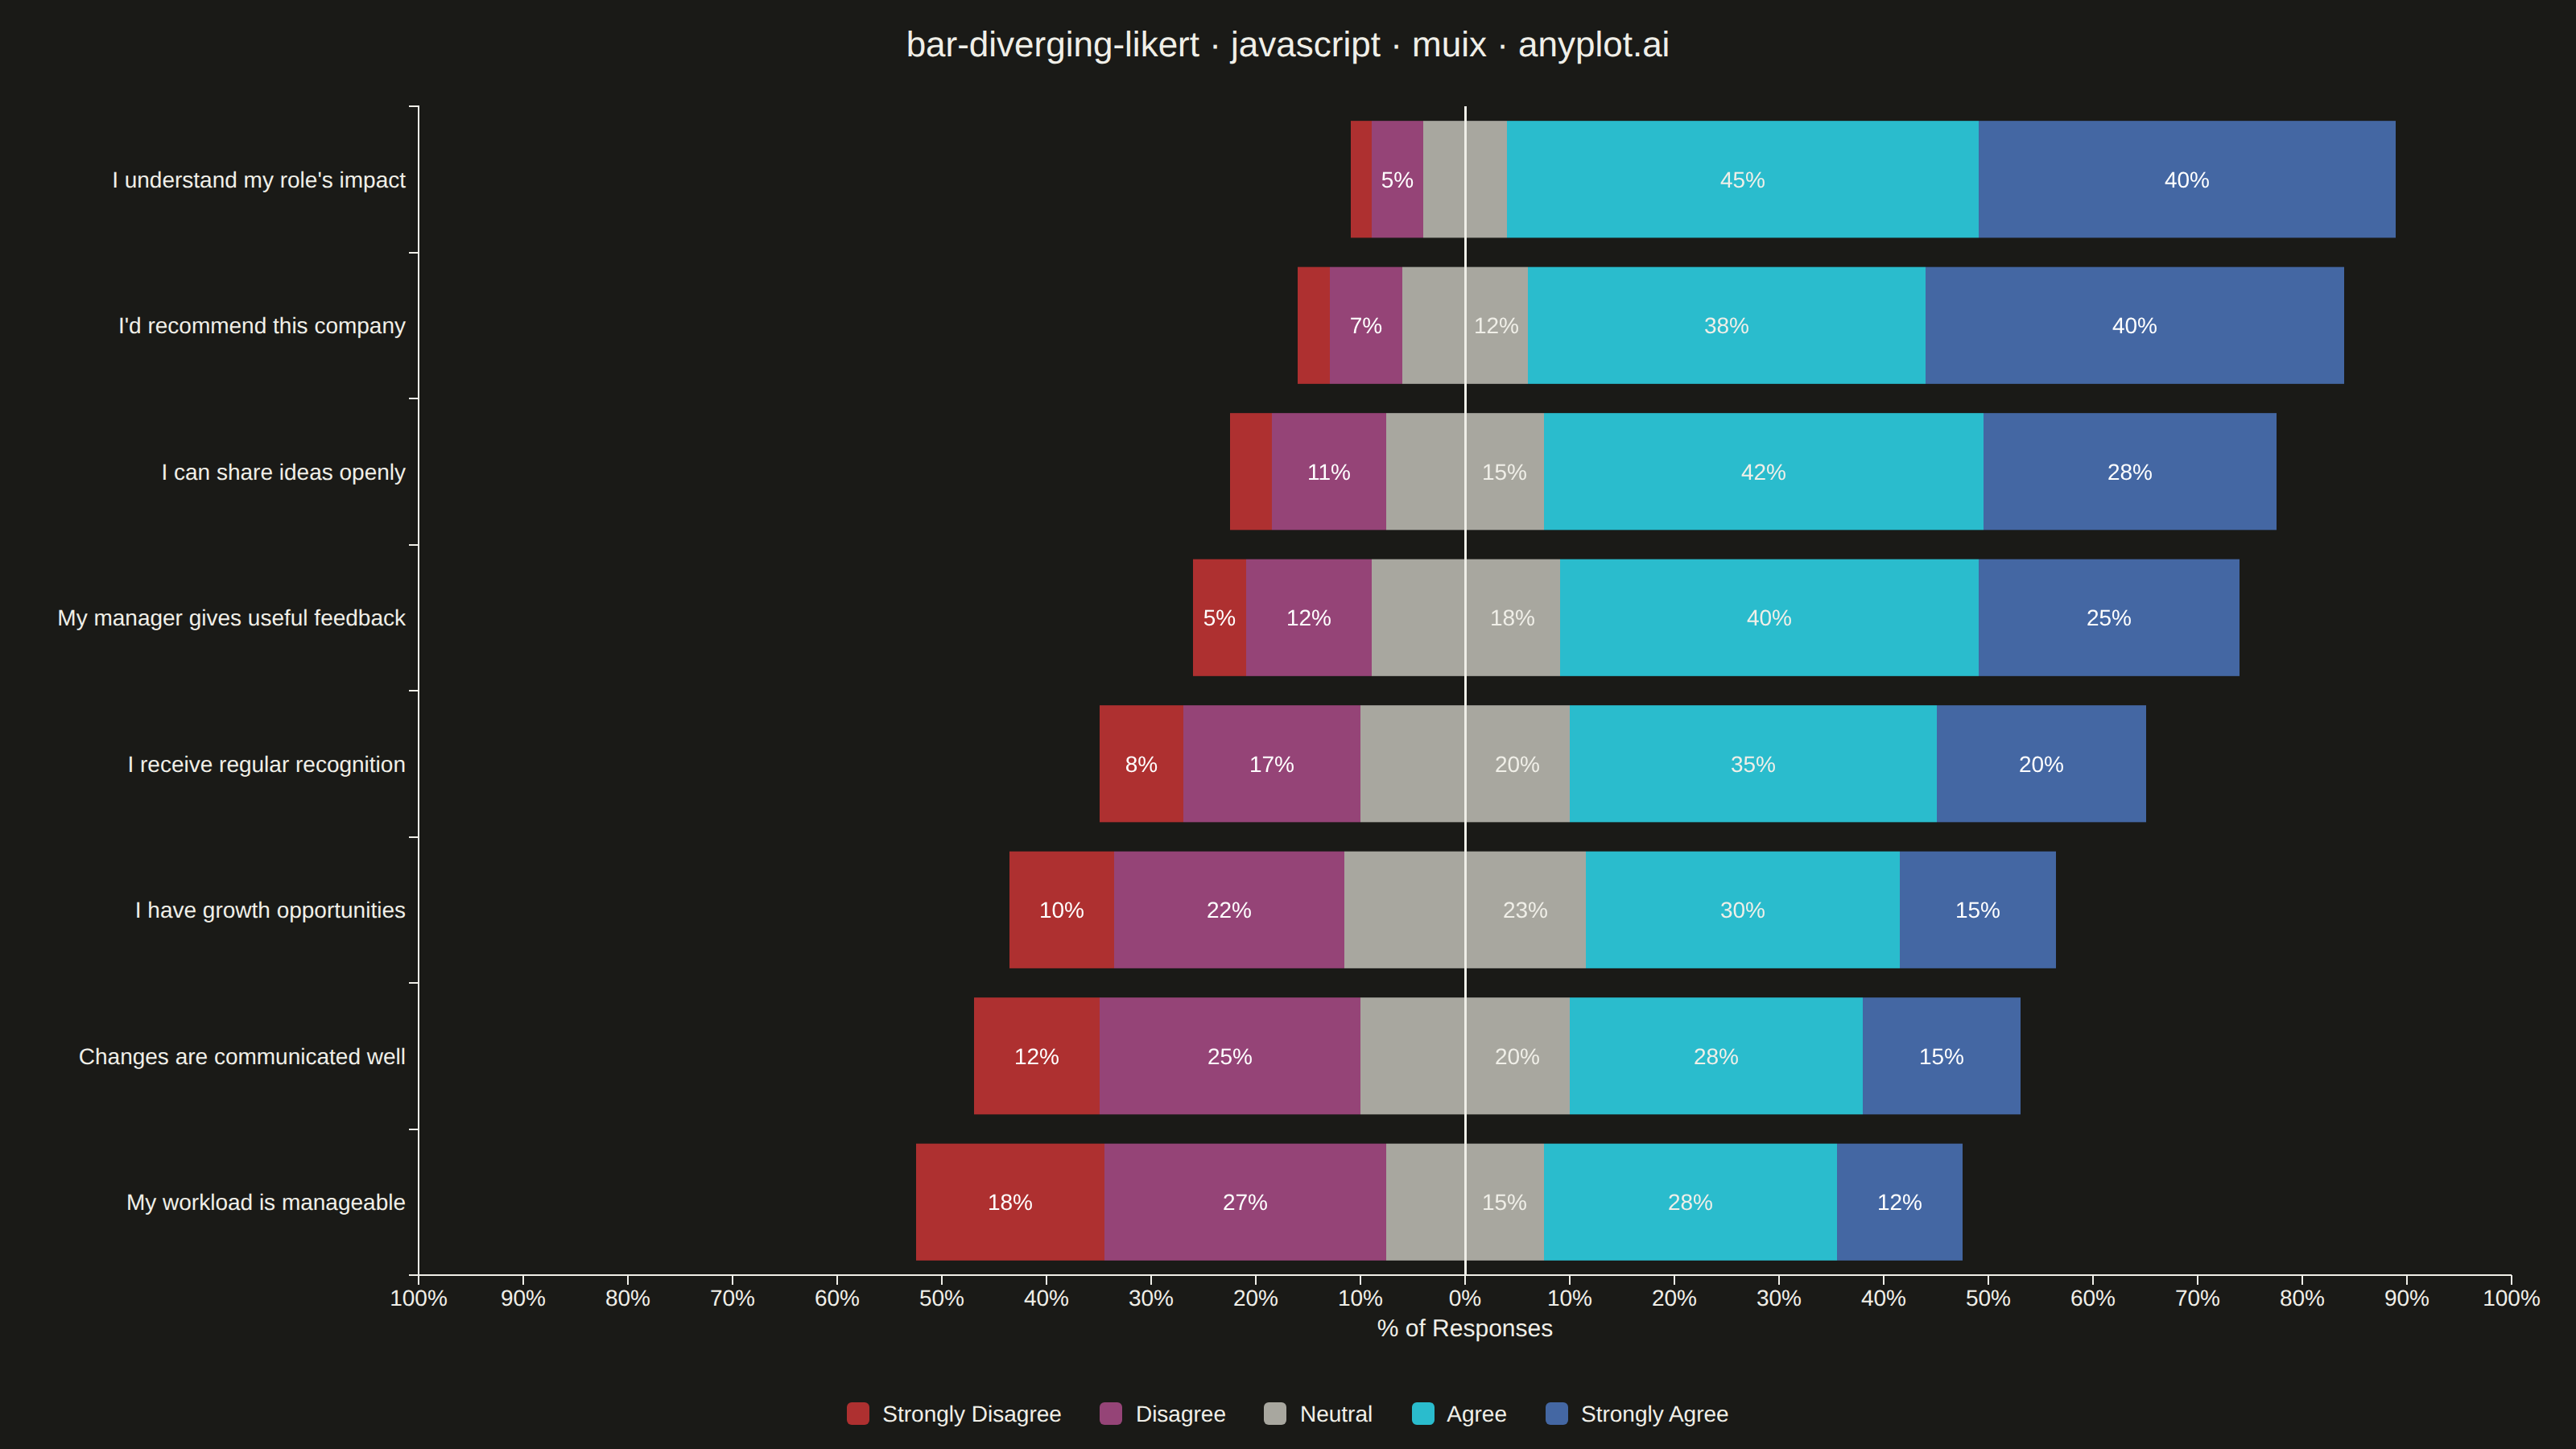
A diverging stacked bar chart designed for Likert scale survey responses (e.g., Strongly Disagree to Strongly Agree). Bars diverge from a central neutral point, with negative responses (Disagree, Strongly Disagree) extending left and positive responses (Agree, Strongly Agree) extending right. This layout makes it easy to compare overall agreement levels across multiple survey questions at a glance.
// anyplot.ai
// bar-diverging-likert: Likert Scale Diverging Bar Chart
// Library: muix 7.29.1 | JavaScript 22.23.2
// Quality: 88/100 | Created: 2026-08-24
import { BarChart } from "@mui/x-charts/BarChart";
import { ChartsReferenceLine } from "@mui/x-charts/ChartsReferenceLine";
import Typography from "@mui/material/Typography";

const t = window.ANYPLOT_TOKENS;
const THEME = window.ANYPLOT_THEME === "dark" ? "dark" : "light";
// `muted` isn't part of window.ANYPLOT_TOKENS — derive it per
// default-style-guide.md "Theme-adaptive Chrome" (the semantic-anchor role
// fits the Likert "Neutral" bucket: soft-contrast, sits behind the data).
const MUTED = THEME === "dark" ? "#A8A79F" : "#6B6A63";

// --- Data (in-memory, deterministic) — employee engagement survey, 5-point Likert ---
const RESPONSES = [
  {
    question: "I understand my role's impact",
    strongly_disagree: 2,
    disagree: 5,
    neutral: 8,
    agree: 45,
    strongly_agree: 40,
  },
  {
    question: "I receive regular recognition",
    strongly_disagree: 8,
    disagree: 17,
    neutral: 20,
    agree: 35,
    strongly_agree: 20,
  },
  {
    question: "I have growth opportunities",
    strongly_disagree: 10,
    disagree: 22,
    neutral: 23,
    agree: 30,
    strongly_agree: 15,
  },
  {
    question: "My manager gives useful feedback",
    strongly_disagree: 5,
    disagree: 12,
    neutral: 18,
    agree: 40,
    strongly_agree: 25,
  },
  {
    question: "I can share ideas openly",
    strongly_disagree: 4,
    disagree: 11,
    neutral: 15,
    agree: 42,
    strongly_agree: 28,
  },
  {
    question: "Changes are communicated well",
    strongly_disagree: 12,
    disagree: 25,
    neutral: 20,
    agree: 28,
    strongly_agree: 15,
  },
  {
    question: "My workload is manageable",
    strongly_disagree: 18,
    disagree: 27,
    neutral: 15,
    agree: 28,
    strongly_agree: 12,
  },
  {
    question: "I'd recommend this company",
    strongly_disagree: 3,
    disagree: 7,
    neutral: 12,
    agree: 38,
    strongly_agree: 40,
  },
];

// Sort by net agreement (agree + strongly_agree − disagree − strongly_disagree),
// descending so the strongest agreement lands at the top of the band axis.
const SORTED = [...RESPONSES].sort((a, b) => {
  const netA = a.agree + a.strongly_agree - a.disagree - a.strongly_disagree;
  const netB = b.agree + b.strongly_agree - b.disagree - b.strongly_disagree;
  return netB - netA;
});

const questions = SORTED.map((d) => d.question);

// Diverging construction: split "neutral" evenly across the zero midpoint so
// bars extend left (disagreement) and right (agreement) from a shared centerline.
// Series listed closest-to-zero first within each sign — @mui/x-charts stacks
// negative and positive values independently (d3's stackOffsetDiverging), with
// the earliest series in a sign group nearest the baseline.
const negNeutral = SORTED.map((d) => -d.neutral / 2);
const negDisagree = SORTED.map((d) => -d.disagree);
const negStronglyDisagree = SORTED.map((d) => -d.strongly_disagree);
const posNeutral = SORTED.map((d) => d.neutral / 2);
const posAgree = SORTED.map((d) => d.agree);
const posStronglyAgree = SORTED.map((d) => d.strongly_agree);

// Symmetric axis extent so both diverging halves read against the same scale.
const maxExtent = Math.max(
  ...SORTED.map((d) => d.strongly_disagree + d.disagree + d.neutral / 2),
  ...SORTED.map((d) => d.agree + d.strongly_agree + d.neutral / 2),
);
const axisBound = Math.ceil((maxExtent * 1.08) / 5) * 5;

// Diverging red <-> muted <-> blue mirrors imprint_div's own red <-> neutral <-> blue
// construction (default-style-guide.md "Semantic exception" / "Continuous Data") —
// the Likert scale is ordinal data with a meaningful midpoint, same as the spec's
// own suggested "red-to-blue" scheme.
const COLOR_STRONGLY_DISAGREE = t.palette[4]; // "#AE3030" matte red
const COLOR_DISAGREE = t.palette[6]; // "#954477" rose
const COLOR_NEUTRAL = MUTED;
const COLOR_AGREE = t.palette[5]; // "#2ABCCD" cyan
const COLOR_STRONGLY_AGREE = t.palette[2]; // "#4467A3" blue

// Neutral is split into two invisible halves for the diverging layout — label
// the true (unsplit) share once, on the right half, rather than showing the
// halved value twice.
const MIN_LABEL_WIDTH = 30;
const barLabel = (item, context) => {
  if (item.value === null || context.bar.width < MIN_LABEL_WIDTH) return null;
  if (item.seriesId === "neutral_left") return null;
  if (item.seriesId === "neutral_right")
    return `${SORTED[item.dataIndex].neutral}%`;
  return `${Math.abs(item.value)}%`;
};

const title = "bar-diverging-likert · javascript · muix · anyplot.ai";
const titleFontSize = Math.round(
  22 * (title.length > 67 ? 67 / title.length : 1),
);

const LEGEND_ITEMS = [
  { label: "Strongly Disagree", color: COLOR_STRONGLY_DISAGREE },
  { label: "Disagree", color: COLOR_DISAGREE },
  { label: "Neutral", color: COLOR_NEUTRAL },
  { label: "Agree", color: COLOR_AGREE },
  { label: "Strongly Agree", color: COLOR_STRONGLY_AGREE },
];

export default function Chart() {
  const width = window.ANYPLOT_SIZE.width;
  const titleHeight = 56;
  const legendHeight = 44;
  const chartHeight = window.ANYPLOT_SIZE.height - titleHeight - legendHeight;

  return (
    <div
      style={{
        width,
        height: window.ANYPLOT_SIZE.height,
        display: "flex",
        flexDirection: "column",
      }}
    >
      <Typography
        align="center"
        style={{
          fontSize: titleFontSize,
          fontWeight: 500,
          height: titleHeight,
          lineHeight: `${titleHeight}px`,
        }}
      >
        {title}
      </Typography>
      <BarChart
        width={width}
        height={chartHeight}
        layout="horizontal"
        skipAnimation
        series={[
          {
            id: "neutral_left",
            data: negNeutral,
            stack: "likert",
            color: COLOR_NEUTRAL,
          },
          {
            id: "disagree",
            data: negDisagree,
            label: "Disagree",
            stack: "likert",
            color: COLOR_DISAGREE,
          },
          {
            id: "strongly_disagree",
            data: negStronglyDisagree,
            label: "Strongly Disagree",
            stack: "likert",
            color: COLOR_STRONGLY_DISAGREE,
          },
          {
            id: "neutral_right",
            data: posNeutral,
            label: "Neutral",
            stack: "likert",
            color: COLOR_NEUTRAL,
          },
          {
            id: "agree",
            data: posAgree,
            label: "Agree",
            stack: "likert",
            color: COLOR_AGREE,
          },
          {
            id: "strongly_agree",
            data: posStronglyAgree,
            label: "Strongly Agree",
            stack: "likert",
            color: COLOR_STRONGLY_AGREE,
          },
        ]}
        barLabel={barLabel}
        xAxis={[
          {
            min: -axisBound,
            max: axisBound,
            valueFormatter: (value) => `${Math.abs(value)}%`,
            tickLabelStyle: { fontSize: 14 },
            label: "% of Responses",
            labelStyle: { fontSize: 15 },
          },
        ]}
        yAxis={[
          {
            scaleType: "band",
            data: questions,
            tickLabelStyle: { fontSize: 14 },
          },
        ]}
        margin={{ left: 260, right: 40, top: 10, bottom: 64 }}
        slots={{ legend: () => null }}
        sx={{
          // Dark diverging segments (red/rose/blue) need light label text to clear
          // WCAG AA contrast; the lighter segments (muted neutral, cyan agree) keep
          // the theme-default ink fill from BarLabel's styled `text.primary`.
          [["strongly_disagree", "disagree", "strongly_agree"]
            .map((id) => `& .MuiBarLabel-series-${id}`)
            .join(", ")]: {
            fill: "#FFFFFF",
          },
        }}
      >
        <ChartsReferenceLine
          x={0}
          lineStyle={{ stroke: t.ink, strokeWidth: 1.5 }}
        />
      </BarChart>
      <div
        style={{
          height: legendHeight,
          display: "flex",
          alignItems: "center",
          justifyContent: "center",
          gap: 24,
        }}
      >
        {LEGEND_ITEMS.map((item) => (
          <div
            key={item.label}
            style={{ display: "flex", alignItems: "center", gap: 8 }}
          >
            <span
              style={{
                width: 14,
                height: 14,
                borderRadius: 3,
                background: item.color,
              }}
            />
            <Typography style={{ fontSize: 14 }}>{item.label}</Typography>
          </div>
        ))}
      </div>
    </div>
  );
}
Runnable source as JSON, for any HTTP client: https://api.anyplot.ai/specs/bar-diverging-likert/muix/code. Any spec id and library id listed in llms-full.txt fit the same URL shape; every URL below is complete and callable.
{
  "spec_id": "bar-diverging-likert",
  "language": "javascript",
  "library": "muix",
  "page": "https://anyplot.ai/bar-diverging-likert/javascript/muix",
  "hub": "https://anyplot.ai/bar-diverging-likert",
  "code_json": "https://api.anyplot.ai/specs/bar-diverging-likert/muix/code",
  "spec_json": "https://api.anyplot.ai/specs/bar-diverging-likert",
  "render_light_png": "https://storage.googleapis.com/anyplot-images/plots/bar-diverging-likert/javascript/muix/plot-light.png",
  "render_dark_png": "https://storage.googleapis.com/anyplot-images/plots/bar-diverging-likert/javascript/muix/plot-dark.png",
  "interactive_light_html": "https://storage.googleapis.com/anyplot-images/plots/bar-diverging-likert/javascript/muix/plot-light.html",
  "interactive_dark_html": "https://storage.googleapis.com/anyplot-images/plots/bar-diverging-likert/javascript/muix/plot-dark.html",
  "quality_score": 88.0,
  "license": "MIT",
  "guide": "https://anyplot.ai/llms.txt"
}
Part of Likert Scale Diverging Bar Chart on anyplot.ai.