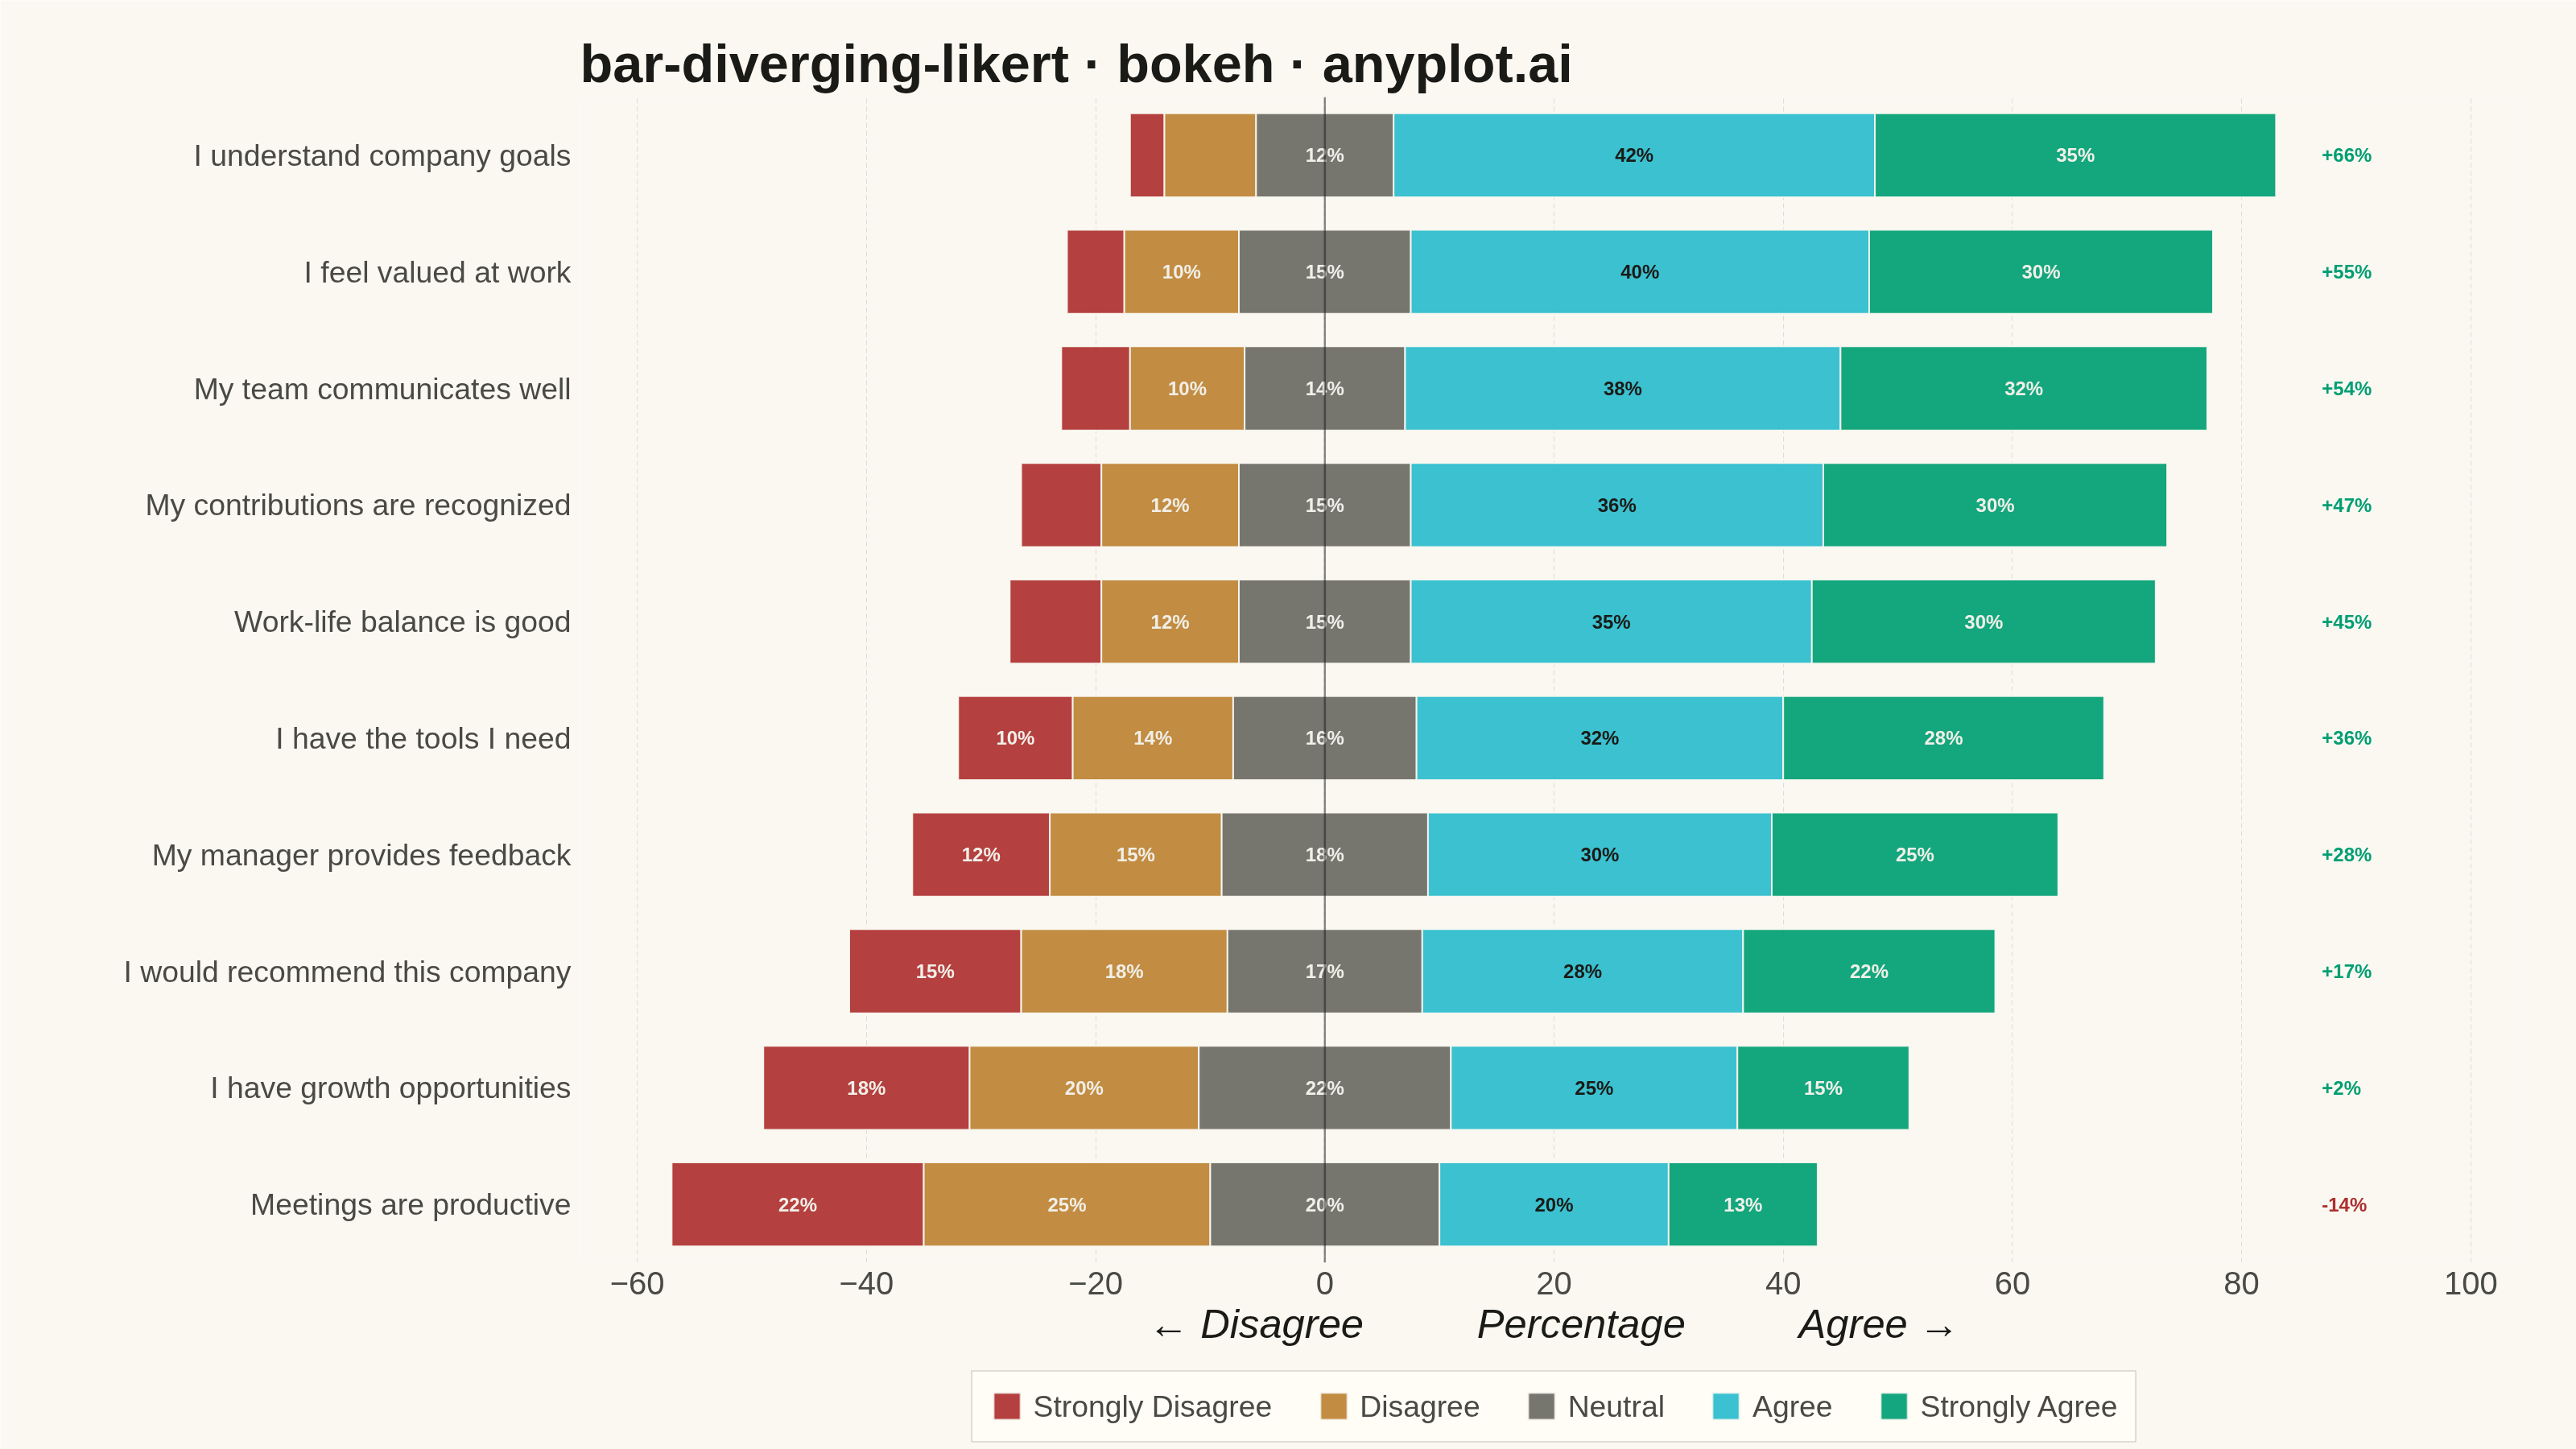
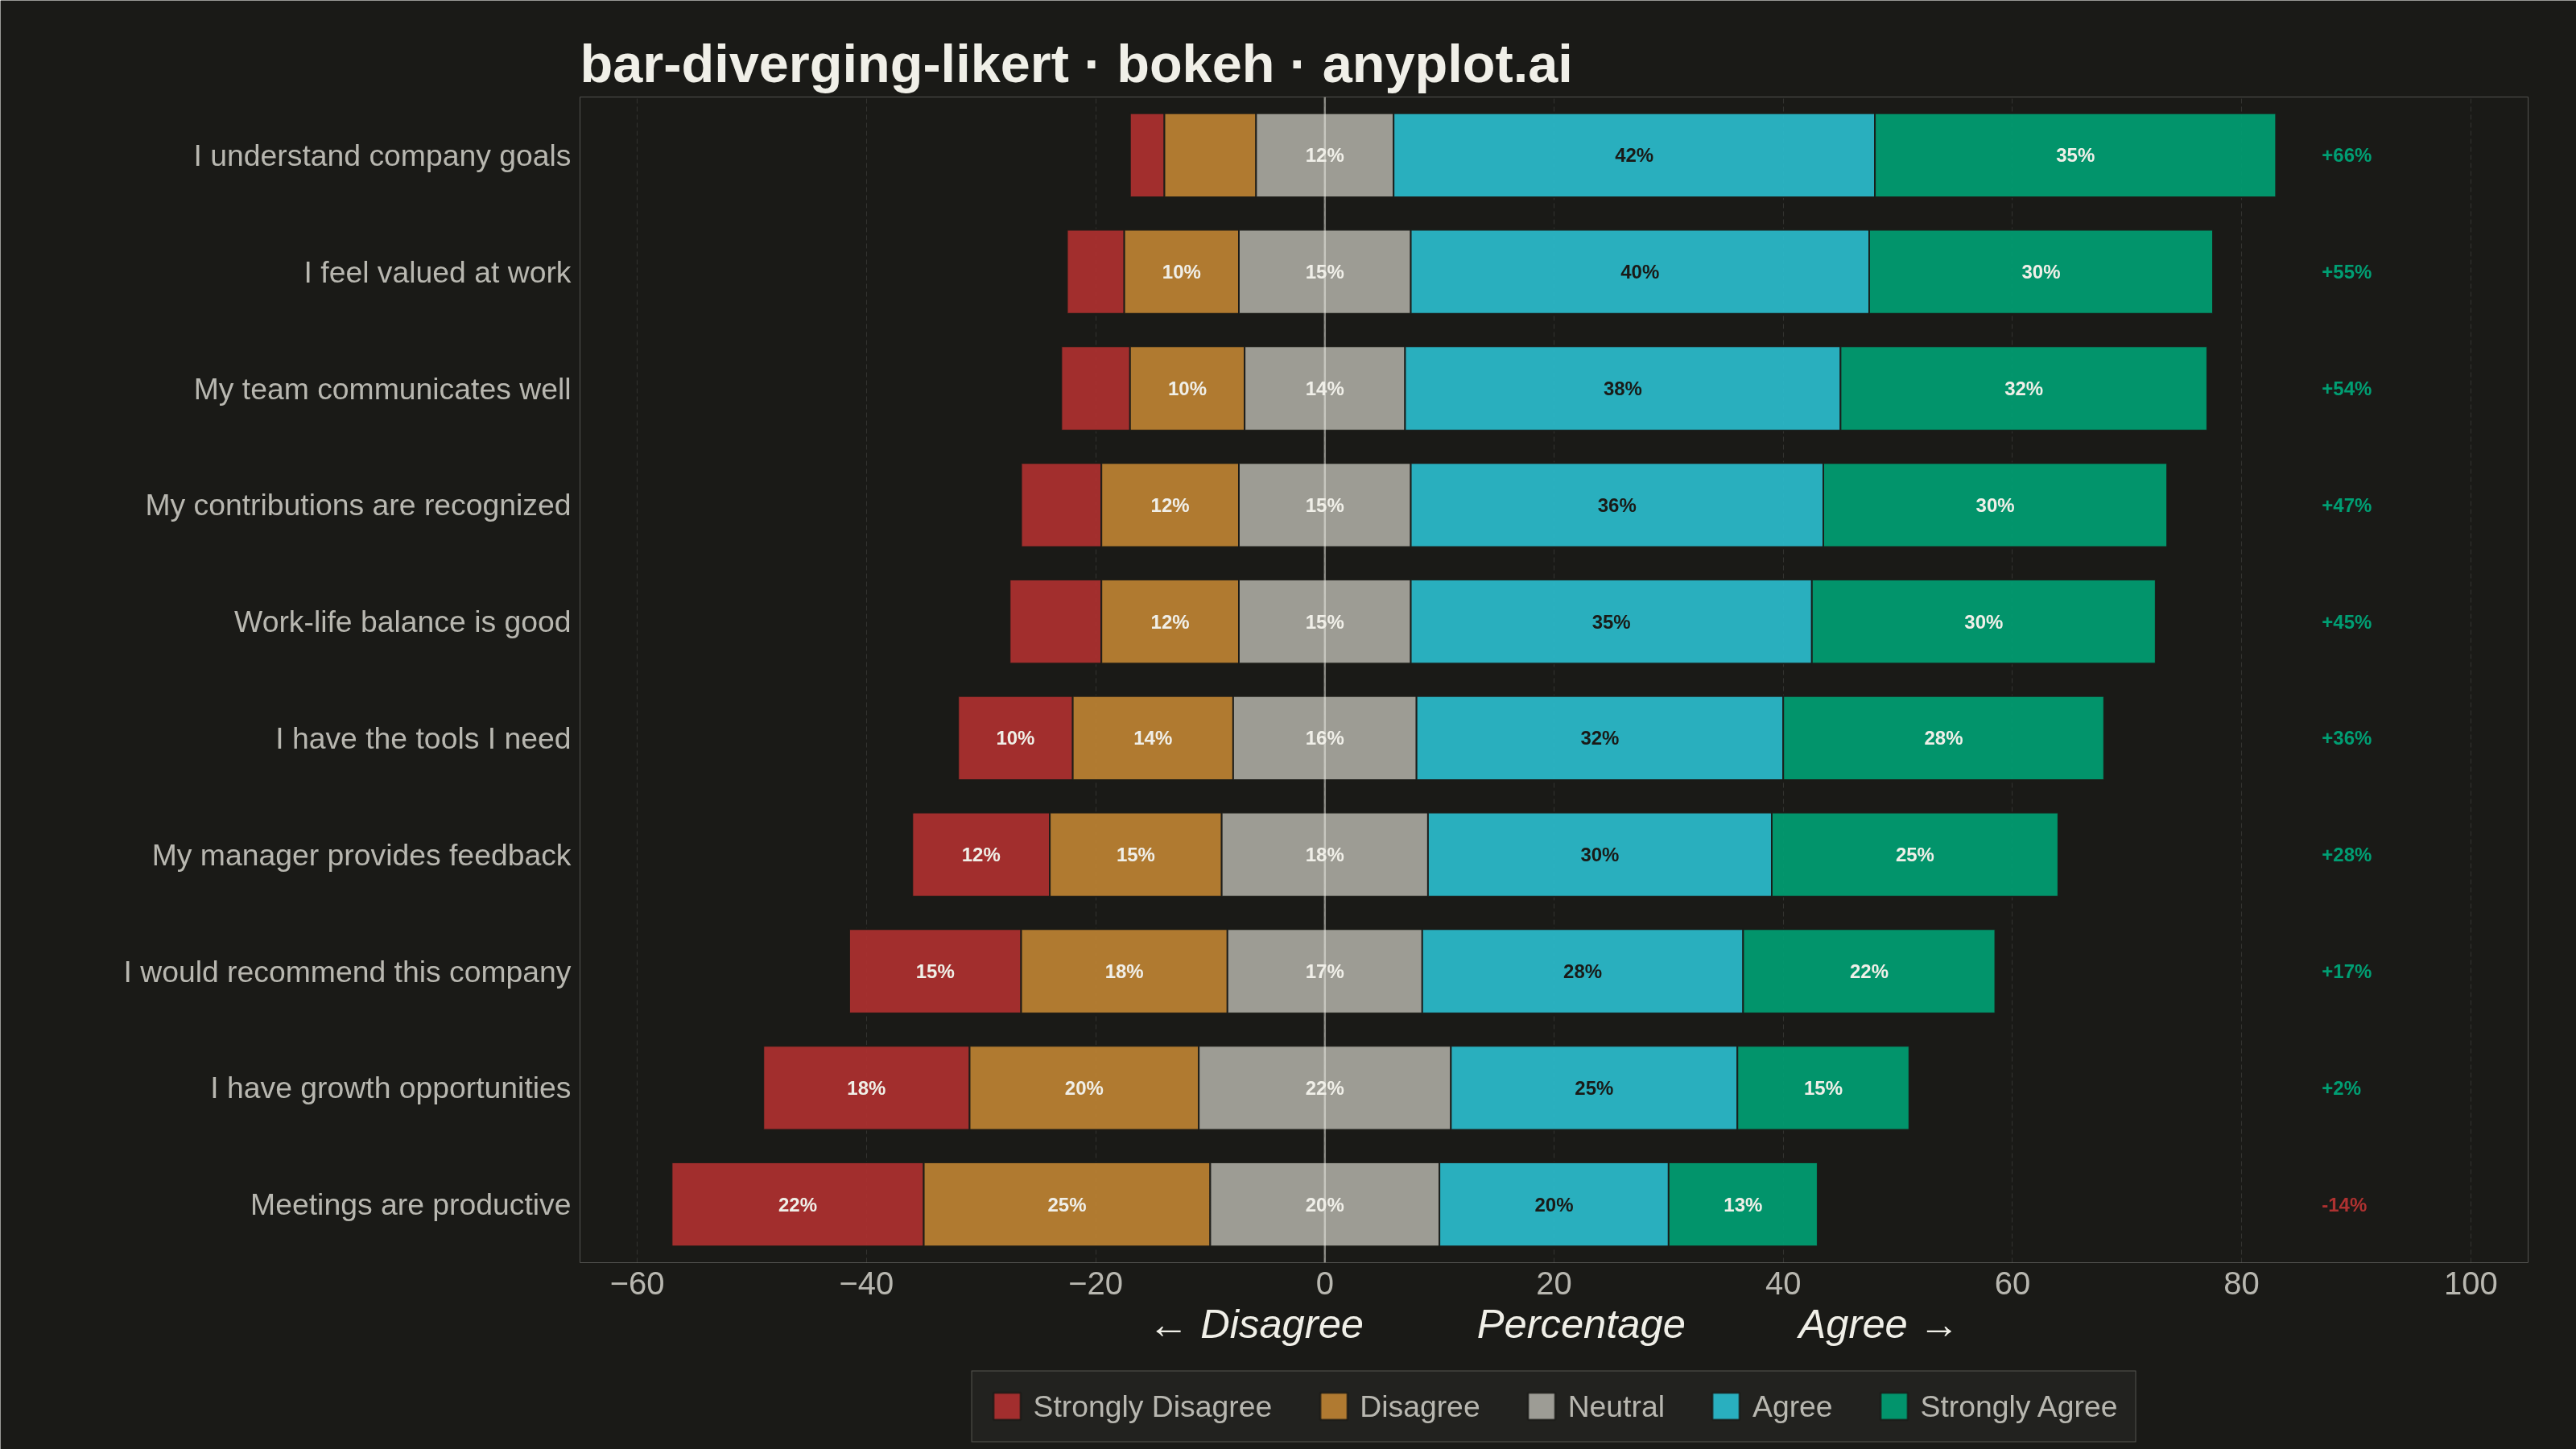
A diverging stacked bar chart designed for Likert scale survey responses (e.g., Strongly Disagree to Strongly Agree). Bars diverge from a central neutral point, with negative responses (Disagree, Strongly Disagree) extending left and positive responses (Agree, Strongly Agree) extending right. This layout makes it easy to compare overall agreement levels across multiple survey questions at a glance.
""" anyplot.ai
bar-diverging-likert: Likert Scale Diverging Bar Chart
Library: bokeh 3.9.0 | Python 3.13.13
Quality: 92/100 | Updated: 2026-06-01
"""

import os
import sys


# Prevent self-import: this file is named bokeh.py, so Python's path search would
# find it before the installed bokeh package. Remove the script's own directory
# from sys.path so imports resolve to the installed package.
_own_dir = os.path.dirname(os.path.abspath(__file__))
sys.path = [p for p in sys.path if os.path.abspath(p) != _own_dir]

import numpy as np
from bokeh.io import export_png, output_file, save
from bokeh.models import ColumnDataSource, HoverTool, LabelSet, Legend, LegendItem, Span
from bokeh.plotting import figure


THEME = os.getenv("ANYPLOT_THEME", "light")

# Theme-adaptive chrome tokens (Imprint palette)
PAGE_BG = "#FAF8F1" if THEME == "light" else "#1A1A17"
ELEVATED_BG = "#FFFDF6" if THEME == "light" else "#242420"
INK = "#1A1A17" if THEME == "light" else "#F0EFE8"
INK_SOFT = "#4A4A44" if THEME == "light" else "#B8B7B0"
INK_MUTED = "#6B6A63" if THEME == "light" else "#A8A79F"

# Data — employee engagement survey, 10 questions, 5-point Likert scale
questions = [
    "I feel valued at work",
    "My manager provides feedback",
    "I have growth opportunities",
    "Work-life balance is good",
    "I understand company goals",
    "My team communicates well",
    "I have the tools I need",
    "I would recommend this company",
    "Meetings are productive",
    "My contributions are recognized",
]

strongly_disagree = [5, 12, 18, 8, 3, 6, 10, 15, 22, 7]
disagree = [10, 15, 20, 12, 8, 10, 14, 18, 25, 12]
neutral = [15, 18, 22, 15, 12, 14, 16, 17, 20, 15]
agree = [40, 30, 25, 35, 42, 38, 32, 28, 20, 36]
strongly_agree = [30, 25, 15, 30, 35, 32, 28, 22, 13, 30]

# Sort questions by net agreement (agree + strongly agree) - (disagree + strongly disagree)
net_agreement = [
    (sa + a) - (sd + d) for sa, a, sd, d in zip(strongly_agree, agree, strongly_disagree, disagree, strict=True)
]
sorted_idx = np.argsort(net_agreement)
questions_sorted = [questions[i] for i in sorted_idx]
net_sorted = [net_agreement[i] for i in sorted_idx]
sd_sorted = [strongly_disagree[i] for i in sorted_idx]
d_sorted = [disagree[i] for i in sorted_idx]
n_sorted = [neutral[i] for i in sorted_idx]
a_sorted = [agree[i] for i in sorted_idx]
sa_sorted = [strongly_agree[i] for i in sorted_idx]

# Imprint palette — semantic mapping for diverging Likert:
# negative→red, neutral→muted, positive→green (semantic exception per style guide)
likert_colors = {
    "Strongly Disagree": "#AE3030",  # Imprint matte red (semantic: bad/negative)
    "Disagree": "#BD8233",  # Imprint ochre (warm, moderate negative)
    "Neutral": INK_MUTED,  # theme-adaptive muted gray
    "Agree": "#2ABCCD",  # Imprint cyan (cool, moderate positive)
    "Strongly Agree": "#009E73",  # Imprint brand green (strong positive)
}

# Contrasting text colors inside bar segments
label_text_colors = {
    "Strongly Disagree": "#F0EFE8",  # light on dark red
    "Disagree": "#F0EFE8",  # light on ochre
    "Neutral": "#F0EFE8",  # light on muted gray
    "Agree": "#1A1A17",  # dark on light cyan
    "Strongly Agree": "#F0EFE8",  # light on green
}

# Canvas — 3200×1800 (landscape, canonical bokeh)
# x_range: max left extent ≈ -57, max right ≈ 83; labels extend to ~98
# min_border_left enlarged to accommodate 34pt question labels (longest ~30 chars)
p = figure(
    width=3200,
    height=1800,
    y_range=questions_sorted,
    x_range=(-65, 105),
    title="bar-diverging-likert · bokeh · anyplot.ai",
    toolbar_location=None,
    min_border_bottom=180,
    min_border_left=720,
    min_border_top=120,
    min_border_right=60,
)

# Build diverging bars: neutral centered at 0, disagree left, agree right
likert_categories = ["Strongly Disagree", "Disagree", "Neutral", "Agree", "Strongly Agree"]
data_by_cat = {
    "Strongly Disagree": sd_sorted,
    "Disagree": d_sorted,
    "Neutral": n_sorted,
    "Agree": a_sorted,
    "Strongly Agree": sa_sorted,
}

legend_items = []
for cat_name in likert_categories:
    cat_values = data_by_cat[cat_name]
    lefts = []
    rights = []

    for q_idx in range(len(questions_sorted)):
        half_n = n_sorted[q_idx] / 2

        if cat_name == "Strongly Disagree":
            r = -(half_n + d_sorted[q_idx])
            lft = r - sd_sorted[q_idx]
        elif cat_name == "Disagree":
            r = -half_n
            lft = r - d_sorted[q_idx]
        elif cat_name == "Neutral":
            lft = -half_n
            r = half_n
        elif cat_name == "Agree":
            lft = half_n
            r = lft + a_sorted[q_idx]
        else:  # Strongly Agree
            lft = half_n + a_sorted[q_idx]
            r = lft + sa_sorted[q_idx]

        lefts.append(lft)
        rights.append(r)

    source = ColumnDataSource(
        data={
            "question": questions_sorted,
            "left": lefts,
            "right": rights,
            "value": cat_values,
            "category": [cat_name] * len(questions_sorted),
        }
    )

    renderer = p.hbar(
        y="question",
        left="left",
        right="right",
        height=0.72,
        source=source,
        color=likert_colors[cat_name],
        line_color=PAGE_BG,
        line_width=2,
        alpha=0.92,
    )
    legend_items.append(LegendItem(label=cat_name, renderers=[renderer]))

    hover = HoverTool(
        renderers=[renderer], tooltips=[("Question", "@question"), ("Response", "@category"), ("Percentage", "@value%")]
    )
    p.add_tools(hover)

    # Percentage labels inside segments ≥10%
    label_x = []
    label_y = []
    label_text_list = []
    for q_idx in range(len(questions_sorted)):
        if cat_values[q_idx] >= 10:
            label_x.append((lefts[q_idx] + rights[q_idx]) / 2)
            label_y.append(questions_sorted[q_idx])
            label_text_list.append(f"{cat_values[q_idx]}%")

    if label_text_list:
        label_source = ColumnDataSource(data={"x": label_x, "y": label_y, "text": label_text_list})
        labels = LabelSet(
            x="x",
            y="y",
            text="text",
            source=label_source,
            text_align="center",
            text_baseline="middle",
            text_font_size="18pt",
            text_color=label_text_colors[cat_name],
            text_font_style="bold",
        )
        p.add_layout(labels)

# Zero-line baseline
center_line = Span(location=0, dimension="height", line_color=INK, line_width=2.5, line_alpha=0.5)
p.add_layout(center_line)

# Net agreement annotations on the right — LabelSet supports categorical y values
# Split into two sets to give positive/negative distinct Imprint colors
net_color_pos = "#009E73"  # Imprint green for positive net
net_color_neg = "#AE3030"  # Imprint red for negative net

pos_idx = [i for i, n in enumerate(net_sorted) if n >= 0]
neg_idx = [i for i, n in enumerate(net_sorted) if n < 0]

if pos_idx:
    pos_src = ColumnDataSource(
        data={
            "x": [87] * len(pos_idx),
            "y": [questions_sorted[i] for i in pos_idx],
            "text": [f"+{net_sorted[i]}%" for i in pos_idx],
        }
    )
    p.add_layout(
        LabelSet(
            x="x",
            y="y",
            text="text",
            source=pos_src,
            text_align="left",
            text_baseline="middle",
            text_font_size="18pt",
            text_color=net_color_pos,
            text_font_style="bold",
        )
    )

if neg_idx:
    neg_src = ColumnDataSource(
        data={
            "x": [87] * len(neg_idx),
            "y": [questions_sorted[i] for i in neg_idx],
            "text": [f"{net_sorted[i]}%" for i in neg_idx],
        }
    )
    p.add_layout(
        LabelSet(
            x="x",
            y="y",
            text="text",
            source=neg_src,
            text_align="left",
            text_baseline="middle",
            text_font_size="18pt",
            text_color=net_color_neg,
            text_font_style="bold",
        )
    )

# Legend at bottom, horizontal
legend = Legend(
    items=legend_items,
    orientation="horizontal",
    location="center",
    label_text_font_size="28pt",
    label_text_color=INK_SOFT,
    label_standoff=12,
    spacing=55,
    padding=22,
    margin=18,
    background_fill_color=ELEVATED_BG,
    background_fill_alpha=0.9,
    border_line_color=INK_SOFT,
    border_line_alpha=0.35,
    glyph_height=42,
    glyph_width=42,
    click_policy="hide",
)
p.add_layout(legend, "below")

# Typography — canonical bokeh sizing for 3200×1800
p.title.text_font_size = "50pt"
p.title.text_color = INK
p.title.text_font_style = "bold"

p.xaxis.axis_label = "← Disagree          Percentage          Agree →"
p.xaxis.axis_label_text_font_size = "38pt"
p.xaxis.axis_label_text_color = INK
p.xaxis.major_label_text_font_size = "30pt"
p.xaxis.major_label_text_color = INK_SOFT

# Y-axis: 34pt for question labels, large min_border_left reserves space for ~30-char labels
p.yaxis.major_label_text_font_size = "28pt"
p.yaxis.major_label_text_color = INK_SOFT

# Grid — subtle x-only (low alpha, dashed)
p.xgrid.grid_line_color = INK
p.xgrid.grid_line_alpha = 0.12
p.xgrid.grid_line_dash = [6, 4]
p.ygrid.grid_line_alpha = 0.0

# Theme-adaptive chrome
p.background_fill_color = PAGE_BG
p.border_fill_color = PAGE_BG
p.outline_line_color = None

# Remove axis lines and tick marks (clean, minimal look)
p.xaxis.axis_line_color = None
p.yaxis.axis_line_color = None
p.xaxis.major_tick_line_color = None
p.yaxis.major_tick_line_color = None
p.xaxis.minor_tick_line_color = None
p.yaxis.minor_tick_line_color = None

# Save HTML (interactive catalog artifact)
output_file(f"plot-{THEME}.html")
save(p, title="bar-diverging-likert · bokeh · anyplot.ai")

# Export PNG via export_png (uses /usr/bin/chromedriver, which is the real driver in CI)
export_png(p, filename=f"plot-{THEME}.png")
Runnable source as JSON, for any HTTP client: https://api.anyplot.ai/specs/bar-diverging-likert/bokeh/code. Any spec id and library id listed in llms-full.txt fit the same URL shape; every URL below is complete and callable.
{
  "spec_id": "bar-diverging-likert",
  "language": "python",
  "library": "bokeh",
  "page": "https://anyplot.ai/bar-diverging-likert/python/bokeh",
  "hub": "https://anyplot.ai/bar-diverging-likert",
  "code_json": "https://api.anyplot.ai/specs/bar-diverging-likert/bokeh/code",
  "spec_json": "https://api.anyplot.ai/specs/bar-diverging-likert",
  "render_light_png": "https://storage.googleapis.com/anyplot-images/plots/bar-diverging-likert/python/bokeh/plot-light.png",
  "render_dark_png": "https://storage.googleapis.com/anyplot-images/plots/bar-diverging-likert/python/bokeh/plot-dark.png",
  "interactive_light_html": "https://storage.googleapis.com/anyplot-images/plots/bar-diverging-likert/python/bokeh/plot-light.html",
  "interactive_dark_html": "https://storage.googleapis.com/anyplot-images/plots/bar-diverging-likert/python/bokeh/plot-dark.html",
  "quality_score": 92.0,
  "license": "MIT",
  "guide": "https://anyplot.ai/llms.txt"
}
Part of Likert Scale Diverging Bar Chart on anyplot.ai.