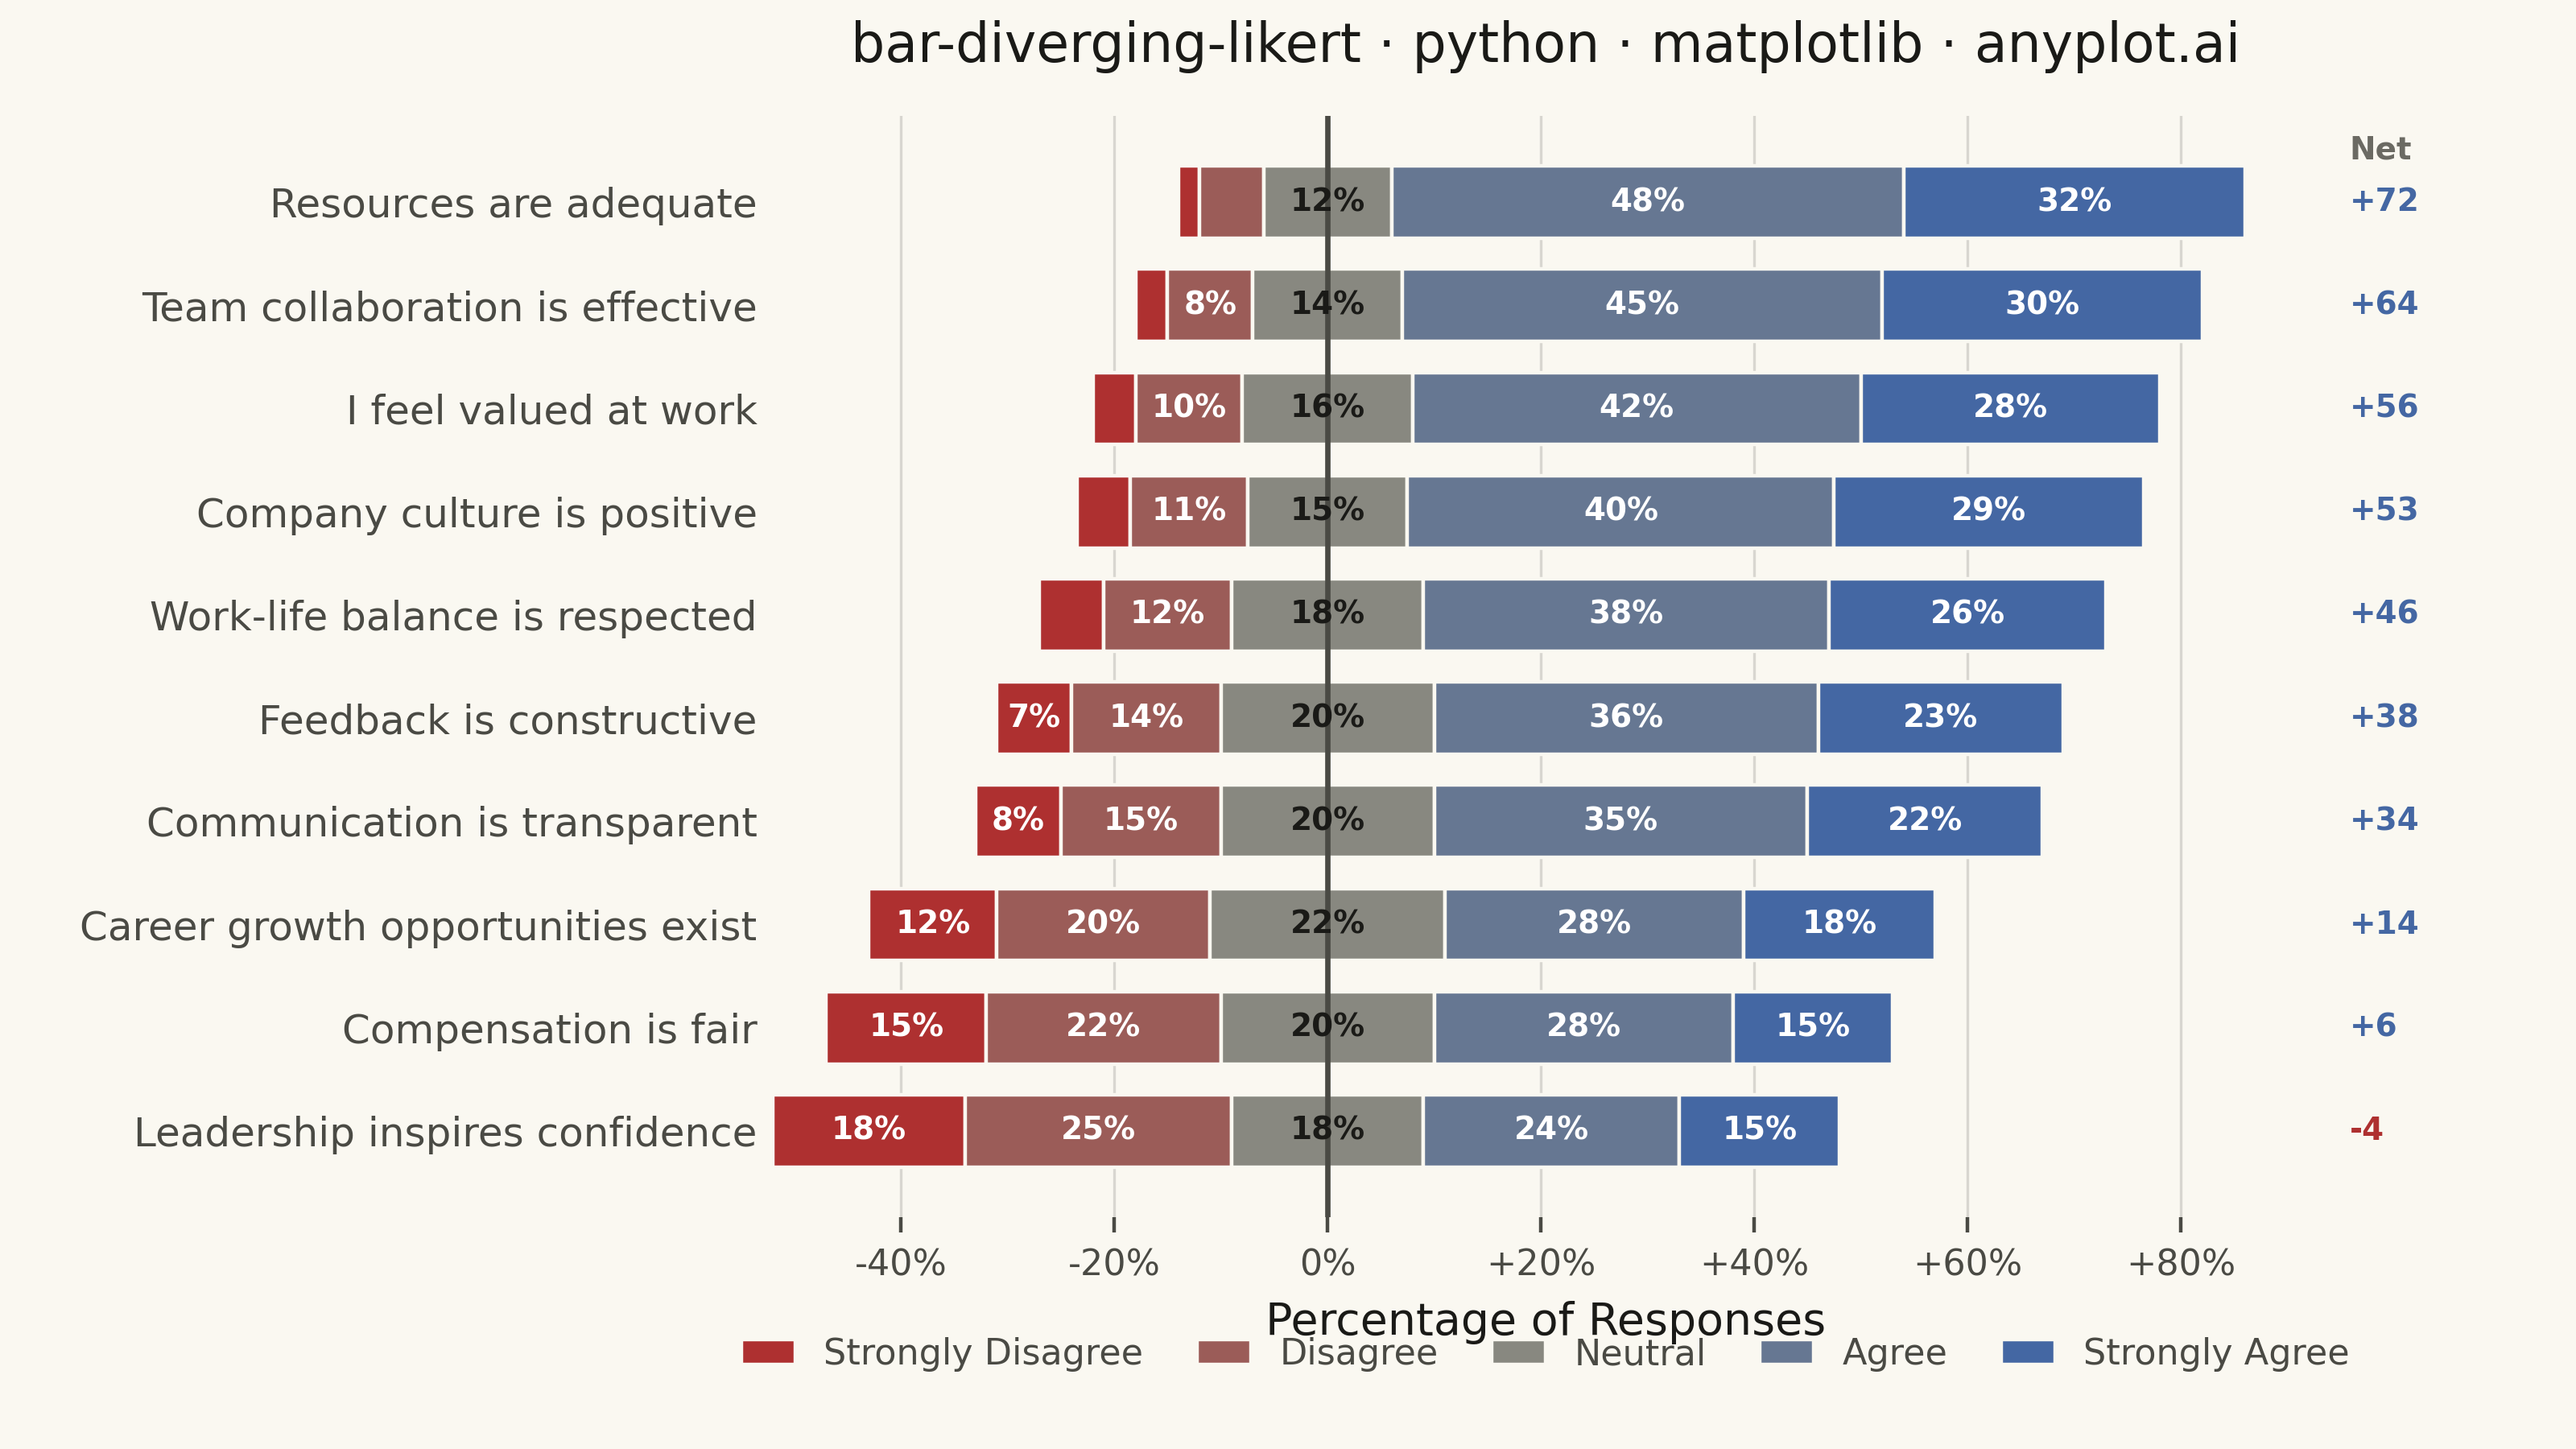
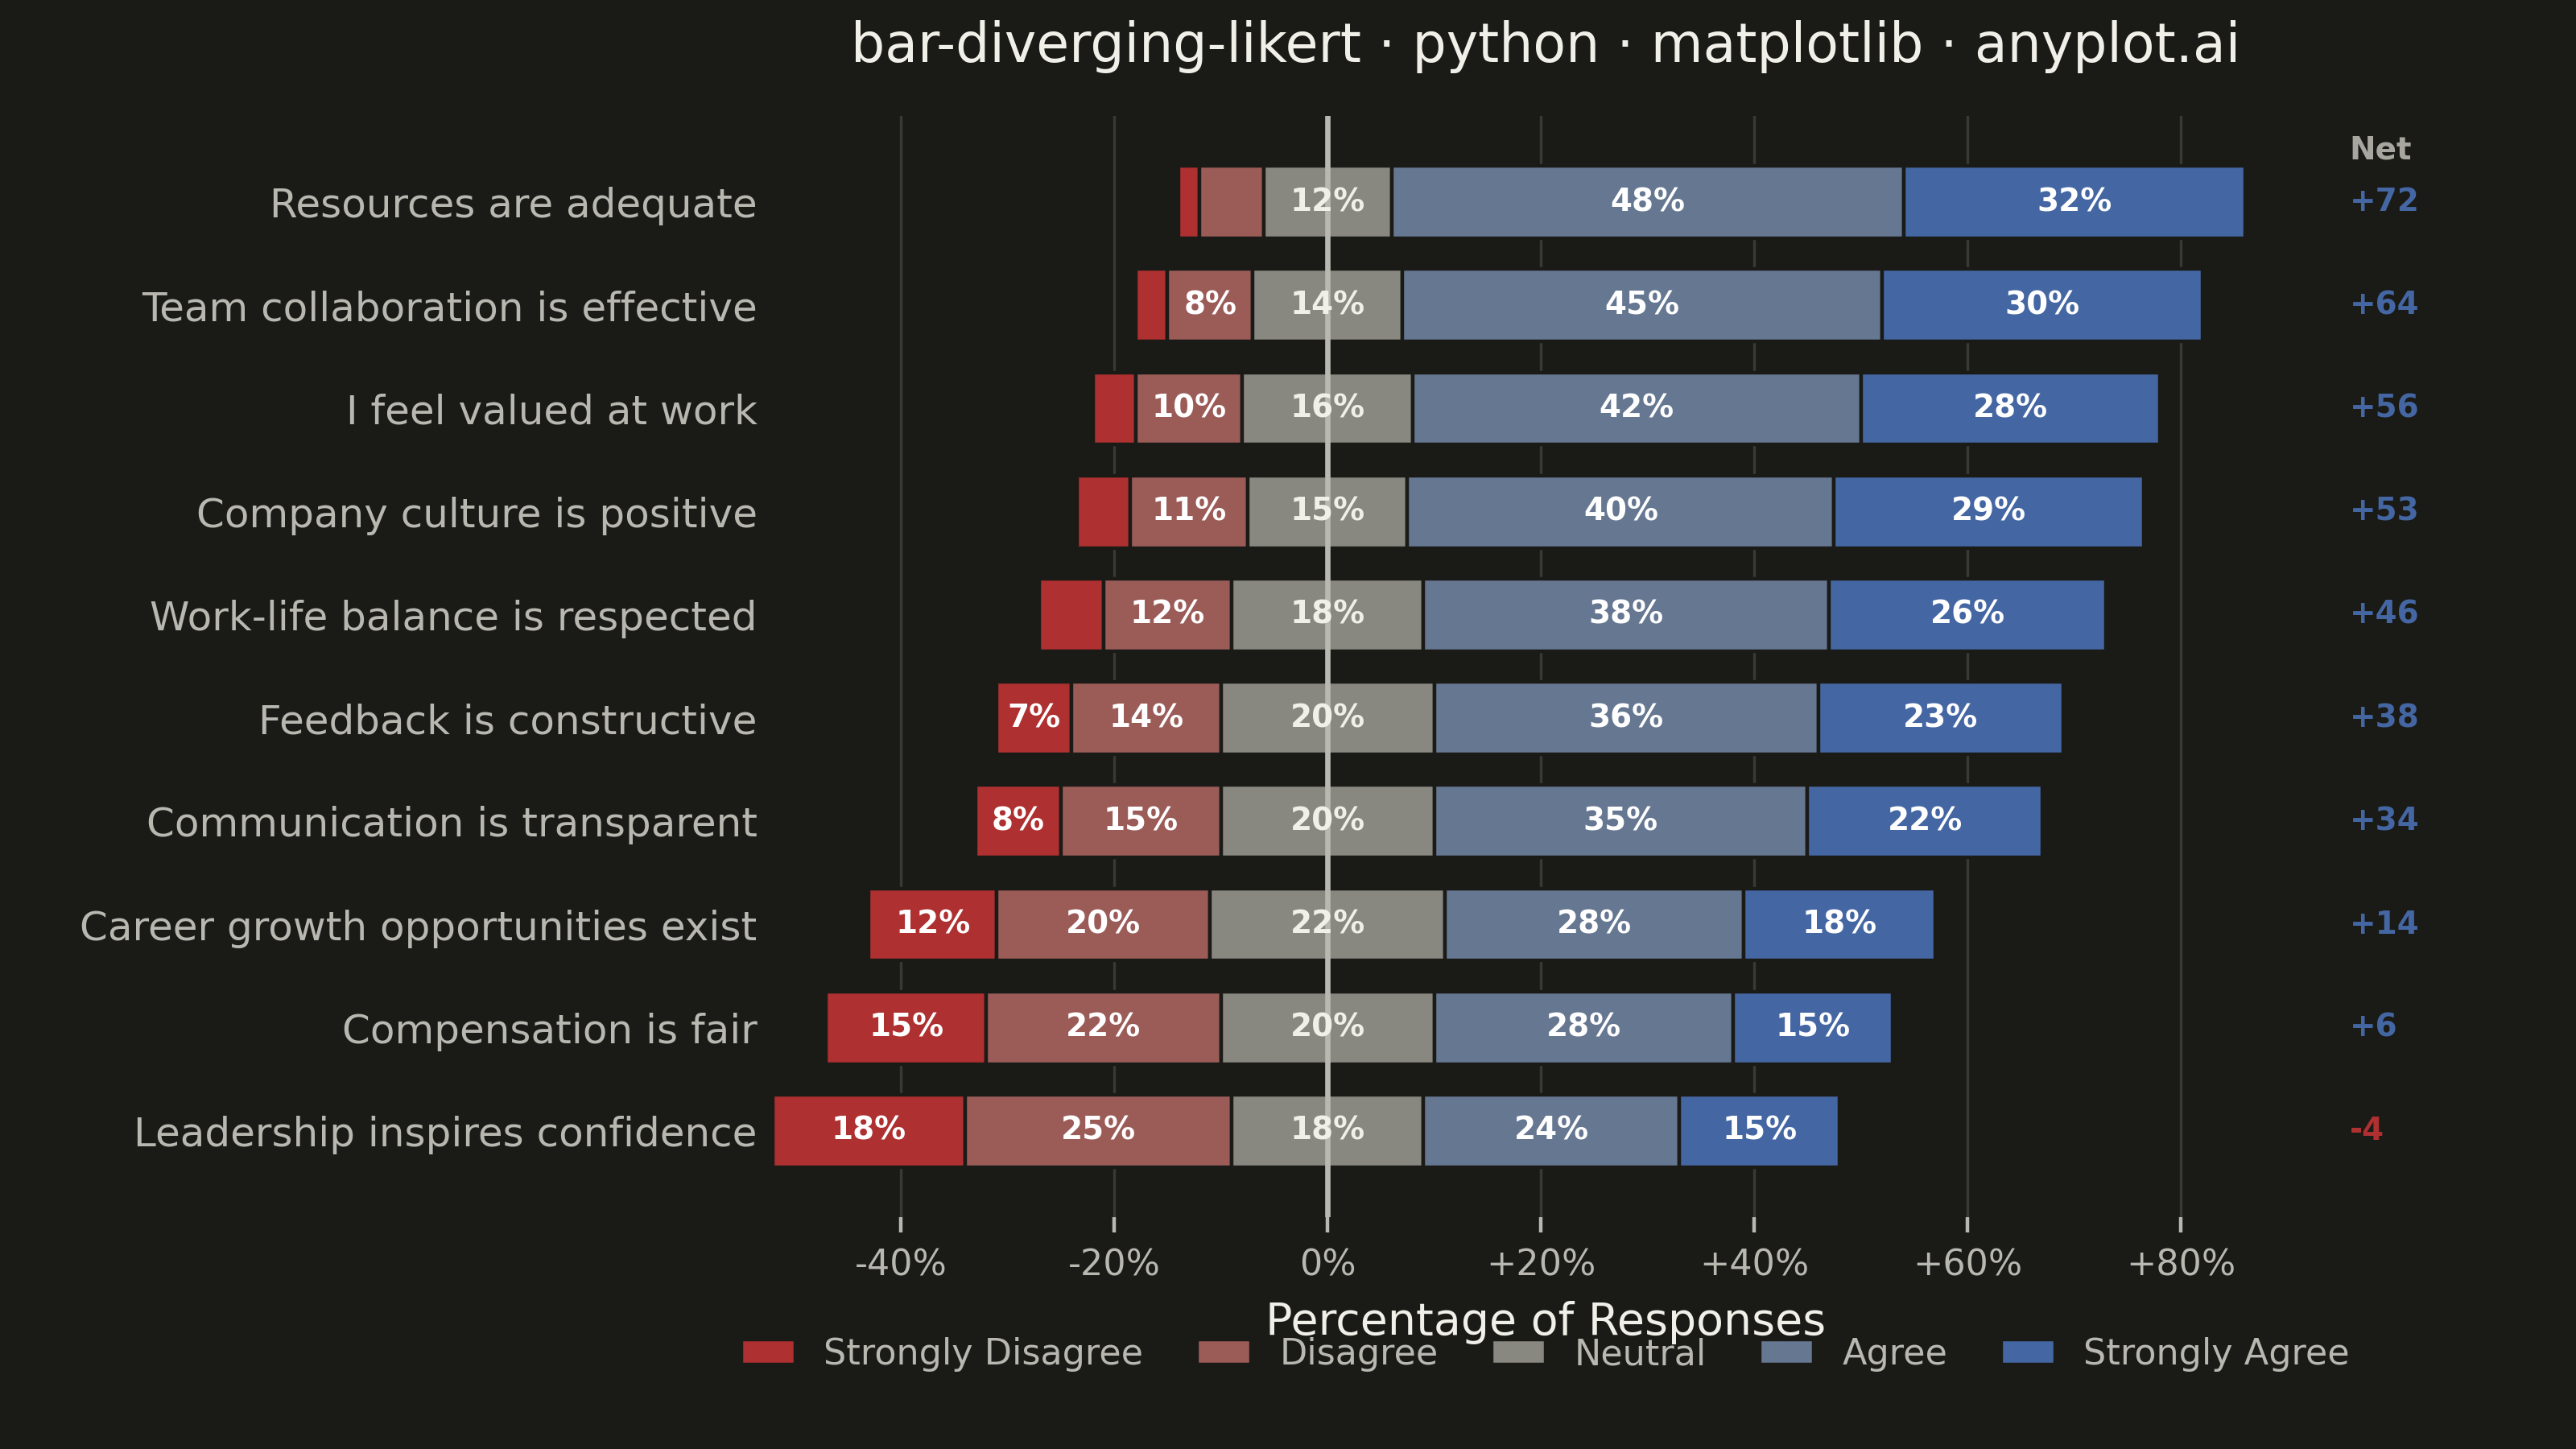
A diverging stacked bar chart designed for Likert scale survey responses (e.g., Strongly Disagree to Strongly Agree). Bars diverge from a central neutral point, with negative responses (Disagree, Strongly Disagree) extending left and positive responses (Agree, Strongly Agree) extending right. This layout makes it easy to compare overall agreement levels across multiple survey questions at a glance.
""" anyplot.ai
bar-diverging-likert: Likert Scale Diverging Bar Chart
Library: matplotlib 3.10.9 | Python 3.13.13
Quality: 87/100 | Updated: 2026-06-01
"""

import os

import matplotlib.pyplot as plt
import matplotlib.ticker as mticker
import numpy as np
import pandas as pd
from matplotlib.colors import LinearSegmentedColormap


# Theme tokens
THEME = os.getenv("ANYPLOT_THEME", "light")
PAGE_BG = "#FAF8F1" if THEME == "light" else "#1A1A17"
INK = "#1A1A17" if THEME == "light" else "#F0EFE8"
INK_SOFT = "#4A4A44" if THEME == "light" else "#B8B7B0"
INK_MUTED = "#6B6A63" if THEME == "light" else "#A8A79F"

# Imprint-derived diverging palette for Likert categories
# Midpoint is a fixed neutral hex so intermediate colors are theme-stable
NEUTRAL_GRAY = "#888880"
div_cmap = LinearSegmentedColormap.from_list("imprint_div", ["#AE3030", NEUTRAL_GRAY, "#4467A3"])
cat_colors = {
    "Strongly Disagree": "#AE3030",  # Imprint semantic red
    "Disagree": div_cmap(0.25),  # blended red-neutral
    "Neutral": NEUTRAL_GRAY,  # fixed mid-gray (theme-stable)
    "Agree": div_cmap(0.75),  # blended neutral-blue
    "Strongly Agree": "#4467A3",  # Imprint blue (position 3)
}

# Data — hand-crafted employee engagement survey (10 questions, 5-point Likert)
questions = [
    "I feel valued at work",
    "Communication is transparent",
    "Leadership inspires confidence",
    "Work-life balance is respected",
    "Career growth opportunities exist",
    "Team collaboration is effective",
    "Resources are adequate",
    "Feedback is constructive",
    "Company culture is positive",
    "Compensation is fair",
]

data = {
    "question": questions,
    "Strongly Disagree": [4, 8, 18, 6, 12, 3, 2, 7, 5, 15],
    "Disagree": [10, 15, 25, 12, 20, 8, 6, 14, 11, 22],
    "Neutral": [16, 20, 18, 18, 22, 14, 12, 20, 15, 20],
    "Agree": [42, 35, 24, 38, 28, 45, 48, 36, 40, 28],
    "Strongly Agree": [28, 22, 15, 26, 18, 30, 32, 23, 29, 15],
}

df = pd.DataFrame(data)

# Sort by net agreement (ascending so highest appears at top of chart)
net_scores = (df["Agree"] + df["Strongly Agree"]) - (df["Disagree"] + df["Strongly Disagree"])
df = df.iloc[net_scores.argsort()].reset_index(drop=True)

# Diverging bar positions — neutral split evenly at center
half_neutral = df["Neutral"] / 2
cat_order = ["Strongly Disagree", "Disagree", "Neutral", "Agree", "Strongly Agree"]
starts = {
    "Strongly Disagree": -(df["Strongly Disagree"] + df["Disagree"] + half_neutral),
    "Disagree": -(df["Disagree"] + half_neutral),
    "Neutral": -half_neutral,
    "Agree": half_neutral,
    "Strongly Agree": half_neutral + df["Agree"],
}

# Plot
fig, ax = plt.subplots(figsize=(8, 4.5), dpi=400, facecolor=PAGE_BG)
ax.set_facecolor(PAGE_BG)
y_pos = np.arange(len(df))
bar_height = 0.7

for label in cat_order:
    ax.barh(
        y_pos,
        df[label],
        left=starts[label],
        height=bar_height,
        color=cat_colors[label],
        edgecolor=PAGE_BG,
        linewidth=0.8,
        label=label,
        zorder=2,
    )

# Percentage labels inside segments ≥7%
for i in range(len(df)):
    for label in cat_order:
        w = df[label].iloc[i]
        s = starts[label].iloc[i]
        if w >= 7:
            cx = s + w / 2
            text_color = INK if label == "Neutral" else "white"
            ax.text(
                cx, i, f"{w:.0f}%", ha="center", va="center", fontsize=7, fontweight="bold", color=text_color, zorder=4
            )

# Center line
ax.axvline(x=0, color=INK_SOFT, linewidth=1.2, zorder=3)

# X-axis grid
ax.xaxis.grid(True, alpha=0.15, linewidth=0.6, color=INK, zorder=0)
ax.set_axisbelow(True)

ax.xaxis.set_major_formatter(mticker.FuncFormatter(lambda x, _: f"{x:+.0f}%" if x != 0 else "0%"))
ax.xaxis.set_major_locator(mticker.MultipleLocator(20))

# Style
title = "bar-diverging-likert · python · matplotlib · anyplot.ai"
title_fontsize = max(8, round(12 * 67 / len(title))) if len(title) > 67 else 12
ax.set_yticks(y_pos)
ax.set_yticklabels(df["question"], fontsize=9, color=INK_SOFT)
ax.set_xlabel("Percentage of Responses", fontsize=10, color=INK)
ax.set_title(title, fontsize=title_fontsize, fontweight="medium", color=INK, pad=12)
ax.tick_params(axis="x", labelsize=8, colors=INK_SOFT)
ax.tick_params(axis="y", length=0)

# Remove all spines — center line provides the zero reference
for spine in ax.spines.values():
    spine.set_visible(False)

# Net agreement column on right
for i in range(len(df)):
    net_val = (df["Agree"].iloc[i] + df["Strongly Agree"].iloc[i]) - (
        df["Disagree"].iloc[i] + df["Strongly Disagree"].iloc[i]
    )
    sign = "+" if net_val > 0 else ""
    net_color = "#4467A3" if net_val > 0 else "#AE3030"
    ax.annotate(
        f"{sign}{net_val}",
        xy=(1.02, i),
        xycoords=("axes fraction", "data"),
        fontsize=7,
        fontweight="bold",
        color=net_color,
        va="center",
        ha="left",
        annotation_clip=False,
    )

ax.annotate(
    "Net",
    xy=(1.02, len(df) - 0.5),
    xycoords=("axes fraction", "data"),
    fontsize=7,
    fontweight="bold",
    color=INK_MUTED,
    va="center",
    ha="left",
    annotation_clip=False,
)

# Legend below chart
handles, legend_labels = ax.get_legend_handles_labels()
leg = ax.legend(
    handles,
    legend_labels,
    loc="upper center",
    bbox_to_anchor=(0.5, -0.08),
    ncol=5,
    fontsize=8,
    frameon=False,
    handlelength=1.5,
    columnspacing=1.5,
)
plt.setp(leg.get_texts(), color=INK_SOFT)

fig.subplots_adjust(left=0.30, right=0.90, top=0.92, bottom=0.16)
plt.savefig(f"plot-{THEME}.png", dpi=400, facecolor=PAGE_BG)
Runnable source as JSON, for any HTTP client: https://api.anyplot.ai/specs/bar-diverging-likert/matplotlib/code. Any spec id and library id listed in llms-full.txt fit the same URL shape; every URL below is complete and callable.
{
  "spec_id": "bar-diverging-likert",
  "language": "python",
  "library": "matplotlib",
  "page": "https://anyplot.ai/bar-diverging-likert/python/matplotlib",
  "hub": "https://anyplot.ai/bar-diverging-likert",
  "code_json": "https://api.anyplot.ai/specs/bar-diverging-likert/matplotlib/code",
  "spec_json": "https://api.anyplot.ai/specs/bar-diverging-likert",
  "render_light_png": "https://storage.googleapis.com/anyplot-images/plots/bar-diverging-likert/python/matplotlib/plot-light.png",
  "render_dark_png": "https://storage.googleapis.com/anyplot-images/plots/bar-diverging-likert/python/matplotlib/plot-dark.png",
  "quality_score": 87.0,
  "license": "MIT",
  "guide": "https://anyplot.ai/llms.txt"
}
Part of Likert Scale Diverging Bar Chart on anyplot.ai.