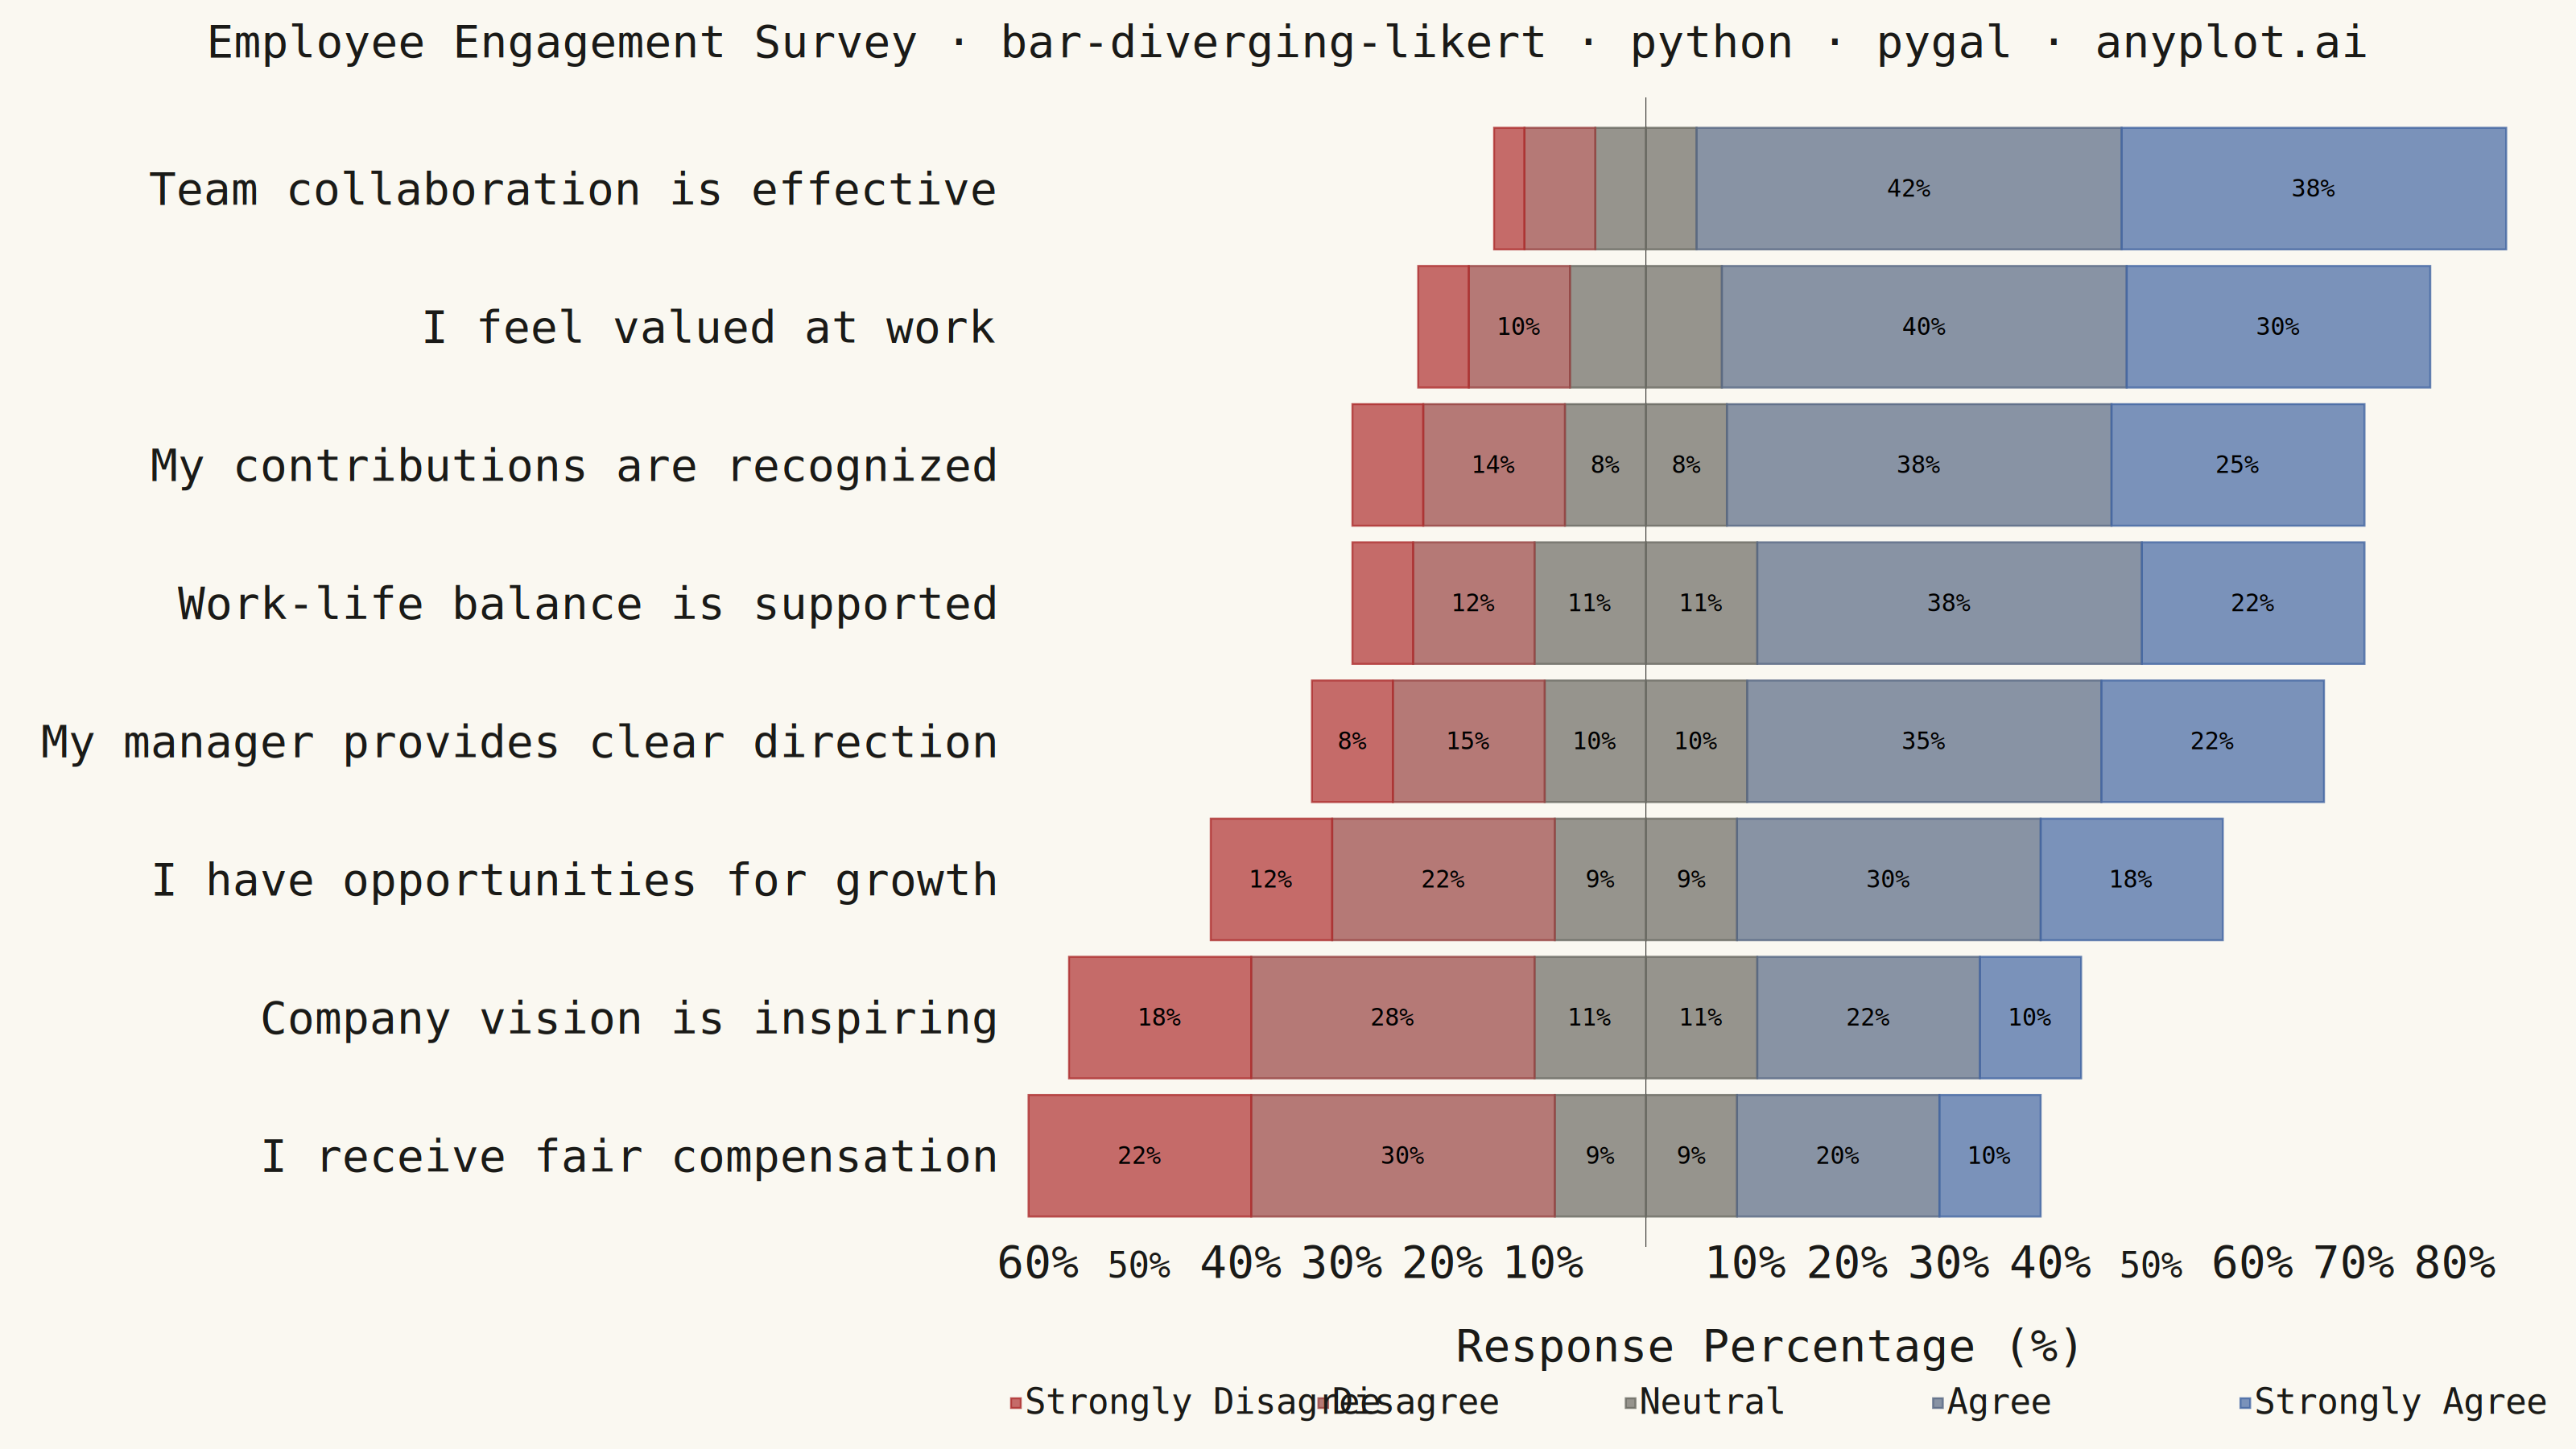
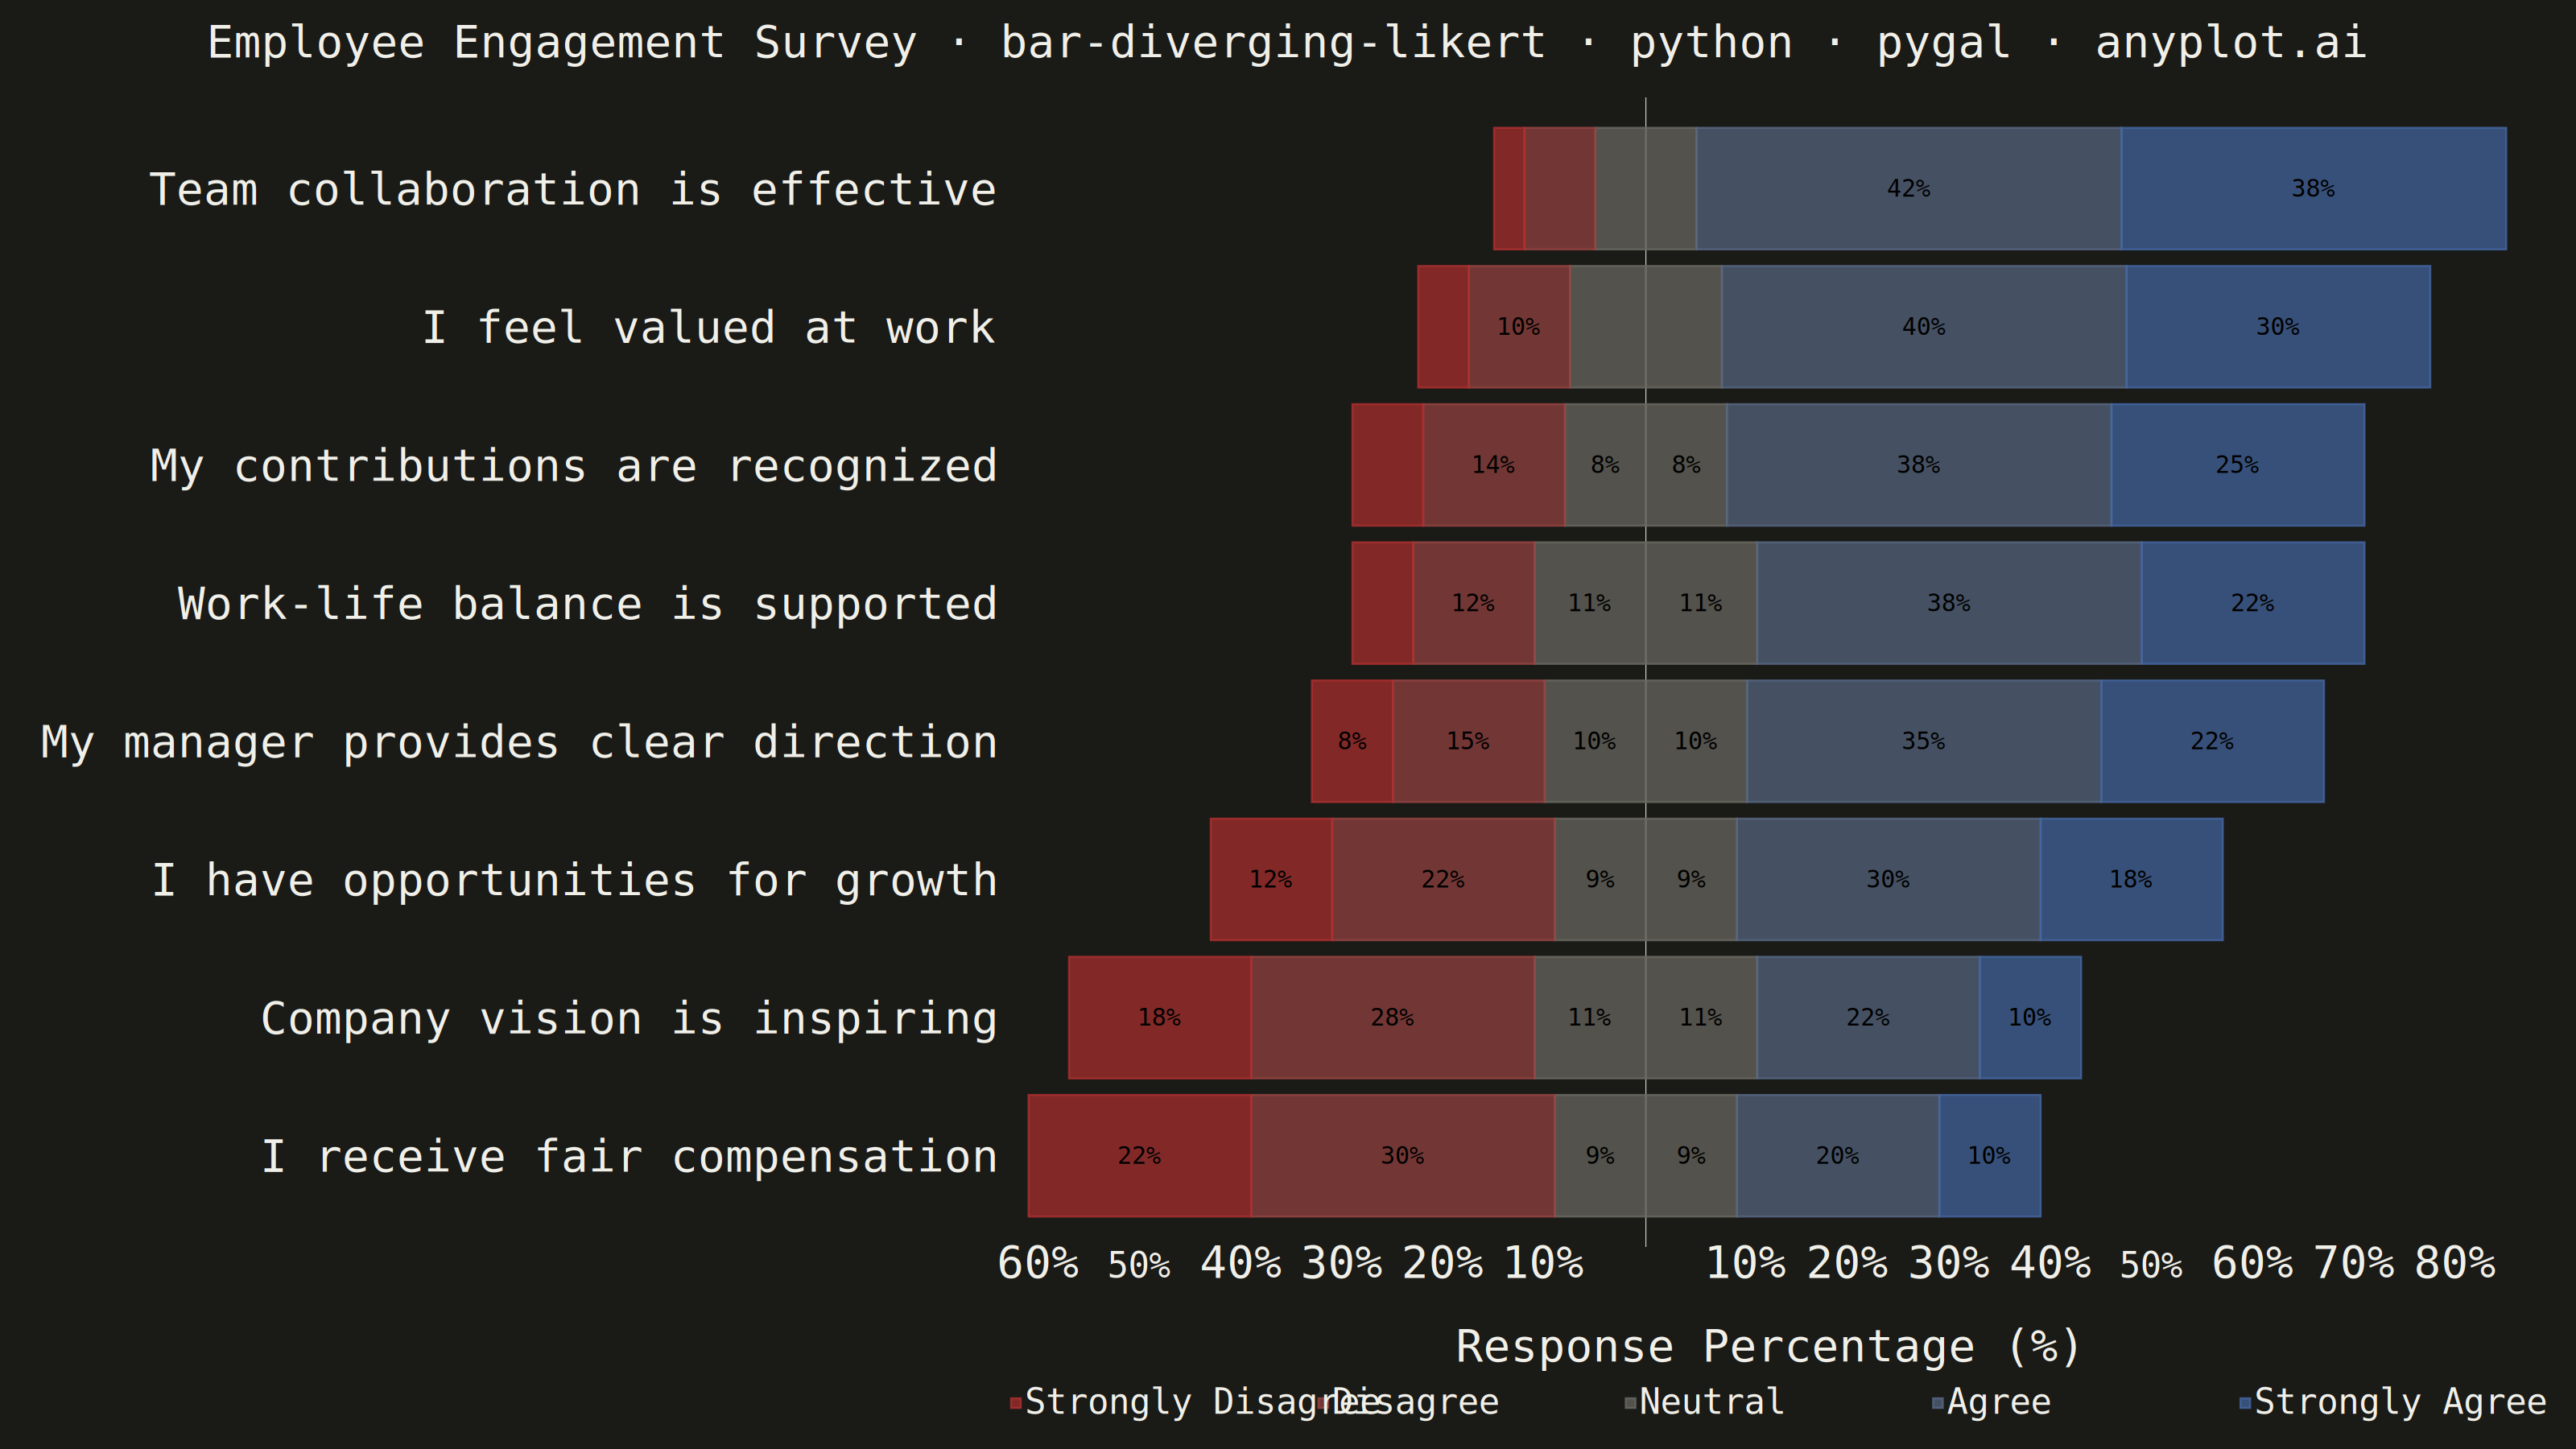
A diverging stacked bar chart designed for Likert scale survey responses (e.g., Strongly Disagree to Strongly Agree). Bars diverge from a central neutral point, with negative responses (Disagree, Strongly Disagree) extending left and positive responses (Agree, Strongly Agree) extending right. This layout makes it easy to compare overall agreement levels across multiple survey questions at a glance.
""" anyplot.ai
bar-diverging-likert: Likert Scale Diverging Bar Chart
Library: pygal 3.1.0 | Python 3.13.13
Quality: 86/100 | Updated: 2026-06-01
"""

import importlib.util
import os
import re
import sys
from xml.etree import ElementTree as ET

import cairosvg


# Prevent self-import: this file is named pygal.py, so import the installed package explicitly
_spec = importlib.util.find_spec("pygal")
if _spec and _spec.origin != __file__:
    import pygal
    from pygal.style import Style
else:
    _cwd = os.getcwd()
    sys.path = [p for p in sys.path if os.path.abspath(p) != _cwd]
    try:
        import pygal
        from pygal.style import Style
    finally:
        sys.path.insert(0, _cwd)


# Theme tokens
THEME = os.getenv("ANYPLOT_THEME", "light")
PAGE_BG = "#FAF8F1" if THEME == "light" else "#1A1A17"
INK = "#1A1A17" if THEME == "light" else "#F0EFE8"
INK_MUTED = "#6B6A63" if THEME == "light" else "#A8A79F"


def _lerp_hex(c0, c1, t):
    r0, g0, b0 = (int(c0[i : i + 2], 16) for i in (1, 3, 5))
    r1, g1, b1 = (int(c1[i : i + 2], 16) for i in (1, 3, 5))
    return "#{:02X}{:02X}{:02X}".format(
        int(round(r0 + (r1 - r0) * t)), int(round(g0 + (g1 - g0) * t)), int(round(b0 + (b1 - b0) * t))
    )


# Imprint palette diverging scale for 5 Likert responses
# Use fixed light-value of INK_MUTED so intermediate colors are theme-invariant
INK_MUTED_FIXED = "#6B6A63"
STRONGLY_DISAGREE_C = "#AE3030"
# t=0.35 (less blending) improves visual separation from the neutral gray
DISAGREE_C = _lerp_hex("#AE3030", INK_MUTED_FIXED, 0.35)
NEUTRAL_C = INK_MUTED_FIXED
AGREE_C = _lerp_hex(INK_MUTED_FIXED, "#4467A3", 0.5)
STRONGLY_AGREE_C = "#4467A3"

# Colors in series-addition order: N_left, D, SD, N_right, A, SA
CHART_COLORS = (NEUTRAL_C, DISAGREE_C, STRONGLY_DISAGREE_C, NEUTRAL_C, AGREE_C, STRONGLY_AGREE_C)


# Data — employee engagement survey (8 questions, 5-point Likert scale)
questions = [
    "I feel valued at work",
    "My manager provides clear direction",
    "I have opportunities for growth",
    "Work-life balance is supported",
    "I receive fair compensation",
    "Team collaboration is effective",
    "Company vision is inspiring",
    "My contributions are recognized",
]

# Response percentages: (Strongly Disagree, Disagree, Neutral, Agree, Strongly Agree)
responses = [
    (5, 10, 15, 40, 30),
    (8, 15, 20, 35, 22),
    (12, 22, 18, 30, 18),
    (6, 12, 22, 38, 22),
    (22, 30, 18, 20, 10),
    (3, 7, 10, 42, 38),
    (18, 28, 22, 22, 10),
    (7, 14, 16, 38, 25),
]

# Sort ascending by net agreement (most positive renders at top in horizontal chart)
net_scores = [(r[3] + r[4]) - (r[0] + r[1]) for r in responses]
order = sorted(range(len(questions)), key=lambda i: net_scores[i])
questions = [questions[i] for i in order]
responses = [responses[i] for i in order]


# Style — title scaled for length (79 chars vs 67-char baseline → font size 56)
title = "Employee Engagement Survey · bar-diverging-likert · python · pygal · anyplot.ai"
n = len(title)
title_font_size = max(44, round(66 * 67 / n)) if n > 67 else 66

custom_style = Style(
    background=PAGE_BG,
    plot_background=PAGE_BG,
    foreground=INK,
    foreground_strong=INK,
    foreground_subtle=INK_MUTED,
    colors=CHART_COLORS,
    title_font_size=title_font_size,
    label_font_size=56,
    major_label_font_size=44,
    legend_font_size=44,
    value_font_size=30,
    stroke_width=2.5,
)


# Build diverging series (neutral split evenly at center)
neutral_left = [-r[2] / 2 for r in responses]
disagree_vals = [-r[1] for r in responses]
strongly_disagree_vals = [-r[0] for r in responses]
neutral_right = [r[2] / 2 for r in responses]
agree_vals = [r[3] for r in responses]
strongly_agree_vals = [r[4] for r in responses]


# Plot
chart = pygal.HorizontalStackedBar(
    width=3200,
    height=1800,
    style=custom_style,
    title=title,
    show_legend=True,
    legend_at_bottom=True,
    legend_at_bottom_columns=5,
    show_x_guides=False,
    show_y_guides=False,
    print_values=True,
    print_values_position="center",
    value_formatter=lambda x: f"{abs(x):.0f}%" if abs(x) >= 8 else "",
    x_title="Response Percentage (%)",
    margin=50,
    spacing=15,
    truncate_label=-1,
    truncate_legend=-1,
)

# Add series in stacking order (center outward); legend shows N, D, SD, A, SA
chart.add("Neutral", neutral_left)
chart.add("Disagree", disagree_vals)
chart.add("Strongly Disagree", strongly_disagree_vals)
chart.add(None, neutral_right)  # right-half neutral hidden from legend
chart.add("Agree", agree_vals)
chart.add("Strongly Agree", strongly_agree_vals)

chart.x_labels = questions


# SVG post-processing: remove residual guide lines and reorder legend to SD, D, N, A, SA
svg_content = chart.render().decode("utf-8")

svg_content = re.sub(r'<path [^>]*class="(?:major )?(?:axis major )?guide line"[^/]*/>', "", svg_content)

SVG_NS = "http://www.w3.org/2000/svg"
ET.register_namespace("", SVG_NS)
ET.register_namespace("xlink", "http://www.w3.org/1999/xlink")
root = ET.fromstring(svg_content)

# Swap x-positions of serie-0 (Neutral) and serie-2 (Strongly Disagree) legend items
# so legend reads left-to-right: SD | D | N | A | SA
serie_0 = root.find(f'.//{{{SVG_NS}}}g[@id="activate-serie-0"]')
serie_2 = root.find(f'.//{{{SVG_NS}}}g[@id="activate-serie-2"]')
if serie_0 is not None and serie_2 is not None:
    for child_0, child_2 in zip(serie_0, serie_2, strict=False):
        x0, x2 = child_0.get("x"), child_2.get("x")
        if x0 is not None and x2 is not None:
            child_0.set("x", x2)
            child_2.set("x", x0)

svg_content = ET.tostring(root, encoding="unicode")


# Save
cairosvg.svg2png(bytestring=svg_content.encode("utf-8"), write_to=f"plot-{THEME}.png")

with open(f"plot-{THEME}.html", "w") as f:
    f.write(svg_content)
Runnable source as JSON, for any HTTP client: https://api.anyplot.ai/specs/bar-diverging-likert/pygal/code. Any spec id and library id listed in llms-full.txt fit the same URL shape; every URL below is complete and callable.
{
  "spec_id": "bar-diverging-likert",
  "language": "python",
  "library": "pygal",
  "page": "https://anyplot.ai/bar-diverging-likert/python/pygal",
  "hub": "https://anyplot.ai/bar-diverging-likert",
  "code_json": "https://api.anyplot.ai/specs/bar-diverging-likert/pygal/code",
  "spec_json": "https://api.anyplot.ai/specs/bar-diverging-likert",
  "render_light_png": "https://storage.googleapis.com/anyplot-images/plots/bar-diverging-likert/python/pygal/plot-light.png",
  "render_dark_png": "https://storage.googleapis.com/anyplot-images/plots/bar-diverging-likert/python/pygal/plot-dark.png",
  "interactive_light_html": "https://storage.googleapis.com/anyplot-images/plots/bar-diverging-likert/python/pygal/plot-light.html",
  "interactive_dark_html": "https://storage.googleapis.com/anyplot-images/plots/bar-diverging-likert/python/pygal/plot-dark.html",
  "quality_score": 86.0,
  "license": "MIT",
  "guide": "https://anyplot.ai/llms.txt"
}
Part of Likert Scale Diverging Bar Chart on anyplot.ai.