Source code in 15 libraries — Python: Altair, Bokeh, lets-plot, Matplotlib, Plotly, plotnine, Pygal, Seaborn; R: ggplot2; Julia: Makie.jl; JavaScript: Chart.js, D3.js, Apache ECharts, Highcharts, MUI X Charts.
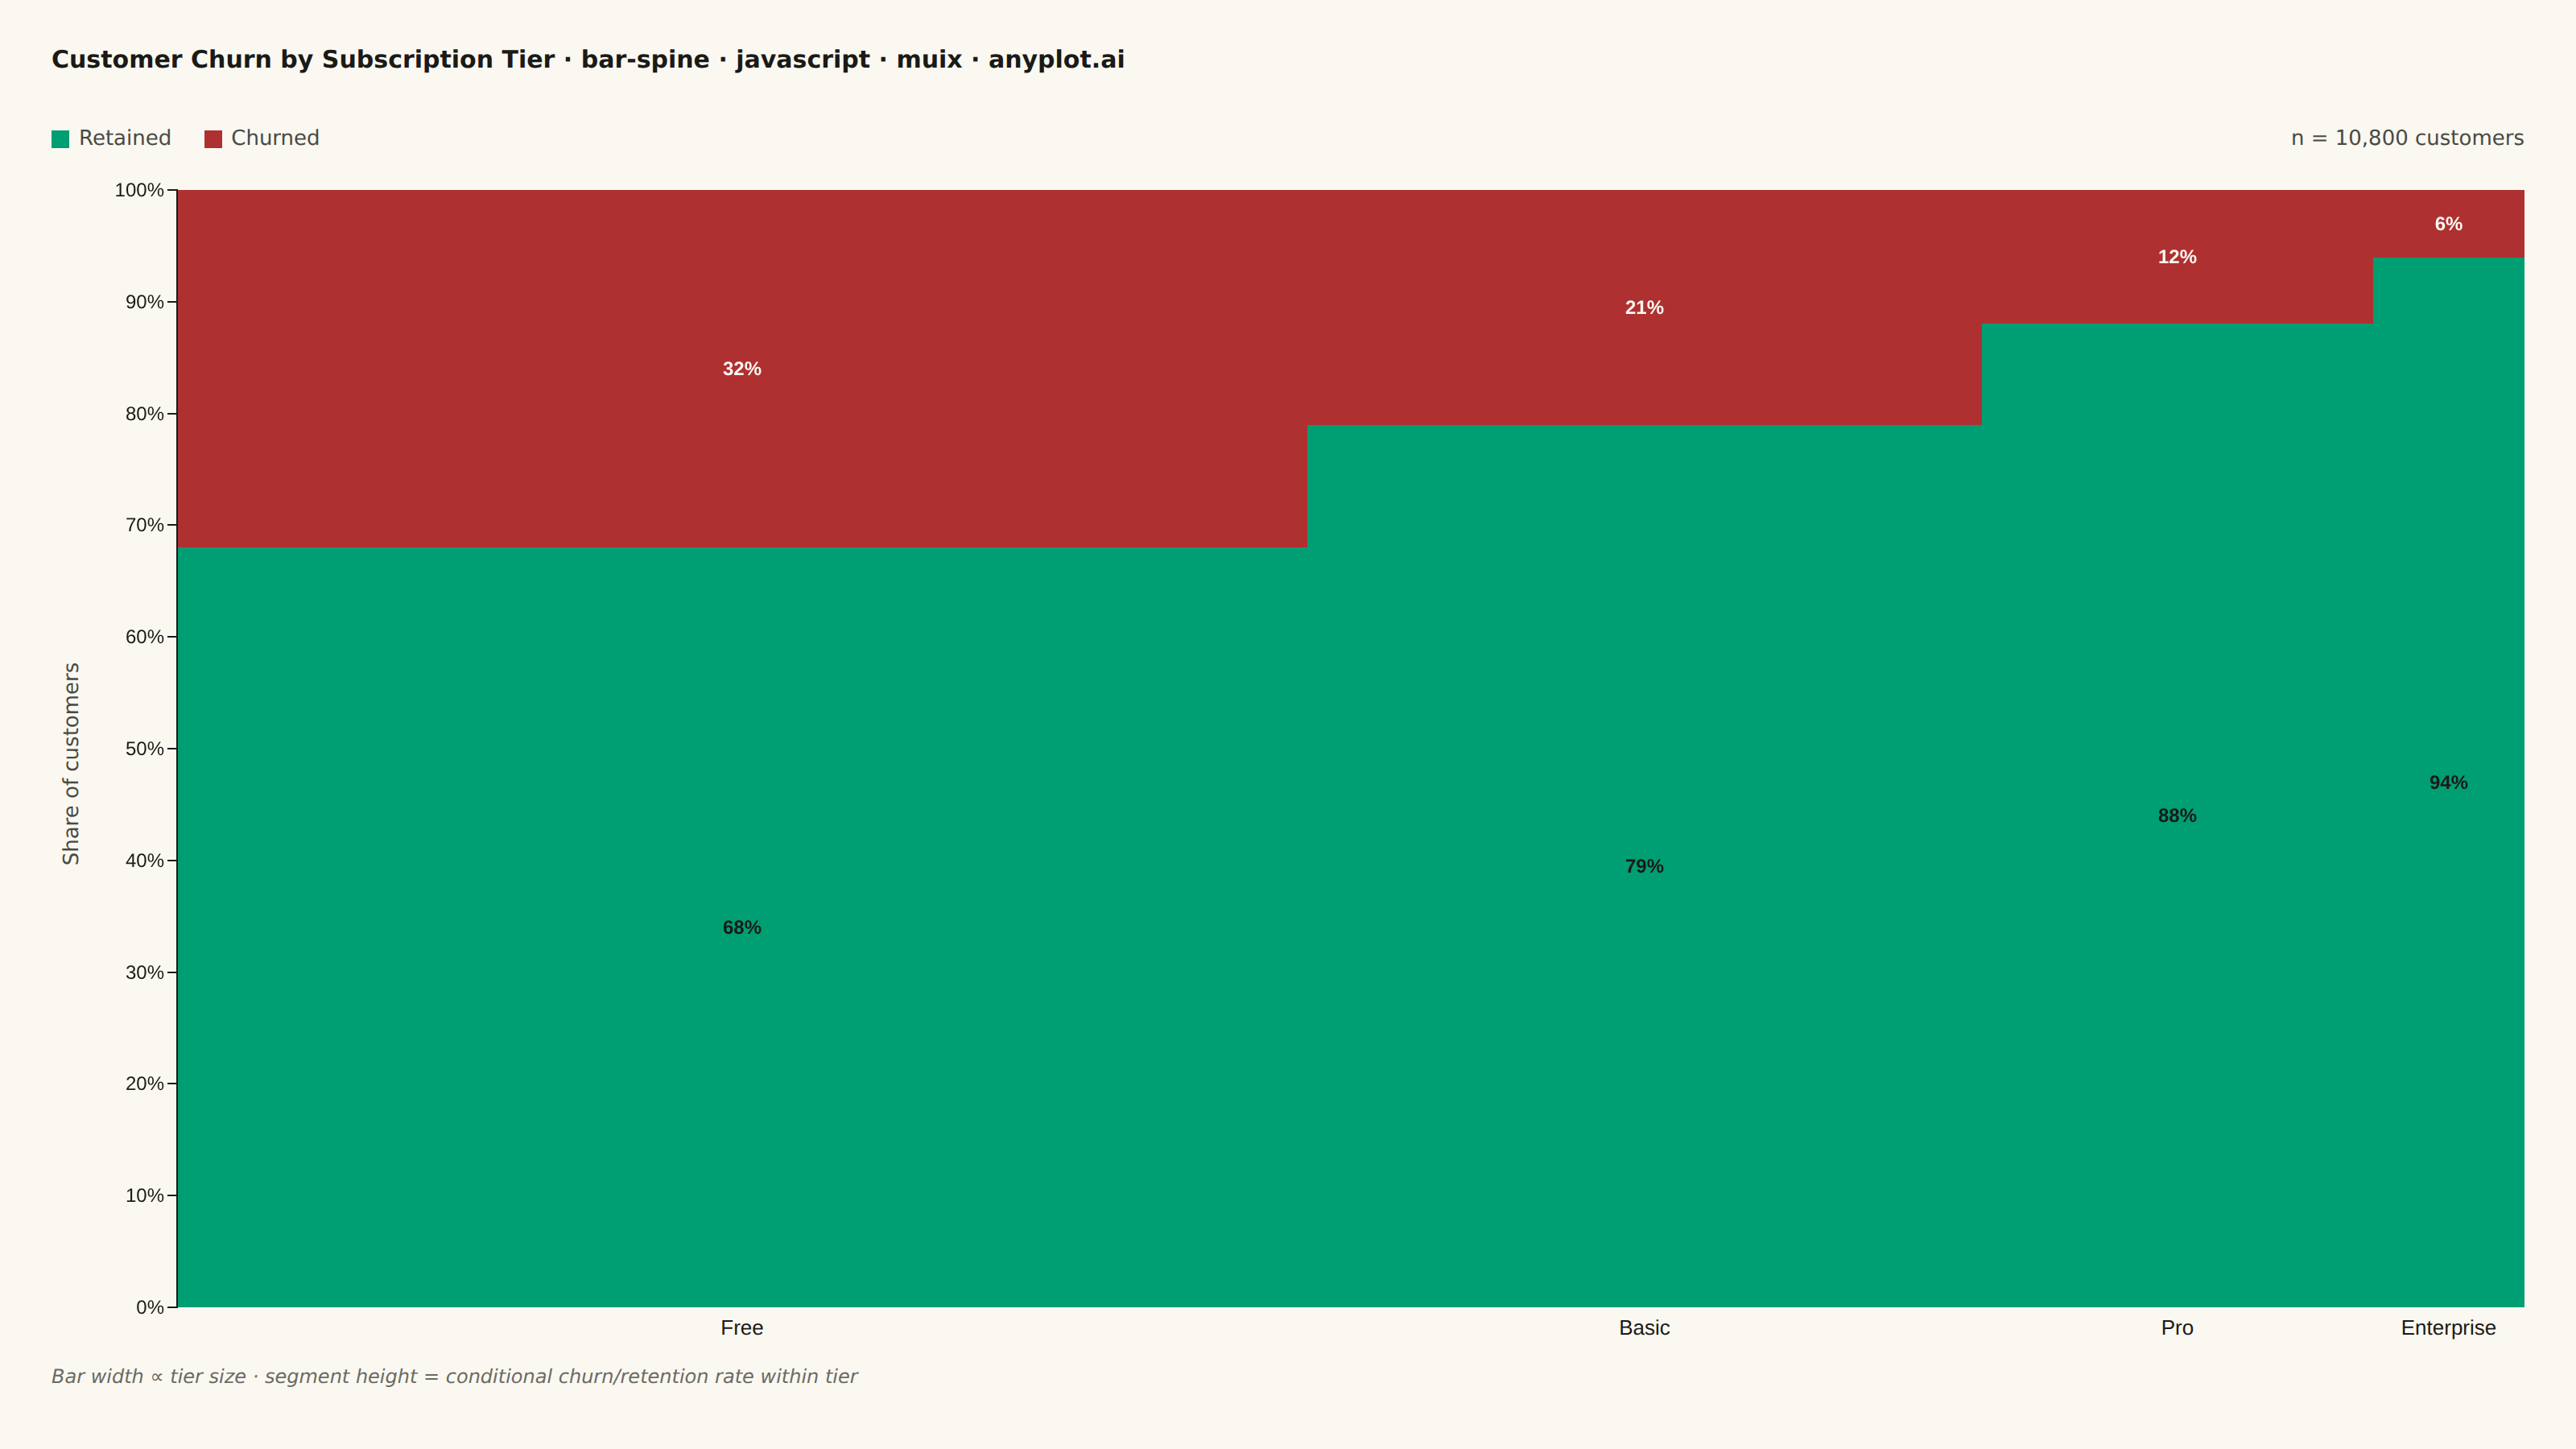
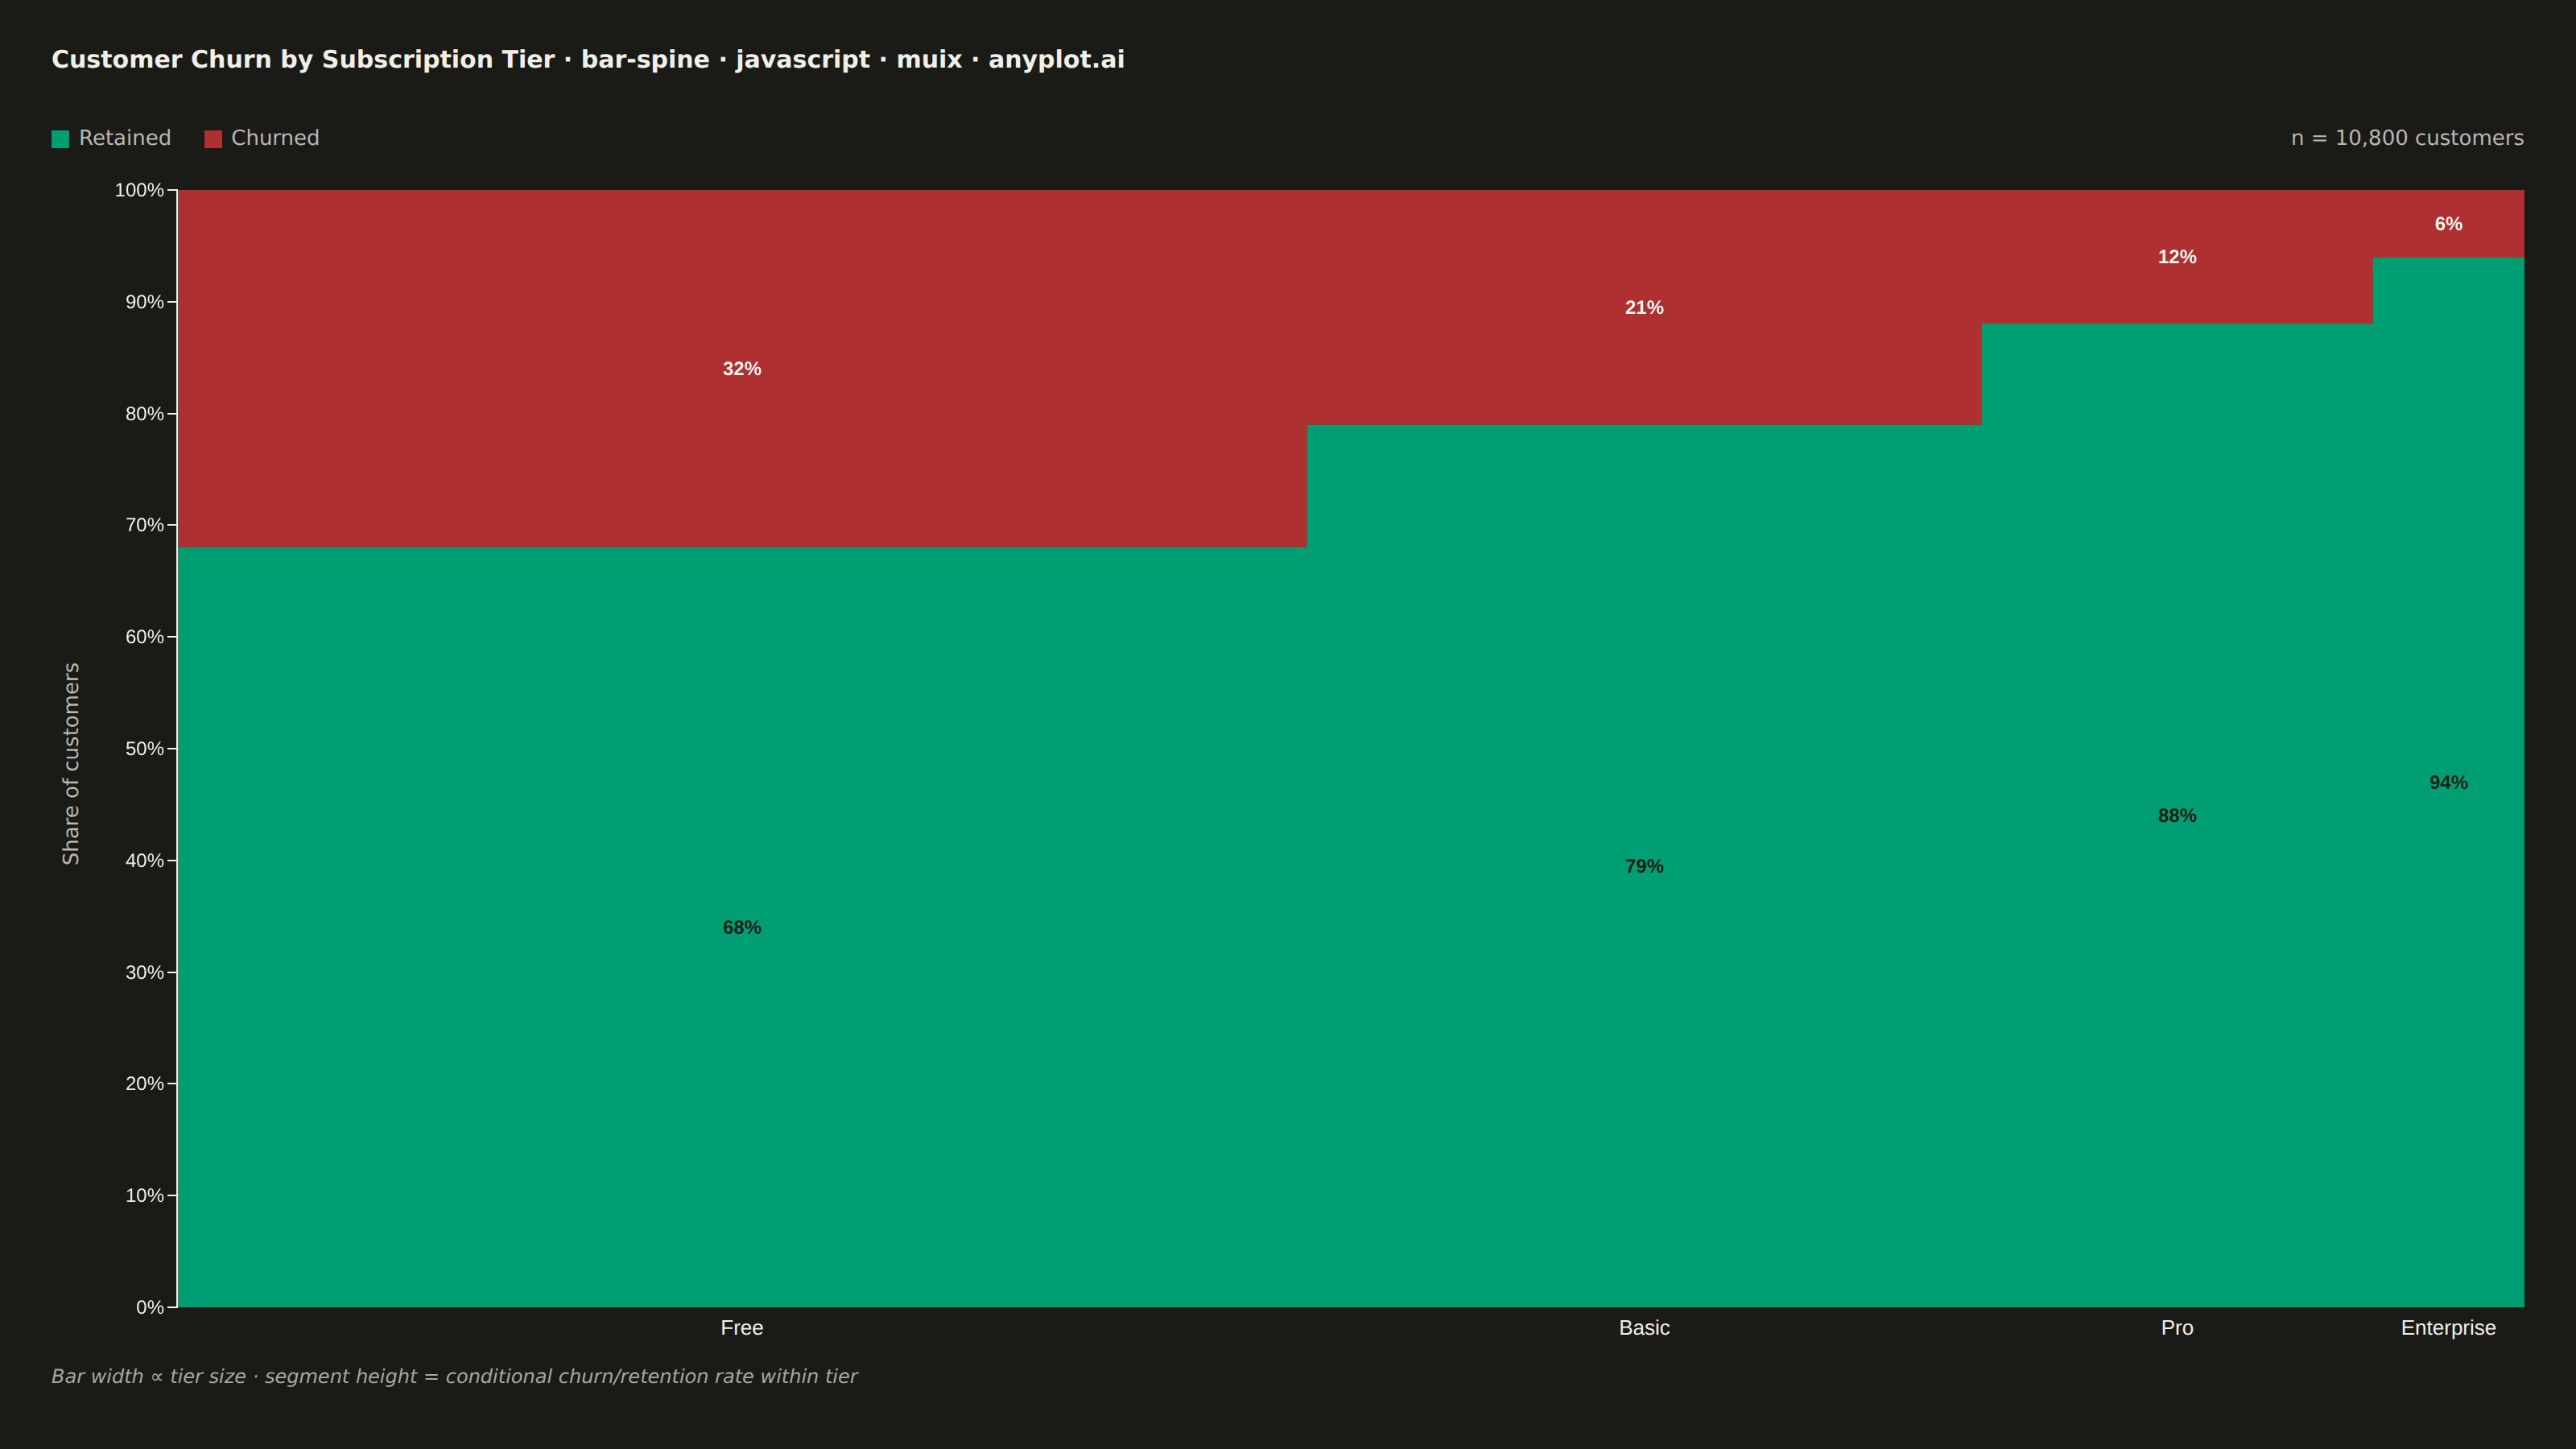
A spine plot (spineplot) is a stacked bar chart where bar widths are proportional to the marginal frequency of one categorical variable and the subdivisions within each bar show the conditional distribution of a second categorical variable. All bars are normalized to the same height (100%), so visual comparison focuses on how the conditional proportions shift across categories. It is a one-dimensional specialization of mosaic plots and excels at revealing associations between two categorical variables in contingency table data.
Preview render from the MUI X Charts implementation.