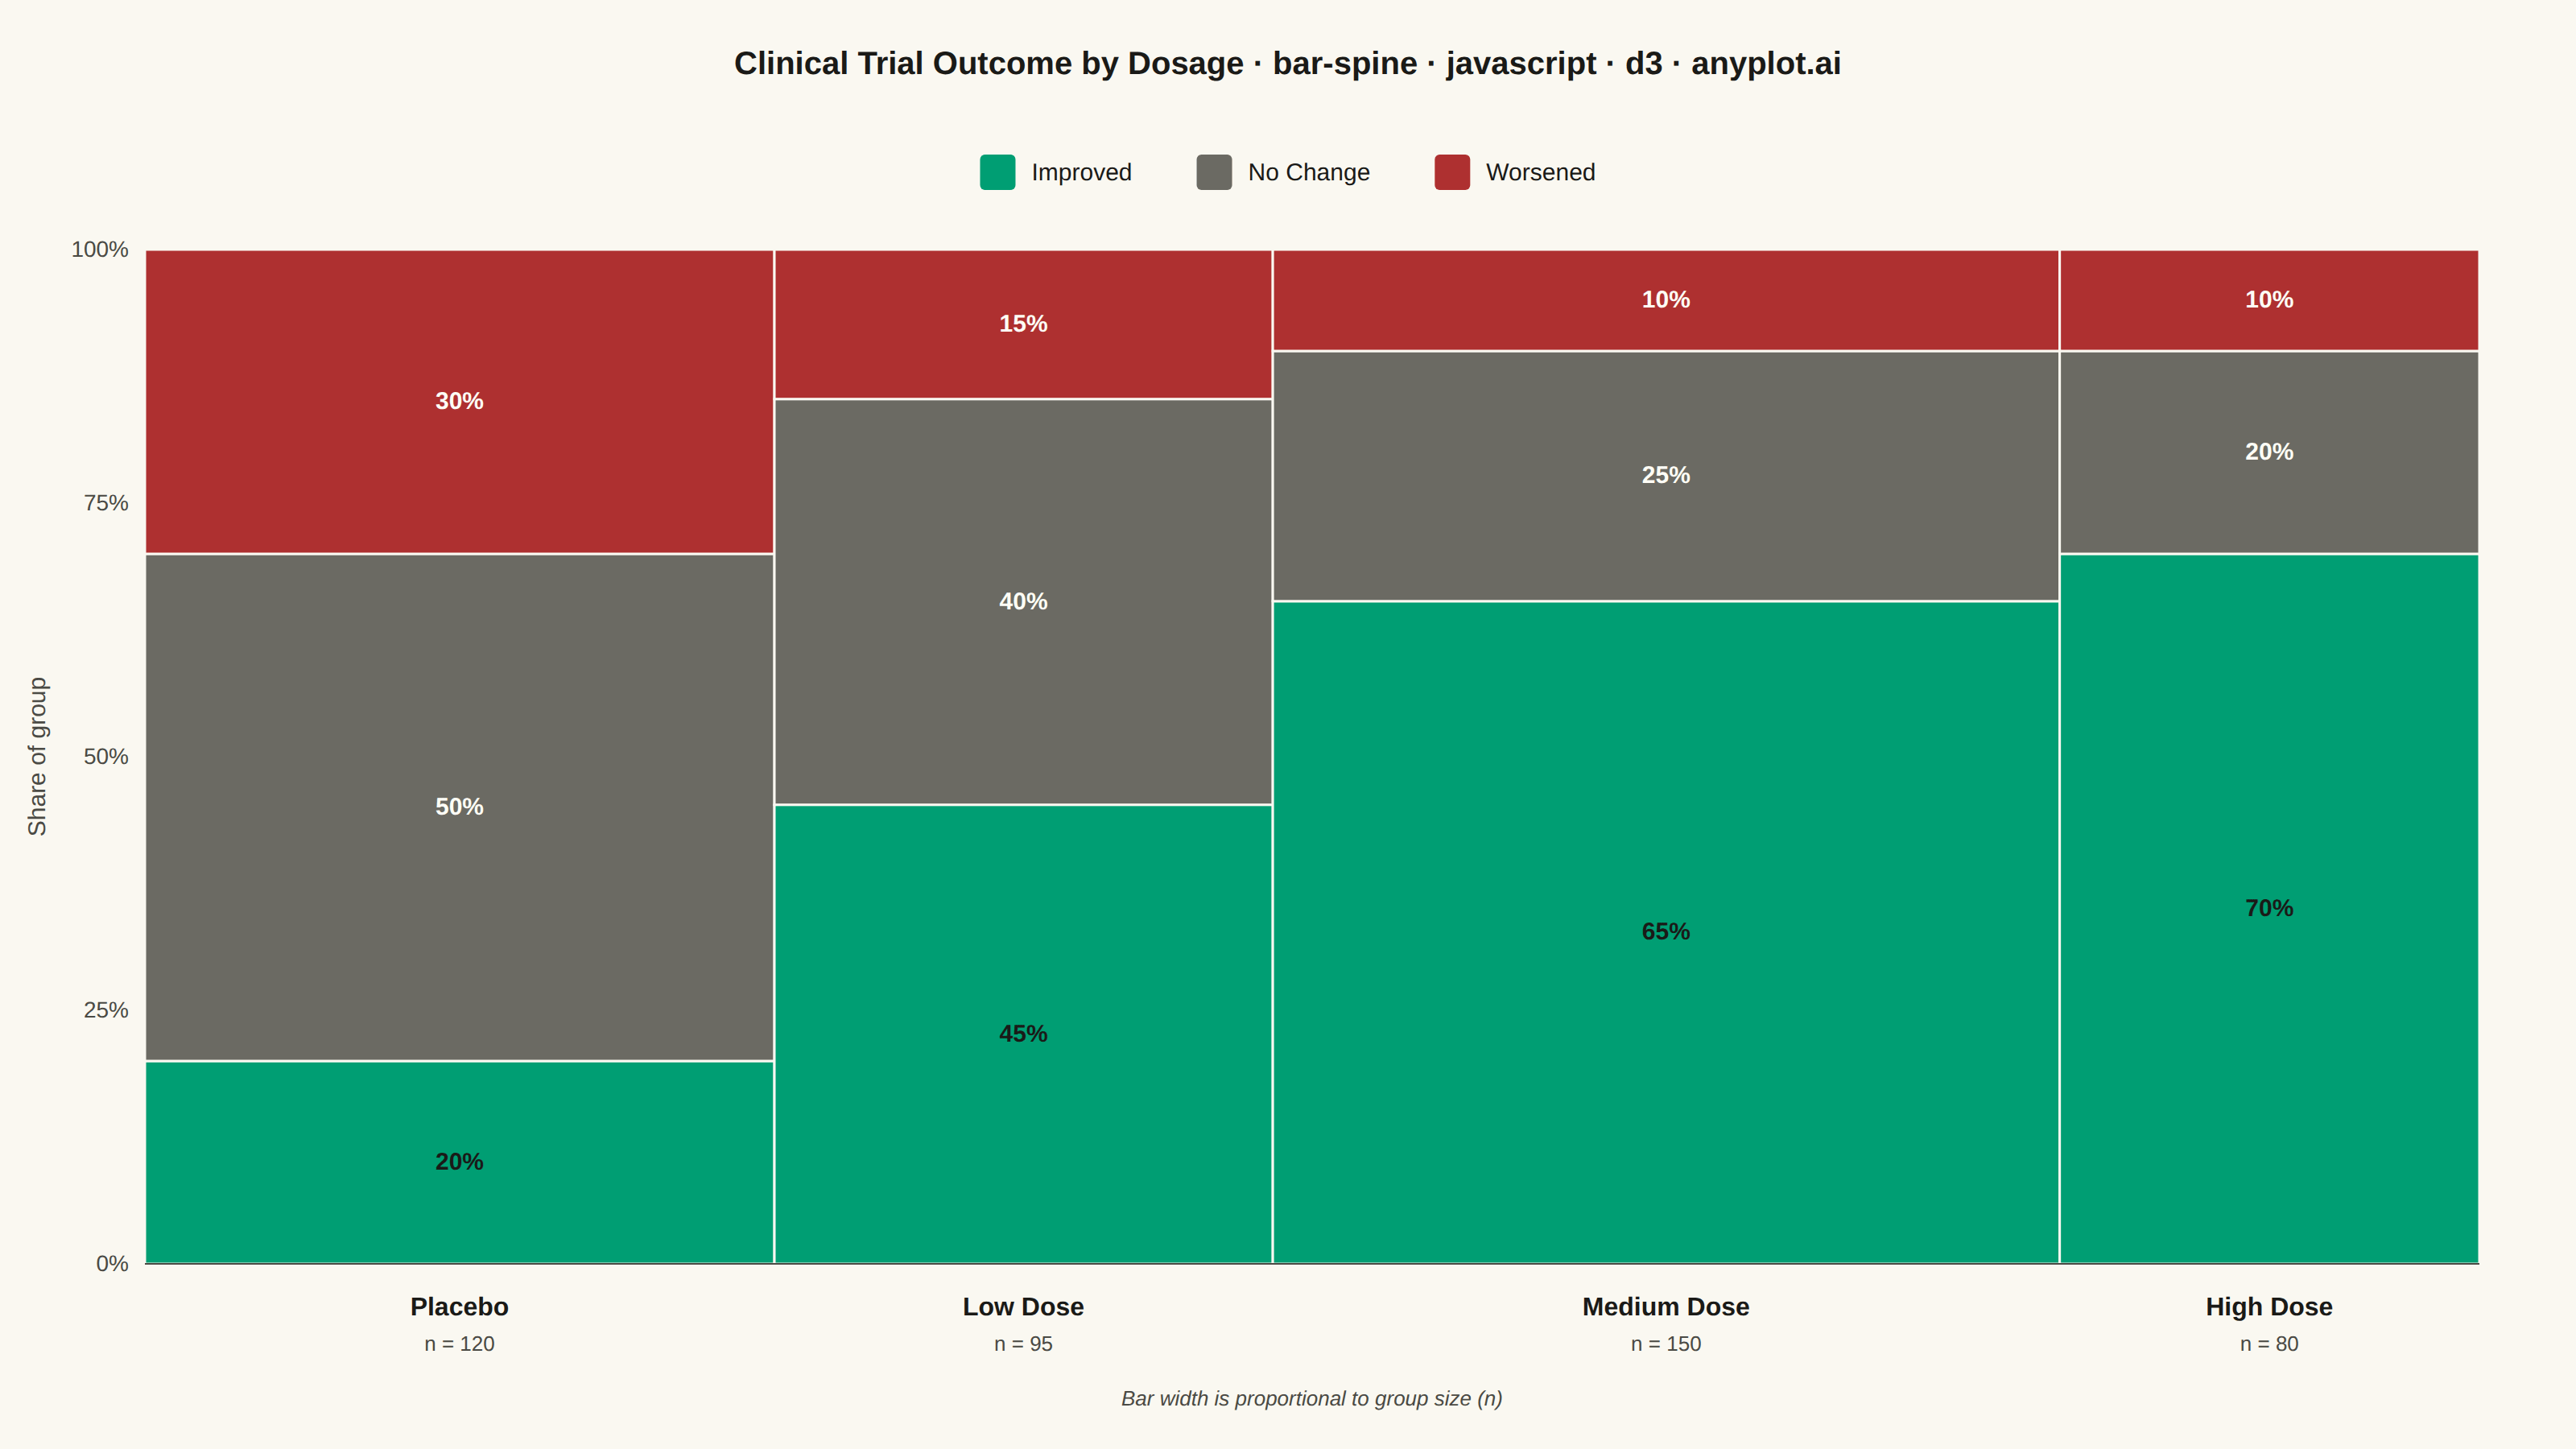
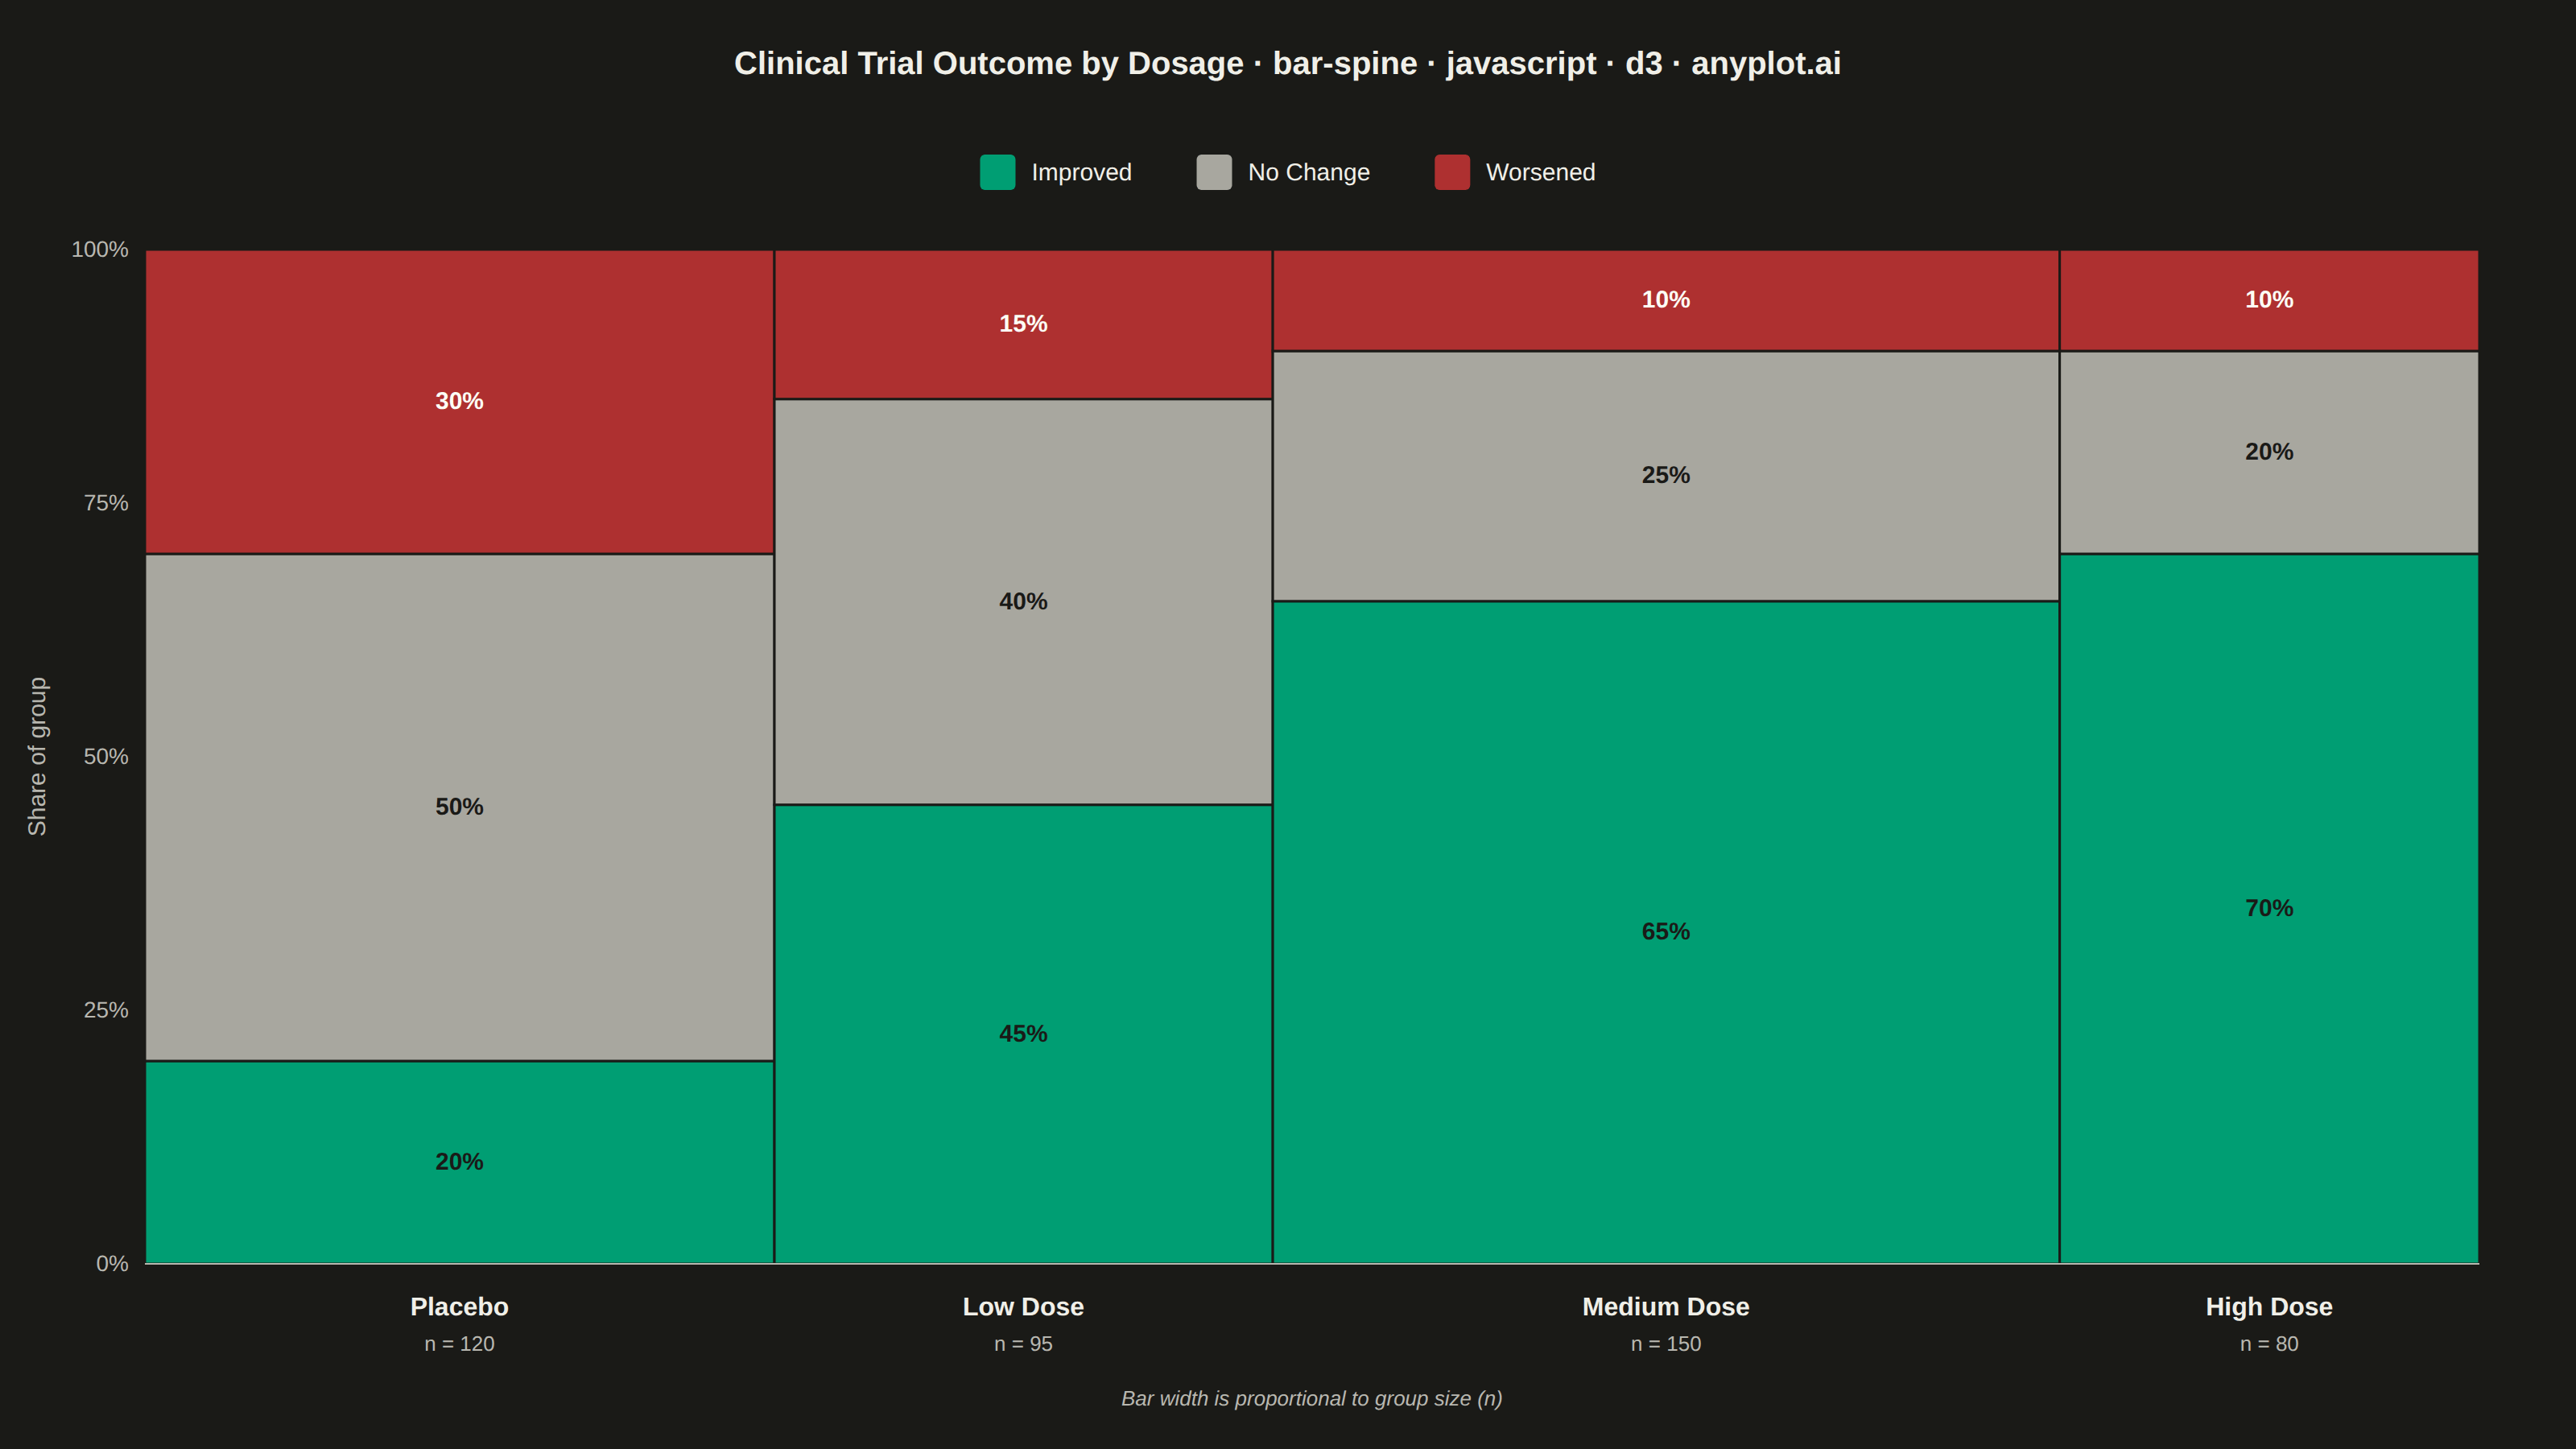
The same plot in 14 other libraries — JavaScript: Chart.js, Apache ECharts, Highcharts, MUI X Charts; Python: Altair, Bokeh, lets-plot, Matplotlib, Plotly, plotnine, Pygal, Seaborn; R: ggplot2; Julia: Makie.jl. Compare all 15 side by side: Spine Plot for Two-Variable Proportions in Python, R, Julia and JavaScript.
A spine plot (spineplot) is a stacked bar chart where bar widths are proportional to the marginal frequency of one categorical variable and the subdivisions within each bar show the conditional distribution of a second categorical variable. All bars are normalized to the same height (100%), so visual comparison focuses on how the conditional proportions shift across categories. It is a one-dimensional specialization of mosaic plots and excels at revealing associations between two categorical variables in contingency table data.
// anyplot.ai
// bar-spine: Spine Plot for Two-Variable Proportions
// Library: d3 7.9.0 | JavaScript 22.23.2
// Quality: 92/100 | Updated: 2026-09-27

const t = window.ANYPLOT_TOKENS;
const { width, height } = window.ANYPLOT_SIZE;

// Theme-adaptive muted anchor (not shipped in ANYPLOT_TOKENS — see default-style-guide.md)
const MUTED = t.theme === "dark" ? "#A8A79F" : "#6B6A63";
const LIGHT_TXT = "#FFFDF6";
const DARK_TXT = "#1A1A17";

// --- WCAG contrast helpers (pick readable in-segment label color) -----------
const luminance = (hex) => {
  const c = hex.replace("#", "");
  const [r, g, b] = [0, 2, 4].map((i) => parseInt(c.substr(i, 2), 16) / 255);
  const lin = (v) => (v <= 0.04045 ? v / 12.92 : Math.pow((v + 0.055) / 1.055, 2.4));
  return 0.2126 * lin(r) + 0.7152 * lin(g) + 0.0722 * lin(b);
};
const contrast = (hexA, hexB) => {
  const [la, lb] = [luminance(hexA), luminance(hexB)];
  const [hi, lo] = la > lb ? [la, lb] : [lb, la];
  return (hi + 0.05) / (lo + 0.05);
};
const textColorFor = (bgHex) =>
  contrast(bgHex, DARK_TXT) >= contrast(bgHex, LIGHT_TXT) ? DARK_TXT : LIGHT_TXT;

// --- Data: clinical trial outcome by dosage group (in-memory, deterministic) -
const data = [
  { category: "Placebo", n: 120, counts: { Improved: 24, "No Change": 60, Worsened: 36 } },
  { category: "Low Dose", n: 95, counts: { Improved: 43, "No Change": 38, Worsened: 14 } },
  { category: "Medium Dose", n: 150, counts: { Improved: 98, "No Change": 37, Worsened: 15 } },
  { category: "High Dose", n: 80, counts: { Improved: 52, "No Change": 18, Worsened: 10 } },
];

// Improved/No Change/Worsened read as good/neutral/bad — semantic exception (default-style-guide.md)
const fillKeys = ["Improved", "No Change", "Worsened"];
const fillColor = { Improved: t.palette[0], "No Change": MUTED, Worsened: t.palette[4] };

// --- Layout --------------------------------------------------------------
const margin = { top: 155, right: 60, bottom: 115, left: 90 };
const iw = width - margin.left - margin.right;
const ih = height - margin.top - margin.bottom;

// Bar width proportional to marginal count n; segments stacked to 100 % via
// d3.stack's expand offset (exact fractions — no manual cumulative-sum bookkeeping).
const grandTotal = d3.sum(data, (d) => d.n);
const series = d3
  .stack()
  .keys(fillKeys)
  .offset(d3.stackOffsetExpand)(data.map((d) => ({ ...d.counts })));

// Largest-remainder rounding: floor every share, then hand the leftover whole
// points to the segments with the biggest fractional part, so labels always
// sum to exactly 100 instead of drifting to 99/101 under independent rounding.
const roundToHundred = (pcts) => {
  const floors = pcts.map((p) => Math.floor(p));
  const leftover = 100 - d3.sum(floors);
  const order = pcts
    .map((p, i) => ({ i, frac: p - floors[i] }))
    .sort((a, b) => b.frac - a.frac);
  const rounded = floors.slice();
  for (let k = 0; k < leftover; k++) rounded[order[k].i] += 1;
  return rounded;
};

let cursor = 0;
const bars = data.map((d, i) => {
  const barWidth = (d.n / grandTotal) * iw;
  const x0 = cursor;
  cursor += barWidth;
  const pcts = fillKeys.map((key) => (d.counts[key] / d.n) * 100);
  const labels = roundToHundred(pcts);
  const segments = fillKeys.map((key, k) => ({
    key,
    pct: pcts[k],
    label: labels[k],
    y0: series[k][i][0] * 100,
    y1: series[k][i][1] * 100,
  }));
  return { ...d, x0, barWidth, segments };
});

const y = d3.scaleLinear().domain([0, 100]).range([ih, 0]);

// --- SVG mount -------------------------------------------------------------
const svg = d3.select("#container").append("svg").attr("width", width).attr("height", height);
const g = svg.append("g").attr("transform", `translate(${margin.left},${margin.top})`);

// --- Y-axis (cumulative share) + gridlines ----------------------------------
const yAxis = g
  .append("g")
  .call(
    d3
      .axisLeft(y)
      .tickValues([0, 25, 50, 75, 100])
      .tickFormat((v) => `${v}%`)
      .tickSize(-iw)
  );
yAxis.selectAll("text").attr("fill", t.inkSoft).style("font-size", "14px").attr("x", -10);
yAxis.selectAll("line").attr("stroke", t.grid).attr("stroke-width", 1);
yAxis.select(".domain").remove();

g.append("text")
  .attr("x", -ih / 2)
  .attr("y", -62)
  .attr("transform", "rotate(-90)")
  .attr("text-anchor", "middle")
  .attr("fill", t.inkSoft)
  .style("font-size", "15px")
  .text("Share of group");

// --- Spine bars --------------------------------------------------------------
const barGroups = g
  .selectAll(".bar")
  .data(bars)
  .join("g")
  .attr("transform", (d) => `translate(${d.x0},0)`);

// Segments + in-segment percentage labels (barWidth is per-group, so both are
// drawn together in one pass over the bound bar datum).
barGroups.each(function (bar) {
  const group = d3.select(this);
  group
    .selectAll("rect")
    .data(bar.segments)
    .join("rect")
    .attr("x", 0)
    .attr("y", (seg) => y(seg.y1))
    .attr("width", bar.barWidth)
    .attr("height", (seg) => y(seg.y0) - y(seg.y1))
    .attr("fill", (seg) => fillColor[seg.key])
    .attr("stroke", t.pageBg)
    .attr("stroke-width", 1.5);

  bar.segments.forEach((seg) => {
    const segHeight = y(seg.y0) - y(seg.y1);
    if (bar.barWidth < 50) return;
    // Graceful degradation for thin bands: shrink the label one step before
    // suppressing it outright, rather than jumping straight from 15px to gone.
    const fontSize = segHeight >= 34 ? 15 : segHeight >= 22 ? 12 : null;
    if (fontSize === null) return;
    group
      .append("text")
      .attr("x", bar.barWidth / 2)
      .attr("y", (y(seg.y1) + y(seg.y0)) / 2)
      .attr("text-anchor", "middle")
      .attr("dominant-baseline", "central")
      .attr("fill", textColorFor(fillColor[seg.key]))
      .style("font-size", `${fontSize}px`)
      .style("font-weight", "600")
      .text(`${seg.label}%`);
  });
});

// Baseline under the bars.
g.append("line")
  .attr("x1", 0)
  .attr("x2", iw)
  .attr("y1", ih)
  .attr("y2", ih)
  .attr("stroke", t.inkSoft)
  .attr("stroke-width", 1);

// --- X-axis: category name + group size, centered under each variable-width bar
barGroups.each(function (bar) {
  const group = d3.select(this);
  const cx = bar.barWidth / 2;
  group
    .append("text")
    .attr("x", cx)
    .attr("y", ih + 32)
    .attr("text-anchor", "middle")
    .attr("fill", t.ink)
    .style("font-size", "16px")
    .style("font-weight", "600")
    .text(bar.category);
  group
    .append("text")
    .attr("x", cx)
    .attr("y", ih + 54)
    .attr("text-anchor", "middle")
    .attr("fill", t.inkSoft)
    .style("font-size", "13px")
    .text(`n = ${bar.n}`);
});

g.append("text")
  .attr("x", iw / 2)
  .attr("y", ih + 88)
  .attr("text-anchor", "middle")
  .attr("fill", t.inkSoft)
  .style("font-size", "13px")
  .style("font-style", "italic")
  .text("Bar width is proportional to group size (n)");

// --- Legend (measured with getBBox for exact centering) ---------------------
const legend = svg.append("g");
const legendItems = fillKeys.map((key) => {
  const item = legend.append("g");
  item
    .append("rect")
    .attr("width", 22)
    .attr("height", 22)
    .attr("rx", 3)
    .attr("fill", fillColor[key]);
  item
    .append("text")
    .attr("x", 32)
    .attr("y", 16)
    .attr("fill", t.ink)
    .style("font-size", "15px")
    .text(key);
  return { node: item, width: item.node().getBBox().width };
});
const gap = 40;
const legendWidth = d3.sum(legendItems, (d) => d.width) + gap * (legendItems.length - 1);
let lx = (width - legendWidth) / 2;
legendItems.forEach((d) => {
  d.node.attr("transform", `translate(${lx},96)`);
  lx += d.width + gap;
});

// --- Title -------------------------------------------------------------------
const titleText = "Clinical Trial Outcome by Dosage · bar-spine · javascript · d3 · anyplot.ai";
const titleFontSize = Math.max(14, Math.round(22 * Math.min(1, 67 / titleText.length)));
svg
  .append("text")
  .attr("x", width / 2)
  .attr("y", 46)
  .attr("text-anchor", "middle")
  .attr("fill", t.ink)
  .style("font-size", `${titleFontSize}px`)
  .style("font-weight", "600")
  .text(titleText);
Runnable source as JSON, for any HTTP client: https://api.anyplot.ai/specs/bar-spine/d3/code. Any spec id and library id listed in llms-full.txt fit the same URL shape; every URL below is complete and callable.
{
  "spec_id": "bar-spine",
  "language": "javascript",
  "library": "d3",
  "page": "https://anyplot.ai/bar-spine/javascript/d3",
  "hub": "https://anyplot.ai/bar-spine",
  "code_json": "https://api.anyplot.ai/specs/bar-spine/d3/code",
  "spec_json": "https://api.anyplot.ai/specs/bar-spine",
  "render_light_png": "https://storage.googleapis.com/anyplot-images/plots/bar-spine/javascript/d3/plot-light.png",
  "render_dark_png": "https://storage.googleapis.com/anyplot-images/plots/bar-spine/javascript/d3/plot-dark.png",
  "interactive_light_html": "https://storage.googleapis.com/anyplot-images/plots/bar-spine/javascript/d3/plot-light.html",
  "interactive_dark_html": "https://storage.googleapis.com/anyplot-images/plots/bar-spine/javascript/d3/plot-dark.html",
  "quality_score": 92.0,
  "license": "MIT",
  "guide": "https://anyplot.ai/llms.txt"
}
Part of Spine Plot for Two-Variable Proportions on anyplot.ai.