The same plot in 14 other libraries — Python: Altair, Bokeh, lets-plot, Matplotlib, Plotly, plotnine, Pygal, Seaborn; R: ggplot2; JavaScript: Chart.js, D3.js, Apache ECharts, Highcharts, MUI X Charts. Compare all 15 side by side: Spine Plot for Two-Variable Proportions in Python, R, Julia and JavaScript.
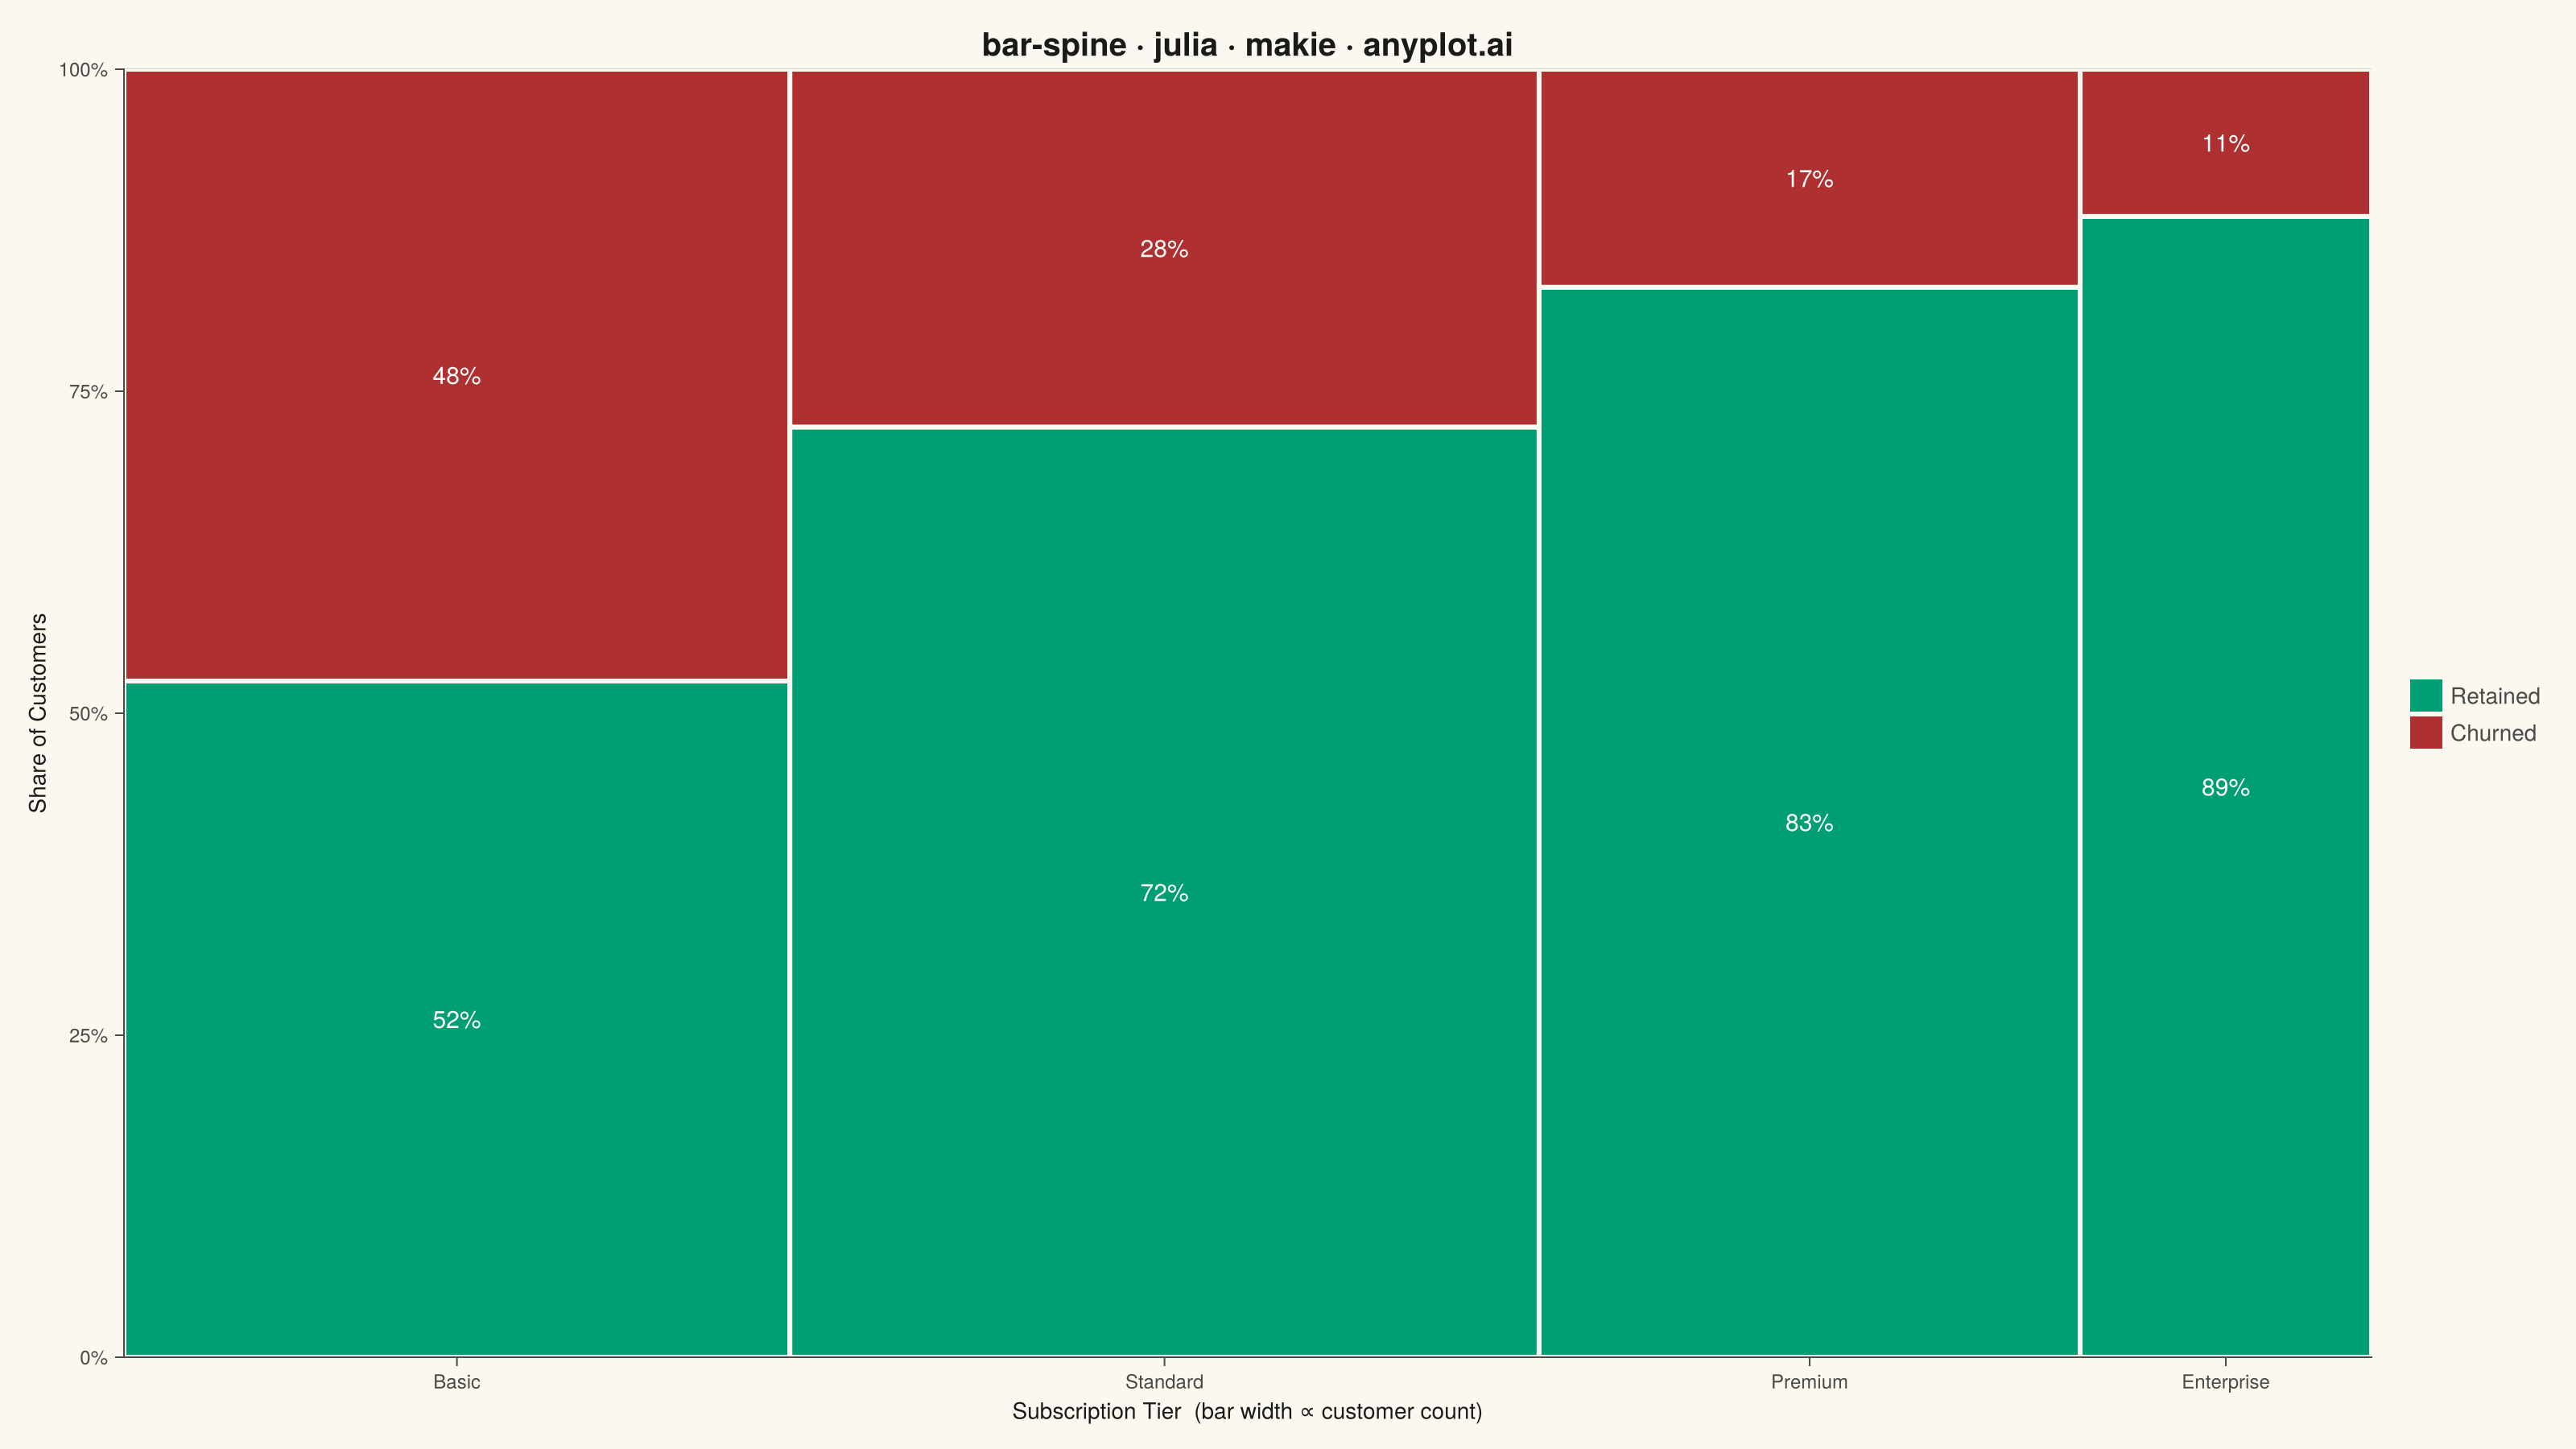
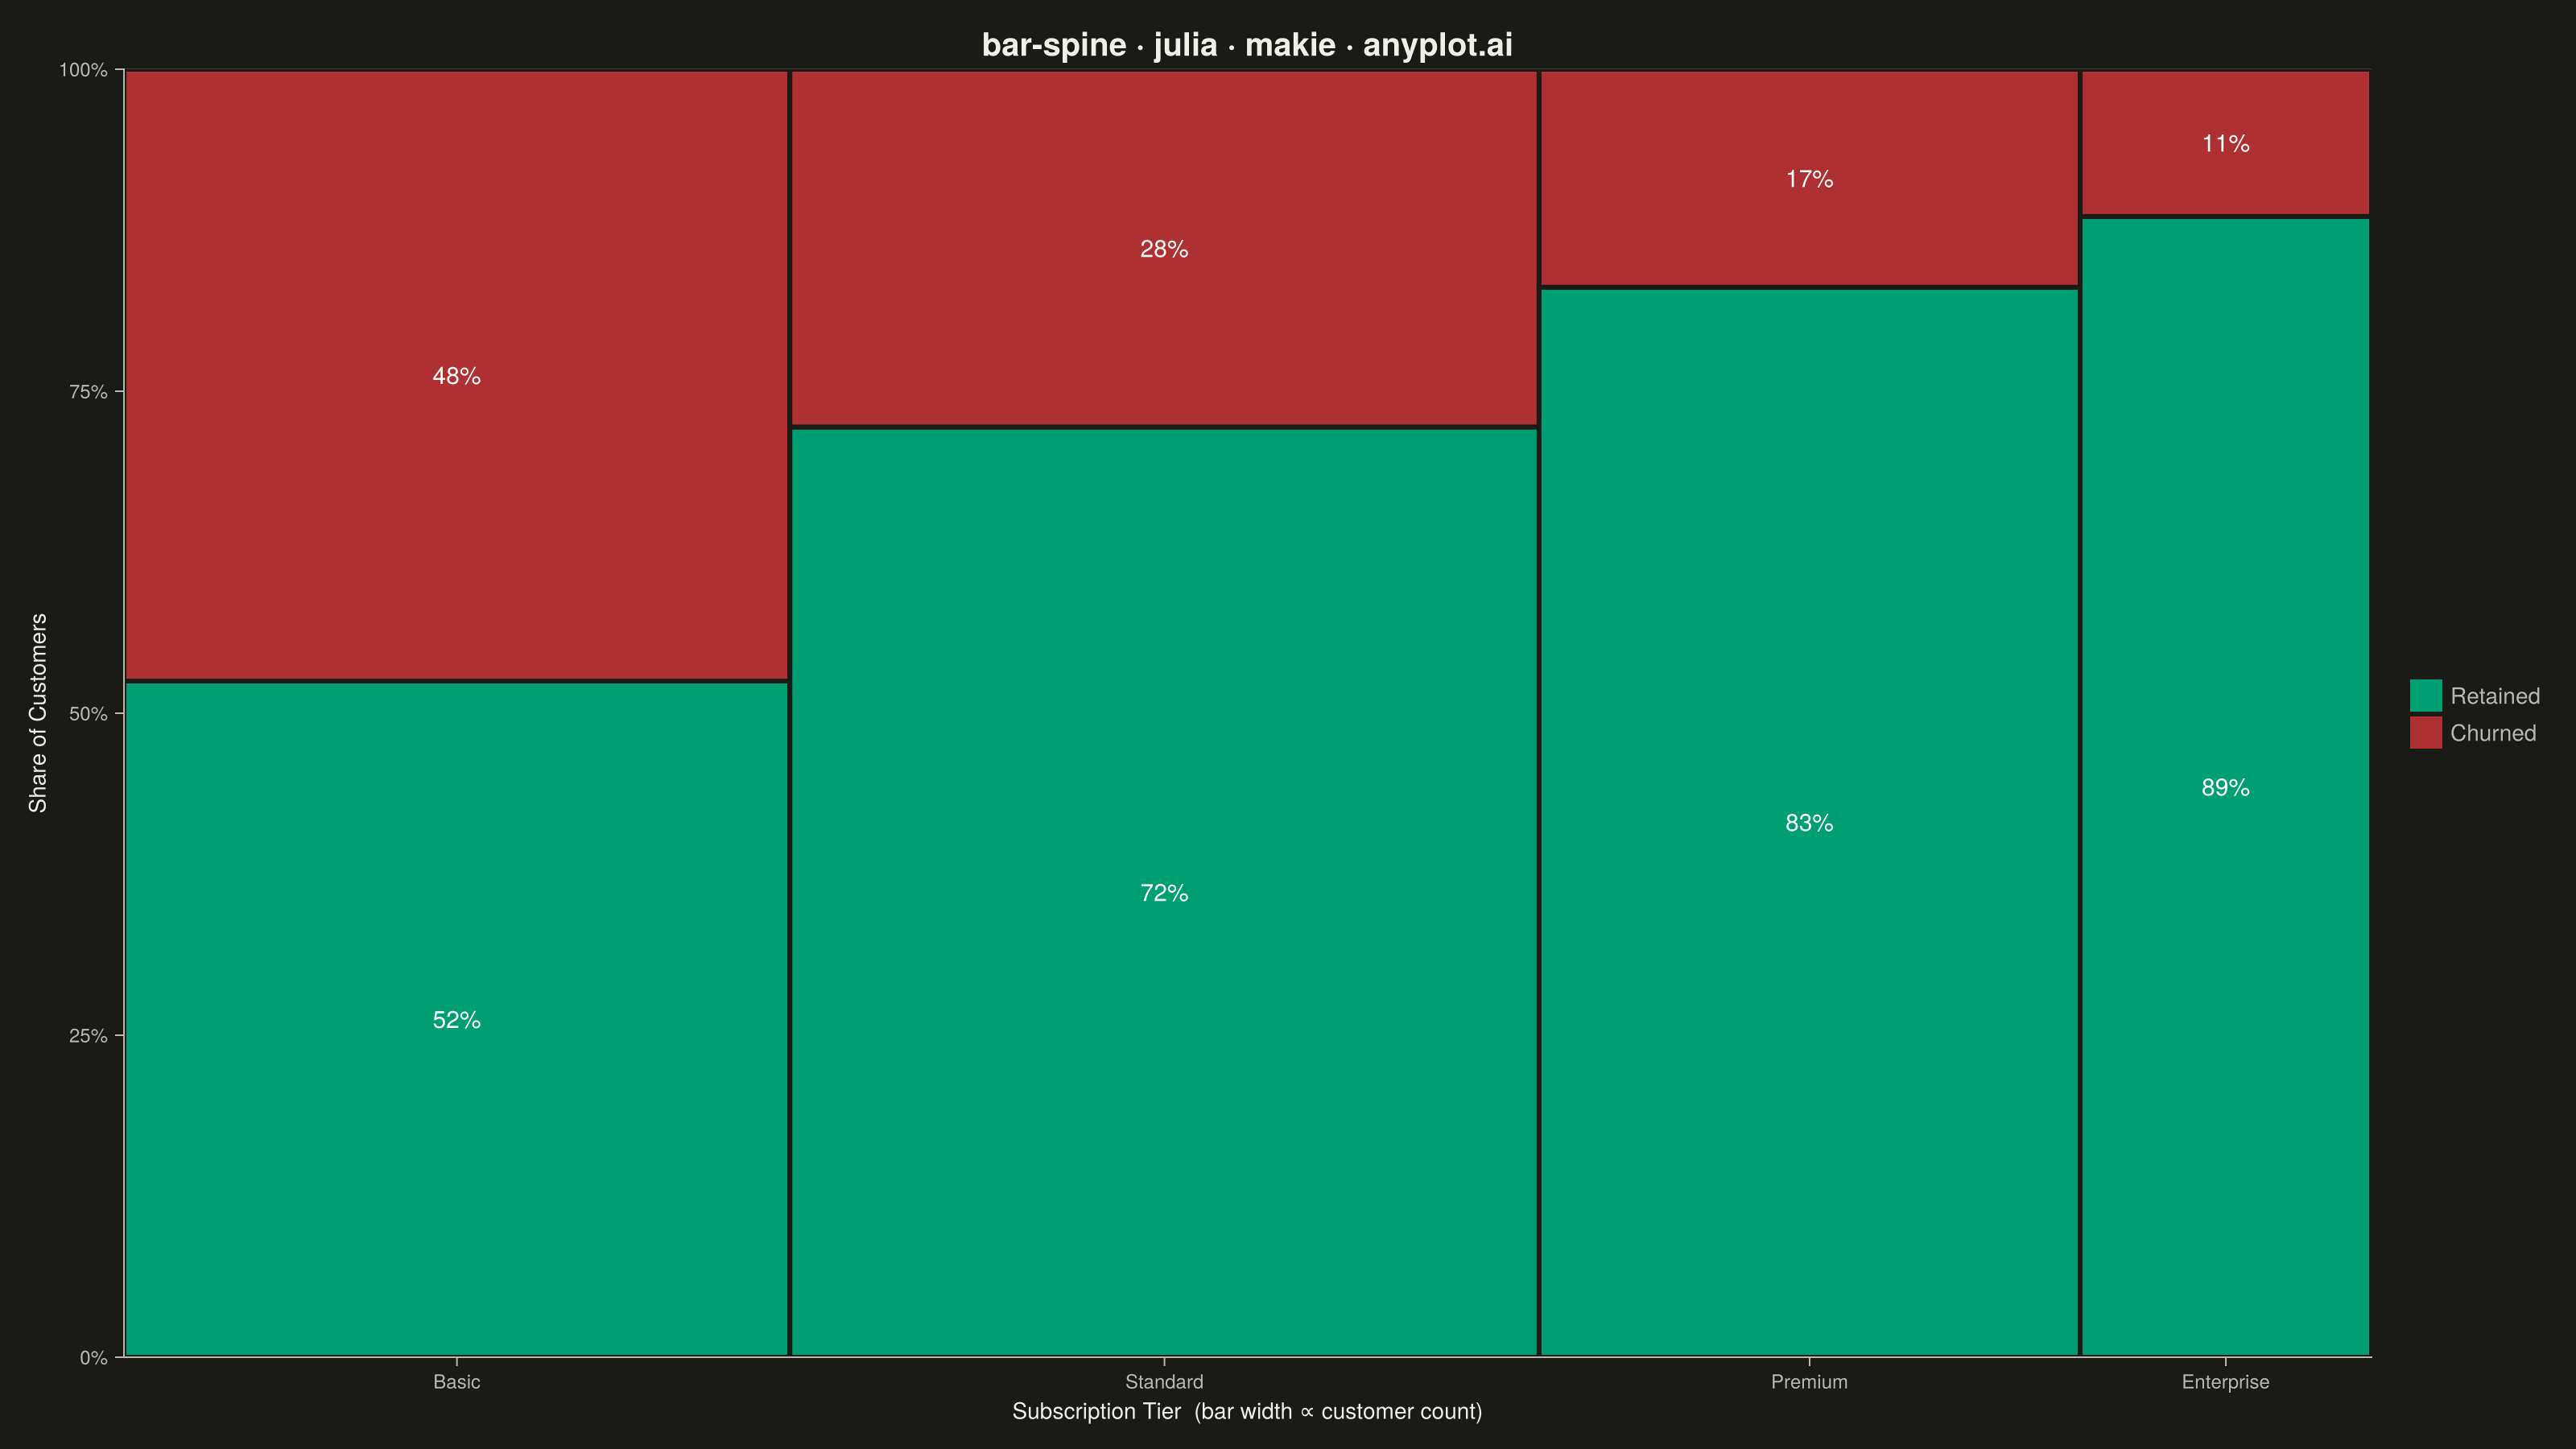
A spine plot (spineplot) is a stacked bar chart where bar widths are proportional to the marginal frequency of one categorical variable and the subdivisions within each bar show the conditional distribution of a second categorical variable. All bars are normalized to the same height (100%), so visual comparison focuses on how the conditional proportions shift across categories. It is a one-dimensional specialization of mosaic plots and excels at revealing associations between two categorical variables in contingency table data.
# anyplot.ai
# bar-spine: Spine Plot for Two-Variable Proportions
# Library: makie 0.21.9 | Julia 1.11.9
# Quality: 93/100 | Updated: 2026-09-27

using CairoMakie
using Colors

# --- Theme tokens -------------------------------------------------------------
const THEME    = get(ENV, "ANYPLOT_THEME", "light")
const PAGE_BG  = THEME == "light" ? colorant"#FAF8F1" : colorant"#1A1A17"
const INK      = THEME == "light" ? colorant"#1A1A17" : colorant"#F0EFE8"
const INK_SOFT = THEME == "light" ? colorant"#4A4A44" : colorant"#B8B7B0"

# Imprint palette — semantic exception applies: retained/churned is a
# good/bad pair the legend labels explicitly, so green/red replace the
# ordinal 1st/2nd slots (see default-style-guide.md "Semantic exception").
const RETAINED_COLOR = colorant"#009E73"  # good outcome — brand green
const CHURNED_COLOR  = colorant"#AE3030"  # bad outcome — matte red anchor
const CHURNED_HATCH  = RGB(0.6 * CHURNED_COLOR.r, 0.6 * CHURNED_COLOR.g, 0.6 * CHURNED_COLOR.b)

# Churned segments carry a diagonal hatch on top of the red fill — a
# CairoMakie-native `Pattern` texture, not achievable as a plain `color=`
# in most static libraries — so the bad-outcome/good-outcome distinction
# survives red-green color-vision deficiency, not just hue.
const CHURNED_FILL = Makie.Pattern('/', linecolor = CHURNED_HATCH, background_color = CHURNED_COLOR,
                                    width = 2, tilesize = (14, 14))

# --- Data -----------------------------------------------------------------
# Customer churn by subscription tier: bar width = tier size (marginal
# count), segment heights = conditional retained/churned proportions.
tiers            = ["Basic", "Standard", "Premium", "Enterprise"]
retained_counts  = [420, 650, 540, 310]
churned_counts   = [380, 250, 110, 40]
tier_totals      = retained_counts .+ churned_counts
retained_frac    = retained_counts ./ tier_totals

edges   = vcat(0, cumsum(tier_totals))
lefts   = edges[1:end-1]
rights  = edges[2:end]
centers = (lefts .+ rights) ./ 2

# --- Plot -------------------------------------------------------------------
fig = Figure(
    size            = (1600, 900),
    fontsize        = 14,
    backgroundcolor = PAGE_BG,
)

ax = Axis(
    fig[1, 1];
    title              = "SaaS Subscription Churn · bar-spine · julia · makie · anyplot.ai",
    titlesize          = 20,
    titlecolor         = INK,
    xlabel             = "Subscription Tier  (bar width ∝ customer count)",
    ylabel             = "Share of Customers",
    xlabelsize         = 14,
    ylabelsize         = 14,
    xlabelcolor        = INK,
    ylabelcolor        = INK,
    xticklabelsize     = 12,
    yticklabelsize     = 12,
    xticklabelcolor    = INK_SOFT,
    yticklabelcolor    = INK_SOFT,
    xtickcolor         = INK_SOFT,
    ytickcolor         = INK_SOFT,
    backgroundcolor    = PAGE_BG,
    topspinevisible    = false,
    rightspinevisible  = false,
    leftspinecolor     = INK_SOFT,
    bottomspinecolor   = INK_SOFT,
    xgridvisible       = false,
    ygridcolor         = RGBAf(INK.r, INK.g, INK.b, 0.15),
    xticks             = (centers, tiers),
    yticks             = (0:0.25:1, ["0%", "25%", "50%", "75%", "100%"]),
)
xlims!(ax, 0, edges[end])
ylims!(ax, 0, 1)

for i in eachindex(tiers)
    left, right, split = lefts[i], rights[i], retained_frac[i]

    poly!(ax, Rect2f(left, 0, right - left, split);
          color = RETAINED_COLOR, strokecolor = PAGE_BG, strokewidth = 3)
    poly!(ax, Rect2f(left, split, right - left, 1 - split);
          color = CHURNED_FILL, strokecolor = PAGE_BG, strokewidth = 3)

    text!(ax, (left + right) / 2, split / 2;
          text = "$(round(Int, split * 100))%", align = (:center, :center),
          color = :white, fontsize = 15)
    text!(ax, (left + right) / 2, split + (1 - split) / 2;
          text = "$(round(Int, (1 - split) * 100))%", align = (:center, :center),
          color = :white, fontsize = 15)
end

Legend(
    fig[1, 2],
    [PolyElement(color = RETAINED_COLOR), PolyElement(color = CHURNED_FILL)],
    ["Retained", "Churned"];
    labelcolor = INK_SOFT,
    framevisible = false,
)

# --- Save -------------------------------------------------------------------
save("plot-$(THEME).png", fig; px_per_unit = 2)
Runnable source as JSON, for any HTTP client: https://api.anyplot.ai/specs/bar-spine/makie/code. Any spec id and library id listed in llms-full.txt fit the same URL shape; every URL below is complete and callable.
{
  "spec_id": "bar-spine",
  "language": "julia",
  "library": "makie",
  "page": "https://anyplot.ai/bar-spine/julia/makie",
  "hub": "https://anyplot.ai/bar-spine",
  "code_json": "https://api.anyplot.ai/specs/bar-spine/makie/code",
  "spec_json": "https://api.anyplot.ai/specs/bar-spine",
  "render_light_png": "https://storage.googleapis.com/anyplot-images/plots/bar-spine/julia/makie/plot-light.png",
  "render_dark_png": "https://storage.googleapis.com/anyplot-images/plots/bar-spine/julia/makie/plot-dark.png",
  "quality_score": 93.0,
  "license": "MIT",
  "guide": "https://anyplot.ai/llms.txt"
}
Part of Spine Plot for Two-Variable Proportions on anyplot.ai.